SlideShare a Scribd company logo
1 of 6
Download to read offline
Page 1 of 6
QSE Intra-Day Movement
Qatar Commentary
The QSE Index rose 0.8% to close at 11,750.3. Gains were led by the Insurance and
Telecoms indices, gaining 3.7% and 2.5%, respectively. Top gainers were Qatar Insurance
Co. and Ooredoo, rising 5.0% and 2.7%, respectively. Among the top losers, Medicare
Group fell 3.1%, while Al Khaleej Takaful Group declined 3.0%.
GCC Commentary
Saudi Arabia: The TASI Index rose 0.2% to close at 8,820.7. Gains were led by the
Energy & Utilities and Industrial Investment indices, rising 2.1% and 1.7%,
respectively. Saudi Cable Co. rose 9.9%, while Al Alamiya was up 4.5%.
Dubai: The DFM Index gained 0.4% to close at 4,120.1. The Telecommunication index
rose 1.1%, while the Real Estate & Construction index was up 0.7%. AMAN rose 3.8%,
while Dubai Islamic Bank was up 2.3%.
Abu Dhabi: The ADX benchmark index rose 0.6% to close at 4,821.3. The Energy index
gained 1.8%, while the Real Estate index rose 1.6%. Emirates Driving Co. rose 8.7%,
while Methaq Takaful Insurance Co. was up 7.7%.
Kuwait: The KSE Index declined 0.4% to close at 6,212.9. The Basic Material index fell
1.2%, while the Telecommunication index declined 1.1%. Kuwait Cable Vision fell 7.5%,
while Al-Nawadi Holding Co. was down 5.3%.
Oman: The MSM Index fell 0.9% to close at 6,498.6. The Financial index declined 1.0%,
while the Services index fell 0.8%. Al Sharqia Investment Holding fell 8.1%, while
Almaha Petroleum Products was down 3.5%.
Bahrain: The BHB Index declined 0.1% to close at 1,329.4. The Commercial Bank index
fell 0.2%, while the other indices ended in flat or green. Bahrain Islamic Bank fell 3.6%,
while National Bank of Bahrain was down 0.5%.
QSE Top Gainers Close* 1D% Vol. ‘000 YTD%
Qatar Insurance Co. 106.10 5.0 194.8 34.7
Ooredoo 81.00 2.7 53.5 (34.6)
Vodafone Qatar 15.40 2.1 433.4 (6.4)
Qatar General Ins. & Reins. Co. 54.10 2.1 9.7 5.5
Qatar Industrial Manufacturing 46.00 2.0 10.3 6.1
QSE Top Volume Trades Close* 1D% Vol. ‘000 YTD%
Masraf Al Rayan 43.50 (1.1) 1,199.8 (1.6)
Vodafone Qatar 15.40 2.1 433.4 (6.4)
Ezdan Holding Group 17.52 1.5 427.6 17.4
Barwa Real Estate Co. 48.00 1.1 403.4 14.6
United Development Co. 25.20 0.4 321.5 6.8
Market Indicators 03 Aug 15 02 Aug 15 %Chg.
Value Traded (QR mn) 239.6 183.0 30.9
Exch. Market Cap. (QR mn) 624,560.5 619,534.3 0.8
Volume (mn) 4.7 4.2 11.9
Number of Transactions 4,061 3,603 12.7
Companies Traded 42 42 0.0
Market Breadth 16:20 4:35 –
Market Indices Close 1D% WTD% YTD% TTM P/E
Total Return 18,264.13 0.8 (0.3) (0.3) N/A
All Share Index 3,144.37 0.7 (0.4) (0.2) 13.0
Banks 3,113.84 0.5 (0.2) (2.8) 13.7
Industrials 3,713.59 0.1 (1.1) (8.1) 13.0
Transportation 2,450.91 0.0 (0.3) 5.7 12.6
Real Estate 2,664.99 1.2 (1.3) 18.7 8.8
Insurance 5,008.69 3.7 4.9 26.5 23.4
Telecoms 1,100.64 2.5 (0.3) (25.9) 29.0
Consumer 7,139.96 (0.7) (2.4) 3.4 27.8
Al Rayan Islamic Index 4,536.44 0.0 (1.7) 10.6 13.2
GCC Top Gainers## Exchange Close# 1D% Vol. ‘000 YTD%
Qatar Insurance Co. Qatar 106.10 5.0 194.8 34.7
DP World Ltd Dubai 23.39 4.3 199.6 0.1
Saudi Arabian Mining Co. Saudi Arabia 40.53 3.3 4,077.8 0.3
Ooredoo Qatar 81.00 2.7 53.5 (34.6)
Saudi Real Estate Co. Saudi Arabia 31.98 2.6 1,547.3 (4.3)
GCC Top Losers## Exchange Close# 1D% Vol. ‘000 YTD%
Med & Gulf Ins. Saudi Arabia 35.10 (9.8) 4,259.7 (29.9)
Etihad Etisalat Co. Saudi Arabia 31.18 (7.8) 15,012.9 (29.0)
Comm. Bank of Kuwait Kuwait 0.60 (4.8) 180.7 (4.8)
Nat. Shipping Co. Saudi Arabia 43.82 (4.4) 2,488.5 0.3
Emaar Economic City. Saudi Arabia 11.70 (3.3) 33,389.9 (1.6)
Source: Bloomberg (# in Local Currency) (## GCC Top gainers/losers derived from the Bloomberg GCC 200
Index comprising of the top 200 regional equities based on market capitalization and liquidity)
QSE Top Losers Close* 1D% Vol. ‘000 YTD%
Medicare Group 173.20 (3.1) 20.2 48.0
Al Khaleej Takaful Group 40.50 (3.0) 77.0 (8.3)
Qatari Investors Group 48.00 (2.0) 37.2 15.9
Doha Insurance Co. 25.50 (1.9) 2.5 (12.1)
Islamic Holding Group 125.00 (1.7) 17.5 0.4
QSE Top Value Trades Close* 1D% Val. ‘000 YTD%
Masraf Al Rayan 43.50 (1.1) 52,103.9 (1.6)
Qatar Insurance Co. 106.10 5.0 20,343.4 34.7
Barwa Real Estate Co. 48.00 1.1 19,363.1 14.6
Commercial Bank 53.80 (0.2) 16,970.1 (13.6)
Qatar Electricity & Water Co. 217.00 (0.8) 16,890.6 15.7
Source: Bloomberg (* in QR)
Regional Indices Close 1D% WTD% MTD% YTD%
Exch. Val. Traded ($
mn)
Exchange Mkt. Cap.
($ mn)
P/E** P/B**
Dividend
Yield
Qatar* 11,750.29 0.8 (0.3) (0.3) (4.4) 65.80 171,504.3 12.1 1.8 4.3
Dubai 4,120.05 0.4 (0.6) (0.6) 9.2 92.96 104,955.8 12.1 1.4 6.3
Abu Dhabi 4,821.27 0.6 (0.3) (0.3) 6.5 43.99 130,331.0 12.1 1.5 4.6
Saudi Arabia 8,820.65 0.2 (3.1) (3.1) 5.8 1,235.96 524,496.7 18.9 2.1 3.0
Kuwait 6,212.88 (0.4) (0.7) (0.7) (4.9) 48.20 95,405.9 15.2 1.0 4.3
Oman 6,498.55 (0.9) (0.9) (0.9) 2.4 8.30 25,464.6 9.6 1.5 4.0
Bahrain 1,329.39 (0.1) (0.2) (0.2) (6.8) 0.45 20,792.2 8.4 0.9 5.3
Source: Bloomberg, Qatar Stock Exchange, Tadawul, Muscat Securities Exchange, Dubai Financial Market and Zawya (** TTM; * Value traded ($ mn) do not include special trades, if any)
11,600
11,650
11,700
11,750
11,800
9:30 10:00 10:30 11:00 11:30 12:00 12:30 13:00
Page 2 of 6
Qatar Market Commentary
 The QSE Index rose 0.8% to close at 11,750.3. The Insurance and Telecoms
indices led the gains. The index rose on the back of buying support from
non-Qatari shareholders despite selling pressure from Qatari and GCC
shareholders.
 Qatar Insurance Co. and Ooredoo were the top gainers, rising 5.0% and
2.7%, respectively. Among the top losers, Medicare Group fell 3.1%, while
Al Khaleej Takaful Group declined 3.0%.
 Volume of shares traded on Monday rose by 11.9% to 4.7mn from 4.2mn on
Sunday. However, as compared to the 30-day moving average of 4.8mn,
volume for the day was 1.3% lower. Masraf Al Rayan and Vodafone Qatar
were the most active stocks, contributing 25.5% and 9.2% to the total
volume, respectively.
Source: Qatar Stock Exchange (* as a % of traded value)
Earnings and Global Economic Data
Earnings Releases
Company Market Currency
Revenue (mn)
2Q2015
% Change
YoY
Operating Profit
(mn) 2Q2015
% Change
YoY
Net Profit (mn)
2Q2015
% Change
YoY
Sharjah Cement and Industrial
Development Co. (SCIDC)
Abu Dhabi AED 161.9 -21.7% – – 21.4 -3.7%
Viva Kuwait Kuwait KD 67.9 16.8% – – 11.2 7.8%
Dhofar Cattle Feed* Oman OMR 21.3 42.2% – – 1.5 NA
Source: Company data, DFM, ADX, MSM (*1H2015 results)
Global Economic Data
Date Market Source Indicator Period Actual Consensus Previous
08/03 US Bureau of Eco. Analysis Personal Income June 0.40% 0.30% 0.40%
08/03 US Bureau of Eco.Analysis Personal Spending June 0.20% 0.20% 0.70%
08/03 US Bureau of Eco. Analysis PCE Deflator MoM June 0.20% 0.20% 0.30%
08/03 US Bureau of Eco. Analysis PCE Deflator YoY June 0.30% 0.20% 0.20%
08/03 US US Census Bureau Construction Spending MoM June 0.10% 0.60% 1.80%
08/03 US Inst. for Supply Mgmt. ISM Manufacturing July 52.7 53.5 0.019
08/03 UK Markit Markit UK PMI Manufacturing SA July 51.9 51.5 0.002
08/03 Spain Markit Markit Spain Manufacturing PMI July 53.6 54.3 -0.01
08/03 Italy Markit Markit/ADACI Italy Manuf. PMI July 55.3 53.9 98.71
08/03 Italy Italian Treasury Budget Balance July -2.2B – 12.3B
Source: Bloomberg (s.a. = seasonally adjusted; n.s.a. = non-seasonally adjusted; w.d.a. = working day adjusted)
Overall Activity Buy %* Sell %* Net (QR)
Qatari 51.59% 58.11% (15,613,501.43)
GCC 6.10% 6.28% (433,624.63)
Non-Qatari 42.30% 35.60% 16,047,126.06
Page 3 of 6
News
Qatar
 IQCD net income surges 54.9% QoQ in 2Q2015, beat our estimates
– Significant uptick in steel revenue and petrochemical profitability
drives earnings upside. IQCD posted QR1.47bn in net income for
2Q2015, which beat our estimate of QR1.21bn by 21% and
Bloomberg mean estimate of QR1.13bn by 31%. While we were
surprised by the 20% QoQ uptick in steel revenue, steel margins
came in below estimates at 20% (net margin) vs. our model of
25%. Petrochemical net margin expanded to 52% from 34% in
1Q2015 with segment net income jumping by more than 130%
QoQ benefiting from improved product prices and higher volume
growth. The fertilizer segment top line came in line with our
estimate. Further, in its disclosure, IQCD mentioned that Qatar
Steel has opted to sell its 50% stake in the JV Qatar Steel
International to its partner without disclosing the deal price. With
Brent prices taking another swoon and going below $50/b, we
believe the stock will continue to face negative sentiment despite
2Q2015’s upside. We rate IQCD a Market Perform. We remain of
the view IQCD holds long-term potential. However, any meaningful
recovery in the stock will likely come only when optimism
regarding oil prices resurfaces. Highlights: 1) IQCD net income
surges 55% QoQ in 2Q2015. The QoQ profit growth was on the
back of a strong increase in revenue and JV income. IQCD also
reported a strong YoY sales growth of 17.1 % in 1H2015 as most of
its production facilities were on extensive planned and warranty
maintenance shutdown during 1H2014; 2) Better volumes drive
steel revenue upside but margins still somewhat depressed. The
company’s steel revenue increased 20% QoQ (down 13% YoY) to
QR1.58bn with segment net income gaining 52% QoQ (down 13%)
to QR322mn. Net margins advanced to 20% from 16% in 1Q2015
and was flattish versus 2Q2014. Steel revenue beat our estimate
by a significant 24% but net income was in line with our model
given our assumption of higher margins; 3) Petrochemicals –
higher price realizations (as expected) and some volume growth
drive significant margin expansion. Petrochemical net margin
expanded to 52% from 34% in 1Q2015 (43% in 2Q2014) with
segment net income jumping by more than 130% to QR873mn
benefiting from improved product prices and higher volume
growth. Petrochemical revenue was up 50% QoQ (+14% YoY) to
QR1.68bn. Reported revenue was 6% ahead of our model but net
income beat our estimate by 39%; 4) Fertilizers faced price
declines as expected with revenue/net falling QoQ. This segment
recorded revenue of QR1.16bn (-14% QoQ, +1% YoY) and net
income of QR262mn (-21% QoQ, +14% YoY). Reported revenue
was in-line but profits were a bit softer than our model. Catalysts:
The eventual recovery in oil prices will be a major positive. Also, QP
has stated its intention to conduct feasibility studies in order to
take advantage of the ethane feedstock available following the
decision not to proceed with the proposed Al-Karaana
Petrochemicals project. IQCD (through QAPCO) could end up
benefiting from any resulting petrochemical ventures but not
before 2018 or so. Recommendation and valuation: We maintain
our Market Perform with a price of QR153.00. IQCD is trading at
2016 EV/EBITDA multiple of 12.8x. Risks: Declining oil prices
remain a substantial risk to regional equity prices and have a
direct detrimental impact on IQCD’s operations. (QNBFS Research,
Company Press Release, QSE)
 MRDS bottom-line rises 27.6% QoQ in 2Q2015 – Mazaya Qatar Real
Estate Development Co. (MRDS) registered a jump of 27.6% QoQ
(+2.3% YoY) in its 2Q2015 earnings to QR33.2mn, despite its top-
line slipping 4.4% QoQ (down 26.6% YoY) to QR64.7mn. (QSE,
QNBFS Research)
 QTA: Qatar gets 1,400 more rooms for travelers – According to
Qatar Tourism Authority’s (QTA) mid-year tourism performance
report for 2015, around 11 new hotels and hotel apartments have
opened in Qatar since the start of 2015 offering about 1,400
additional rooms to accommodate the growing number of visitors
and tourists to the country. The report noted that the new
properties are a mix of luxury, standard hotel and hotel apartment
segments. These include five 5-star, one 4-star and five 3-star
hotels. (Gulf-Times.com)
 Qatari Diar venture agrees to sell $857mn London offices – A
venture between Qatari Diar Real Estate Investment Co and
Canary Wharf Group agreed to sell two office buildings in London’s
South Bank district to Almacantar for over $857mn. Almacantar,
led by the former Land Securities executive Mike Hussey, is buying
the buildings near the Waterloo railway station before their
completion in 2018. One of them will be leased by a unit of Royal
Dutch Shell and occupiers will be sought for the other. (Gulf-
Times.com)
 Public urged to bring illegally partitioned villas to authority’s notice
– The Ministry of Municipality and Urban Planning has urged the
public to bring to its notice villas and apartments that have been
partitioned illegally. The Ministry said that it is the duty of people
to report cases involving illegally partitioned homes as they pose
grave threats to public safety and adversely impact infrastructure
and public services. The Ministry said tampered electrical wirings
and water pipes in illegally partitioned homes pose a grave threat
to the safety of people. Municipal inspectors have been asked to
watch buildings from outside and based on air-conditioners and
cars parked outside and other such features, they can assess
whether there is a violation. (Peninsula Qatar)
International
 ISM: US manufacturing cools in July – Manufacturing in the US
cooled in July from the highest level in five months, a sign of fitful
progress in the industry. The Institute for Supply Management’s
(ISM) national factory activity index fell to 52.7 from a June
reading of 53.5 that was the fastest since the start of 2015.
Readings greater than 50 indicate expansion. The ISM group’s new
orders gauge climbed to 56.5 from 56 in June and a measure of
production rose to 56 from 54. The measure of export orders fell
to 48 from 49.5. A pickup in the ISM’s orders index and increased
production indicate steady consumer spending is underpinning
activity at American factories. The employment index declined to
52.7 from 55.5. Meanwhile, the Commerce Department said
consumer spending, which accounts for over two-thirds of the US
economic activity, rose by 0.2% in June after a 0.7% increase in
May. Consumer spending in June was restrained by a decline in
auto purchases. (Bloomberg, Reuters)
 Eurozone factory activity steady in July despite Greek crisis – The
Eurozone factory activity grew faster than estimates in July, easing
only slightly from June’s 14-month record pace as rising prices
kept new orders in check. Markit’s final Eurozone Manufacturing
Purchasing Managers’ Index stood at 52.4, comfortably above the
50 level that separates growth from contraction. That beat a
preliminary estimate of 52.2 but was just shy of 52.5 reading of
June. The new order growth eased in July - the subindex dipped to
52.2 from 52.7 - as factories increased their prices for a second
month, albeit at a weaker rate than in June. However, an index
measuring output, which is seen as a good guide to growth held
steady at June’s 53.6, surpassing the preliminary reading of 53.4.
(Reuters)
 S&P: Global capital spending to fall in 2015 for third straight year –
According to a global capex survey released by Standard & Poor’s
(S&P), the world’s top-spending corporations are set to cut back
on investment in 2015 for the third year in a row, as a
commodities sell-off hits confidence. The capital expenditure (or
Page 4 of 6
capex) by non-financial companies is set to fall by 1% in 2015 and
by 4% in 2016. The report said the decline in 2015 would be
mainly due to the energy and materials industry, which is set to
cut spending by 14% as it fights a loss of confidence in
commodities amid fears over demand from China. Excluding
energy and materials, global capital spending is estimated to rise
by 8%. The report said the next hurdle for company spending will
be a transition to higher interest rates, especially in the US.
(Reuters)
 Britain starts RBS sale with £2bn stake sale – Britain started the
sale of a £2bn stake in the Royal Bank of Scotland (RBS) on
Monday, beginning the disposal of its holding in the bank seven
years after a multi-billion pound bailout at the height of the
financial crisis. UK Financial Investments, the body that holds the
government’s stake in RBS, said it would sell around 600mn
shares, representing 5.2% of the bank, in a quick-fire sale to
institutional investors after the market closed. Britain owns 78%
of RBS after rescuing it with £45.8bn pounds of taxpayer cash at
the peak of the credit crunch in 2008. Its stake will reduce to
73.2%. A bookrunner on the deal said shares were sold at a price
of 330 pence each. The government will make a loss on the first
RBS sale since the shares were bought at an average price of 502
pence each. The disposal marks a milestone in Britain’s recovery
from the 2007-09 financial crisis and its drive to return RBS and
Lloyds Banking Group to the private sector. (Reuters)
 Chinese factory activity contraction exceeds earlier estimate in July
– Economic headwinds facing Chinese manufacturers intensified in
July, with conditions deteriorating to their weakest level in two
years. The factory activity shrank more than initially estimated as
final Caixin/Markit China Manufacturing PMI came in at 47.8 in
July versus 49.4 in June. Similar business activity surveys for
Taiwan, South Korea and Indonesia - all heavily reliant on Chinese
demand - reflected varying degrees of weakness that is clouding
hopes for a convincing global recovery in 2H2015. Providing a bit
of relief, the manufacturing activity in Japan and India both picked
up in July thanks to new orders, though analysts questioned if the
momentum can be sustained. (Reuters)
 HSBC 1H2015 profit rises 10% led by Asian earnings – HSBC
Holdings’ 1H2015 profit beat analysts’ estimates, buoyed by
income from Asia and securities trading, and the bank agreed to
sell its Brazilian operations for around $1bn more than expected.
The pretax profit rose by 10% YoY to $13.6bn, driven by a 19%
jump in Asian earnings and surpassing the average estimate of
$12.5bn. While HSBC’s 1H2015 revenue rose to $32.9bn from
$31.2bn, net operating income in Asia jumped 16% to $14.1bn.
The results give a boost to Chief Executive Officer Stuart Gulliver’s
strategy to shift investment to Asia, the bank’s best-performing
region, while cutting unprofitable divisions. Meanwhile, Banco
Bradesco SA agreed to buy HSBC’s Brazilian unit for $5.2bn in
cash. (Bloomberg)
Regional
 Saudi Arabia, UAE attract over 75% of MENA investment activity by
value – The MENA Private Equity Association, in its ninth “MENA
Private Equity & Venture Capital” annual report, said that the UAE
and Saudi Arabia attracted over 75% of the Middle East and North
Africa (MENA) region investment activity by value in 2014,
reflecting their scale and stability as well as increased availability
of larger target assets. The report said that the two countries
accounted for a lower proportion of transaction volumes at 31%.
Total number of known investment volumes increased to 72 in
2014 as compared to 66 in 2013. Values of disclosed investments
also increased 118% to $1.5bn. Total funds raised in 2014 had
reached the highest level since 2008 at $1,229mn as compared to
$744mn in 2013. In 2014, the greatest investment values were in
oil & gas and demographic-driven sectors such as education,
services and food & beverage. (GulfBase.com)
 SPA: Saudi Arabia approves contracts worth SR1.06bn – The Saudi
Press Agency (SPA) has reported that Saudi Arabia has approved
contracts worth SR1.06bn for 168 municipal projects in 14
governorates. The projects include storm water drainage systems,
walkways, environmental health projects, seafront development &
construction of municipal buildings and public facilities as well as
several consultancy contracts. A spokesman for the Ministry of
Municipal and Rural Affairs said that projects worth SR157.73mn,
including public parks, walkways, cultural centers and water
networks, will be carried out in the Riyadh province, while
SR174.55mn contracts will be implemented in Jeddah. Among the
key projects in Jeddah are the development of the South Corniche
and a study on improving the city's performance. Similarly,
projects worth SR45.5mn have been approved for Madinah. They
include irrigation lines and a livestock market as well as the
maintenance of Al Baqee Graveyard. (GulfBase.com)
 Saudi Arabia to raise September oil price, wary of losing market
share – Saudi Arabia is expected to raise prices for crude it sells to
Asia in September 2015 due to a stronger Dubai benchmark,
traders and analysts said, adding that the top oil exporter will be
wary of a hike so big it would threaten its market share. The
OPEC’s efforts to discourage growth from rival supply sources are
bearing fruit as the group continued to pump at record levels in
July 2015. Still, raising prices when Asian refiners are cutting runs
because of weak margins could hurt Saudi oil demand. (Reuters)
 JLL: Riyadh real estate market see limited growth in 2Q2015 –
According to Jones Lang LaSalle’s (JLL) “Riyadh Real Estate Market
Overview” report for 2Q2015, most sectors of Riyadh real estate
market see limited growth in 2Q2015. National Director and
Country Head of JLL KSA, Mr. Jamil Ghaznawi said that there has
been relatively little change in the real estate market in Riyadh in
2Q2015 although recent changes to mortgage regulations have
caused downward pressure in the residential sales market. The
office market has seen little change in occupancies and rentals
over the past quarter but rents are expected to soften going
forward as a result of major new completions in the long delayed
KAFD and ITCC projects during 2016. Retail remains one of the
best performing sectors in Riyadh, as super-regional and regional
mall performance continues to improve and retail spending
remains strong. (GulfBase.com)
 SFC appoints CEO – Saudi Fransi Capital (SFC) has appointed Mr.
Waleed Fatani as its Chief Executive Officer (CEO). Fatani has a
wide expertise of 21 years in the financing and banking fields. He
acted as a treasurer as well as capital market and investment
advisor at Abdul Latif Jameel Co. In addition, he served as the
manager of Deutsche Bank – Saudi Arabia, as well as head of
Banque Saudi Fransi treasury and member of the bank’s senior
management. (GulfBase.com)
 StanChart: UAE energy subsidy reforms to boost public finances –
According to Standard Chartered Bank (StanChart) MENA
economist Carla Slim, the recent fuel and power subsidy reforms in
the UAE will have a sustainable impact on the government’s
finances and could be visible in fiscal balances. Slim said that
StanChart revised higher its 2016 fiscal surplus forecast to 2.5% of
GDP, from 2.2% previously, to capture the savings on current
expenditure in 2016. Energy subsidies have been a drag on
financial resources that could be used more productively
elsewhere such as education and infrastructure. In addition, they
distort consumer incentives and they are not environmentally
sustainable. (GulfBase.com)
 Drydocks World creditors select Moelis as adviser – According to
sources, creditors of Drydocks World, the Dubai government-
Page 5 of 6
owned company seeking to revise part of a $2.3bn debt
restructuring deal which it signed in 2012, have chosen Moelis &
Co as their adviser. The selection of the New York-based advisory
company should open the way to Drydocks offering a proposal to
creditors, a move expected to happen later in 3Q2015, with a view
to closing a deal as early as the end of 4Q2015. (Reuters)
 ADIB: Abu Dhabi housing rents gain 3% in 2Q2015 – According to
ADIB / MPM Real Estate report, Abu Dhabi residential rents rose
on average by 3% during 2Q2015, and are expected to rise further
in 2015 as limited new supply enters the UAE capital. 2Q2015
witnessed only 1,647 units entering the market, taking 2015
addition to 2,397 units with an additional 4,200 units expected to
be completed by 2015-end. The 2015 supply represents a mere
2.9% increase in total housing stock in the capital and is the lowest
level of increase for five years. The average annual growth has
been around 5%. (GulfBase.com)
 DCCI registers 8,830 new companies in 1H2015 – The Dubai
Chamber of Commerce & Industry (DCCI) has registered a
substantial growth in its membership base, which the non-profit
business facilitator accredits to Dubai's rising profile as a sound
business destination and its attractiveness to global investors. A
total of 8,830 new companies joined DCCI in 1H2015, which can be
attributed to a record number of 335 international delegation
visits to the Chamber. This brought the total number of members
to over 177,000. (Zawya, Bloomberg)
 Agility: Dubai logistics infrastructure key to unlocking Africa
potential – According to Sylvain Kluba, Chief Operating Officer of
Middle East and Africa at Agility, Dubai's logistics infrastructure is
providing huge opportunities for multinationals to expand their
business in Africa. Kluba said that African businesses are also
looking to Dubai to reach potential customers within the European
and Asian markets because of the Emirate's air, land and sea
connections. He said that Dubai offers unprecedented
opportunities to capitalize on the strength of its favorable
geographic location. He added that the turnaround time at Jebel Ali
Port is among the quickest in the world. The Jebel Ali Free Zone's
proximity to the main container terminal, airports and customs
authorities provides an ideal location to operate a regional
distribution center. (GulfBase.com)
 NBAD receives SCA nod for securities lending & borrowing – The
Securities & Commodities Authority (SCA) has granted approval to
the National Bank of Abu Dhabi (NBAD) to engage in securities
lending and borrowing activities, as part of its sustained efforts to
develop local capital markets and meet the needs of investors and
all strategic partners. NBAD is the first to receive this crucial
approval to undertake such activities within the UAE capital
markets. According to SCA, the approval will bolster the securities
industry in tandem with the growth and development experienced
in the region in general, and the local capital markets in particular.
(GulfBase.com)
 Oman boosts oil production to record high in June 2015 – Oman has
ramped up its oil production to a record high in June 2015, adding
to a global supply glut that has hit oil prices, as the Gulf Arab
country compensates for the drop in its oil revenue. June 2015
production reached 992,700 barrels per day (bpd) of crude oil and
light oil condensate, the highest ever according to official records
going back to 2002. Oman produced an average of 975,000 bpd in
May 2015. The sultanate is under pressure to pump more oil to
make up for the drop in the price. It hopes to boost its crude oil
production by 5% to 1mn bpd in 2015. (Zawya)
 NCSI: Oman budget deficit reaches whopping OMR1,501.1mn –
According to the National Centre for Statistics and Information
(NCSI), Oman’s budget deficit for January to May 2015 surged
ahead to OMR1,501.1mn, against a surplus of OMR232.9mn for
January to May 2014, mainly due to a plunge in oil prices. This is
against a government target of OMR2.5bn deficit for the whole of
2015. The government’s total revenue dipped by 36.2% to
OMR3,858.1mn for January to May 2015, as compared to
OMR6,044.1mn during January to May 2014, mainly on account of
a drastic fall in oil revenue. Net oil revenue plunged by 46.3% to
OMR2,325.9mn from OMR4,335.1mn. Average price of Oman
Crude dipped by 43.7% to $59.3 per barrel in 1H2015 from
$105.38 a barrel in 1H2014. However, crude oil production was up
by 2.9% at 175.67mn barrels in 1H2015. (GulfBase.com)
 Al Hassan Engineering unit receives LOI from HECC Korea – Al
Hassan Engineering Co. Abu Dhabi, 49% owned by Al Hassan
Engineering Company, has received a letter of intent (LOI) from
Hyundai Engineering & Construction Company (HECC) Korea for
$9mn instrumentation works at SARB package 4. The duration of
the project is 22 months from August 2015. (MSM)
 GFH's name changed to 'GFH Financial Group BSC' – Bahrain Bourse
has announced that in line with Gulf Finance House B.S.C. request
and with its extraordinary general meeting approval obtained on
April 12, 2015 and completion of the relevant authorities
formalities, Gulf Finance House B.S.C. commercial name will be
changed to GFH Financial Group B.S.C. effective from August 4,
2015. (Bahrain Bourse)
Contacts
Saugata Sarkar Sahbi Kasraoui QNB Financial Services SPC
Head of Research Head of HNI Contact Center: (+974) 4476 6666
Tel: (+974) 4476 6534 Tel: (+974) 4476 6544 PO Box 24025
saugata.sarkar@qnbfs.com.qa sahbi.alkasraoui@qnbfs.com.qa Doha, Qatar
Disclaimer and Copyright Notice: This publication has been prepared by QNB Financial Services SPC (“QNBFS”) a wholly-owned subsidiary of QNB SAQ (“QNB”). QNBFS is regulated by the Qatar Financial
Markets Authority and the Qatar Exchange QNB SAQ is regulated by the Qatar Central Bank. This publication expresses the views and opinions of QNBFS at a given time only. It is not an offer, promotion or
recommendation to buy or sell securities or other investments, nor is it intended to constitute legal, tax, accounting, or financial advice. QNBFS accepts no liability whatsoever for any direct or indirect
losses arising from use of this report. Any investment decision should depend on the individual circumstances of the investor and be based on specifically engaged investment advice. We therefore
strongly advise potential investors to seek independent professional advice before making any investment decision. Although the information in this report has been obtained from sources that QNBFS
believes to be reliable, we have not independently verified such information and it may not be accurate or complete. QNBFS does not make any representations or warranties as to the accuracy and
completeness of the information it may contain, and declines any liability in that respect. For reports dealing with Technical Analysis, expressed opinions and/or recommendations may be different or
contrary to the opinions/recommendations of QNBFS Fundamental Research as a result of depending solely on the historical technical data (price and volume). QNBFS reserves the right to amend the
views and opinions expressed in this publication at any time. It may also express viewpoints or make investment decisions that differ significantly from, or even contradict, the views and opinions
included in this report. This report may not be reproduced in whole or in part without permission from QNBFS
COPYRIGHT: No part of this document may be reproduced without the explicit written permission of QNBFS.
Page 6 of 6
Rebased Performance Daily Index Performance
Source: Bloomberg Source: Bloomberg
Source: Bloomberg Source: Bloomberg (*$ adjusted returns)
80.0
100.0
120.0
140.0
160.0
180.0
Jul-11 Jul-12 Jul-13 Jul-14 Jul-15
QSE Index S&P Pan Arab S&P GCC
0.2%
0.8%
(0.4%)
(0.1%)
(0.9%)
0.6%
0.4%
(1.0%)
(0.5%)
0.0%
0.5%
1.0%
SaudiArabia
Qatar
Kuwait
Bahrain
Oman
AbuDhabi
Dubai
Asset/Currency Performance Close ($) 1D% WTD% YTD% Global Indices Performance Close 1D%* WTD%* YTD%*
Gold/Ounce 1,086.80 (0.8) (0.8) (8.3) MSCI World Index 1,761.18 (0.3) (0.3) 3.0
Silver/Ounce 14.52 (1.8) (1.8) (7.5) DJ Industrial 17,598.20 (0.5) (0.5) (1.3)
Crude Oil (Brent)/Barrel (FM
Future)
49.52 (5.2) (5.2) (13.6) S&P 500 2,098.04 (0.3) (0.3) 1.9
Crude Oil (WTI)/Barrel (FM
Future)
45.17 (4.1) (4.1) (15.2) NASDAQ 100 5,115.38 (0.3) (0.3) 8.0
Natural Gas (Henry
Hub)/MMBtu
2.75 (0.6) (0.6) (8.1) STOXX 600 399.44 0.4 0.4 5.6
LPG Propane (Arab Gulf)/Ton 36.50 (3.3) (3.3) (25.5) DAX 11,443.72 0.8 0.8 5.2
LPG Butane (Arab Gulf)/Ton 48.00 (5.0) (5.0) (23.5) FTSE 100 6,688.62 (0.3) (0.3) 1.9
Euro 1.10 (0.3) (0.3) (9.5) CAC 40 5,120.52 0.4 0.4 8.6
Yen 124.03 0.1 0.1 3.5 Nikkei 20,548.11 (0.1) (0.1) 13.6
GBP 1.56 (0.2) (0.2) 0.1 MSCI EM 890.85 (1.2) (1.2) (6.8)
CHF 1.03 (0.3) (0.3) 2.6 SHANGHAI SE Composite 3,622.91 (1.0) (1.0) 12.1
AUD 0.73 (0.3) (0.3) (10.9) HANG SENG 24,411.42 (0.9) (0.9) 3.4
USD Index 97.49 0.2 0.2 8.0 BSE SENSEX 28,187.06 0.1 0.1 1.2
RUB 63.55 3.0 3.0 4.6 Bovespa 50,138.05 (2.4) (2.4) (23.1)
BRL 0.29 (0.9) (0.9) (23.2) RTS 834.89 (2.8) (2.8) 5.6
140.5
121.6
116.8

More Related Content

What's hot

QNBFS Daily Market Report October 19, 2021
QNBFS Daily Market Report October 19, 2021QNBFS Daily Market Report October 19, 2021
QNBFS Daily Market Report October 19, 2021QNB Group
 
QNBFS Daily Market Report October 25, 2021
QNBFS Daily Market Report October 25, 2021QNBFS Daily Market Report October 25, 2021
QNBFS Daily Market Report October 25, 2021QNB Group
 
QNBFS Daily Market Report October 24, 2021
QNBFS Daily Market Report October 24, 2021QNBFS Daily Market Report October 24, 2021
QNBFS Daily Market Report October 24, 2021QNB Group
 
QNBFS Daily Market Report October 31, 2021
QNBFS Daily Market Report October 31, 2021QNBFS Daily Market Report October 31, 2021
QNBFS Daily Market Report October 31, 2021QNB Group
 
QNBFS Daily Market Report September 08, 2019
QNBFS Daily Market Report September 08, 2019QNBFS Daily Market Report September 08, 2019
QNBFS Daily Market Report September 08, 2019QNB Group
 
QNBFS Daily Market Report September 29, 2021
QNBFS Daily Market Report September 29, 2021QNBFS Daily Market Report September 29, 2021
QNBFS Daily Market Report September 29, 2021QNB Group
 
QNBFS Daily Market Report September 08, 2021
QNBFS Daily Market Report September 08, 2021QNBFS Daily Market Report September 08, 2021
QNBFS Daily Market Report September 08, 2021QNB Group
 
QNBFS Daily Market Report June 02, 2021
QNBFS Daily Market Report June 02, 2021QNBFS Daily Market Report June 02, 2021
QNBFS Daily Market Report June 02, 2021QNB Group
 
29 July Technical Market Report
29 July Technical Market Report29 July Technical Market Report
29 July Technical Market ReportQNB Group
 
QNBFS Daily Market Report February 16, 2022
QNBFS Daily Market Report February 16, 2022QNBFS Daily Market Report February 16, 2022
QNBFS Daily Market Report February 16, 2022QNB Group
 
QNBFS Daily Market Report October 17, 2021
QNBFS Daily Market Report October 17, 2021QNBFS Daily Market Report October 17, 2021
QNBFS Daily Market Report October 17, 2021QNB Group
 
29 June Daily market report
29 June Daily market report 29 June Daily market report
29 June Daily market report QNB Group
 
QNBFS Daily Market Report May 27, 2021
QNBFS Daily Market Report May 27, 2021QNBFS Daily Market Report May 27, 2021
QNBFS Daily Market Report May 27, 2021QNB Group
 
QNBFS Daily Market Report October 27, 2021
QNBFS Daily Market Report October 27, 2021QNBFS Daily Market Report October 27, 2021
QNBFS Daily Market Report October 27, 2021QNB Group
 
QNBFS Daily Market Report October 12, 2021
QNBFS Daily Market Report October 12, 2021QNBFS Daily Market Report October 12, 2021
QNBFS Daily Market Report October 12, 2021QNB Group
 
QNBFS Daily Market Report April 11, 2021
QNBFS Daily Market Report April 11, 2021QNBFS Daily Market Report April 11, 2021
QNBFS Daily Market Report April 11, 2021QNB Group
 
QNBFS Daily Market Report March 10, 2022
QNBFS Daily Market Report March 10, 2022QNBFS Daily Market Report March 10, 2022
QNBFS Daily Market Report March 10, 2022QNB Group
 
QNBFS Daily Market Report May 4, 2017
QNBFS Daily Market Report May 4, 2017QNBFS Daily Market Report May 4, 2017
QNBFS Daily Market Report May 4, 2017QNB Group
 
QNBFS Daily Market Report October 08, 2019
QNBFS Daily Market Report October 08, 2019QNBFS Daily Market Report October 08, 2019
QNBFS Daily Market Report October 08, 2019QNB Group
 
20 August Daily market report
20 August Daily market report20 August Daily market report
20 August Daily market reportQNB Group
 

What's hot (20)

QNBFS Daily Market Report October 19, 2021
QNBFS Daily Market Report October 19, 2021QNBFS Daily Market Report October 19, 2021
QNBFS Daily Market Report October 19, 2021
 
QNBFS Daily Market Report October 25, 2021
QNBFS Daily Market Report October 25, 2021QNBFS Daily Market Report October 25, 2021
QNBFS Daily Market Report October 25, 2021
 
QNBFS Daily Market Report October 24, 2021
QNBFS Daily Market Report October 24, 2021QNBFS Daily Market Report October 24, 2021
QNBFS Daily Market Report October 24, 2021
 
QNBFS Daily Market Report October 31, 2021
QNBFS Daily Market Report October 31, 2021QNBFS Daily Market Report October 31, 2021
QNBFS Daily Market Report October 31, 2021
 
QNBFS Daily Market Report September 08, 2019
QNBFS Daily Market Report September 08, 2019QNBFS Daily Market Report September 08, 2019
QNBFS Daily Market Report September 08, 2019
 
QNBFS Daily Market Report September 29, 2021
QNBFS Daily Market Report September 29, 2021QNBFS Daily Market Report September 29, 2021
QNBFS Daily Market Report September 29, 2021
 
QNBFS Daily Market Report September 08, 2021
QNBFS Daily Market Report September 08, 2021QNBFS Daily Market Report September 08, 2021
QNBFS Daily Market Report September 08, 2021
 
QNBFS Daily Market Report June 02, 2021
QNBFS Daily Market Report June 02, 2021QNBFS Daily Market Report June 02, 2021
QNBFS Daily Market Report June 02, 2021
 
29 July Technical Market Report
29 July Technical Market Report29 July Technical Market Report
29 July Technical Market Report
 
QNBFS Daily Market Report February 16, 2022
QNBFS Daily Market Report February 16, 2022QNBFS Daily Market Report February 16, 2022
QNBFS Daily Market Report February 16, 2022
 
QNBFS Daily Market Report October 17, 2021
QNBFS Daily Market Report October 17, 2021QNBFS Daily Market Report October 17, 2021
QNBFS Daily Market Report October 17, 2021
 
29 June Daily market report
29 June Daily market report 29 June Daily market report
29 June Daily market report
 
QNBFS Daily Market Report May 27, 2021
QNBFS Daily Market Report May 27, 2021QNBFS Daily Market Report May 27, 2021
QNBFS Daily Market Report May 27, 2021
 
QNBFS Daily Market Report October 27, 2021
QNBFS Daily Market Report October 27, 2021QNBFS Daily Market Report October 27, 2021
QNBFS Daily Market Report October 27, 2021
 
QNBFS Daily Market Report October 12, 2021
QNBFS Daily Market Report October 12, 2021QNBFS Daily Market Report October 12, 2021
QNBFS Daily Market Report October 12, 2021
 
QNBFS Daily Market Report April 11, 2021
QNBFS Daily Market Report April 11, 2021QNBFS Daily Market Report April 11, 2021
QNBFS Daily Market Report April 11, 2021
 
QNBFS Daily Market Report March 10, 2022
QNBFS Daily Market Report March 10, 2022QNBFS Daily Market Report March 10, 2022
QNBFS Daily Market Report March 10, 2022
 
QNBFS Daily Market Report May 4, 2017
QNBFS Daily Market Report May 4, 2017QNBFS Daily Market Report May 4, 2017
QNBFS Daily Market Report May 4, 2017
 
QNBFS Daily Market Report October 08, 2019
QNBFS Daily Market Report October 08, 2019QNBFS Daily Market Report October 08, 2019
QNBFS Daily Market Report October 08, 2019
 
20 August Daily market report
20 August Daily market report20 August Daily market report
20 August Daily market report
 

Similar to QSE Rises 0.8% Led by Insurance, Telecom Indices

QNBFS Daily Market Report April 01, 2021
QNBFS Daily Market Report April 01, 2021QNBFS Daily Market Report April 01, 2021
QNBFS Daily Market Report April 01, 2021QNB Group
 
5 August Daily market report
5 August Daily market report5 August Daily market report
5 August Daily market reportQNB Group
 
9 July Technical Market Report
9 July Technical Market Report9 July Technical Market Report
9 July Technical Market ReportQNB Group
 
1 July Daily market report
1 July Daily market report 1 July Daily market report
1 July Daily market report QNB Group
 
31 July Technical Market Report
31 July Technical Market Report31 July Technical Market Report
31 July Technical Market ReportQNB Group
 
QNBFS Daily Market Report September 01, 2020
QNBFS Daily Market Report September 01, 2020QNBFS Daily Market Report September 01, 2020
QNBFS Daily Market Report September 01, 2020QNB Group
 
18 June Technical Market Report
18 June Technical Market Report18 June Technical Market Report
18 June Technical Market ReportQNB Group
 
26 March Daily market report
26 March Daily market report 26 March Daily market report
26 March Daily market report QNB Group
 
14 August Daily market report
14 August Daily market report 14 August Daily market report
14 August Daily market report QNB Group
 
QNBFS Daily Market Report September 01, 2021
QNBFS Daily Market Report September 01, 2021QNBFS Daily Market Report September 01, 2021
QNBFS Daily Market Report September 01, 2021QNB Group
 
QNBFS Daily Market Report October 30, 2019
QNBFS Daily Market Report October 30, 2019QNBFS Daily Market Report October 30, 2019
QNBFS Daily Market Report October 30, 2019QNB Group
 
7 August Daily market report
7 August Daily market report7 August Daily market report
7 August Daily market reportQNB Group
 
QNBFS Daily Market Report May 09, 2021
QNBFS Daily Market Report May 09, 2021QNBFS Daily Market Report May 09, 2021
QNBFS Daily Market Report May 09, 2021QNB Group
 
3 June Technical Market Report
3 June Technical Market Report3 June Technical Market Report
3 June Technical Market ReportQNB Group
 
9 July Daily market report
9 July Daily market report9 July Daily market report
9 July Daily market reportQNB Group
 
8 June Daily market report
8 June Daily market report 8 June Daily market report
8 June Daily market report QNB Group
 
9 June Daily market report
9 June Daily market report 9 June Daily market report
9 June Daily market report QNB Group
 
QNBFS Daily Market Report March 6, 2019
QNBFS Daily Market Report March 6, 2019QNBFS Daily Market Report March 6, 2019
QNBFS Daily Market Report March 6, 2019QNB Group
 
27 May Daily market report
27 May Daily market report27 May Daily market report
27 May Daily market reportQNB Group
 
QNBFS Daily Market Report July 06, 2022
QNBFS Daily Market Report July 06, 2022QNBFS Daily Market Report July 06, 2022
QNBFS Daily Market Report July 06, 2022QNB Group
 

Similar to QSE Rises 0.8% Led by Insurance, Telecom Indices (20)

QNBFS Daily Market Report April 01, 2021
QNBFS Daily Market Report April 01, 2021QNBFS Daily Market Report April 01, 2021
QNBFS Daily Market Report April 01, 2021
 
5 August Daily market report
5 August Daily market report5 August Daily market report
5 August Daily market report
 
9 July Technical Market Report
9 July Technical Market Report9 July Technical Market Report
9 July Technical Market Report
 
1 July Daily market report
1 July Daily market report 1 July Daily market report
1 July Daily market report
 
31 July Technical Market Report
31 July Technical Market Report31 July Technical Market Report
31 July Technical Market Report
 
QNBFS Daily Market Report September 01, 2020
QNBFS Daily Market Report September 01, 2020QNBFS Daily Market Report September 01, 2020
QNBFS Daily Market Report September 01, 2020
 
18 June Technical Market Report
18 June Technical Market Report18 June Technical Market Report
18 June Technical Market Report
 
26 March Daily market report
26 March Daily market report 26 March Daily market report
26 March Daily market report
 
14 August Daily market report
14 August Daily market report 14 August Daily market report
14 August Daily market report
 
QNBFS Daily Market Report September 01, 2021
QNBFS Daily Market Report September 01, 2021QNBFS Daily Market Report September 01, 2021
QNBFS Daily Market Report September 01, 2021
 
QNBFS Daily Market Report October 30, 2019
QNBFS Daily Market Report October 30, 2019QNBFS Daily Market Report October 30, 2019
QNBFS Daily Market Report October 30, 2019
 
7 August Daily market report
7 August Daily market report7 August Daily market report
7 August Daily market report
 
QNBFS Daily Market Report May 09, 2021
QNBFS Daily Market Report May 09, 2021QNBFS Daily Market Report May 09, 2021
QNBFS Daily Market Report May 09, 2021
 
3 June Technical Market Report
3 June Technical Market Report3 June Technical Market Report
3 June Technical Market Report
 
9 July Daily market report
9 July Daily market report9 July Daily market report
9 July Daily market report
 
8 June Daily market report
8 June Daily market report 8 June Daily market report
8 June Daily market report
 
9 June Daily market report
9 June Daily market report 9 June Daily market report
9 June Daily market report
 
QNBFS Daily Market Report March 6, 2019
QNBFS Daily Market Report March 6, 2019QNBFS Daily Market Report March 6, 2019
QNBFS Daily Market Report March 6, 2019
 
27 May Daily market report
27 May Daily market report27 May Daily market report
27 May Daily market report
 
QNBFS Daily Market Report July 06, 2022
QNBFS Daily Market Report July 06, 2022QNBFS Daily Market Report July 06, 2022
QNBFS Daily Market Report July 06, 2022
 

More from QNB Group

QNBFS Daily Market Report December 24, 2023
QNBFS Daily Market Report December 24, 2023QNBFS Daily Market Report December 24, 2023
QNBFS Daily Market Report December 24, 2023QNB Group
 
QNBFS Daily Market Report November 29, 2023
QNBFS Daily Market Report November 29, 2023QNBFS Daily Market Report November 29, 2023
QNBFS Daily Market Report November 29, 2023QNB Group
 
QNBFS Weekly Market Report November 23, 2023
QNBFS Weekly Market Report November 23, 2023QNBFS Weekly Market Report November 23, 2023
QNBFS Weekly Market Report November 23, 2023QNB Group
 
QNBFS Weekly Market Report November 16, 2023
QNBFS Weekly Market Report November 16, 2023QNBFS Weekly Market Report November 16, 2023
QNBFS Weekly Market Report November 16, 2023QNB Group
 
QNBFS Daily Technical Trader Qatar - November 14, 2023 التحليل الفني اليومي ل...
QNBFS Daily Technical Trader Qatar - November 14, 2023 التحليل الفني اليومي ل...QNBFS Daily Technical Trader Qatar - November 14, 2023 التحليل الفني اليومي ل...
QNBFS Daily Technical Trader Qatar - November 14, 2023 التحليل الفني اليومي ل...QNB Group
 
QNBFS Daily Technical Trader Qatar - November 06, 2023 التحليل الفني اليومي ل...
QNBFS Daily Technical Trader Qatar - November 06, 2023 التحليل الفني اليومي ل...QNBFS Daily Technical Trader Qatar - November 06, 2023 التحليل الفني اليومي ل...
QNBFS Daily Technical Trader Qatar - November 06, 2023 التحليل الفني اليومي ل...QNB Group
 
QNBFS Daily Market Report October 30, 2023
QNBFS Daily Market Report October 30, 2023QNBFS Daily Market Report October 30, 2023
QNBFS Daily Market Report October 30, 2023QNB Group
 
QNBFS Daily Technical Trader Qatar - October 25, 2023 التحليل الفني اليومي لب...
QNBFS Daily Technical Trader Qatar - October 25, 2023 التحليل الفني اليومي لب...QNBFS Daily Technical Trader Qatar - October 25, 2023 التحليل الفني اليومي لب...
QNBFS Daily Technical Trader Qatar - October 25, 2023 التحليل الفني اليومي لب...QNB Group
 
QNBFS Daily Technical Trader Qatar - October 10, 2023 التحليل الفني اليومي لب...
QNBFS Daily Technical Trader Qatar - October 10, 2023 التحليل الفني اليومي لب...QNBFS Daily Technical Trader Qatar - October 10, 2023 التحليل الفني اليومي لب...
QNBFS Daily Technical Trader Qatar - October 10, 2023 التحليل الفني اليومي لب...QNB Group
 
QNBFS Daily Technical Trader Qatar - October 11, 2023 التحليل الفني اليومي لب...
QNBFS Daily Technical Trader Qatar - October 11, 2023 التحليل الفني اليومي لب...QNBFS Daily Technical Trader Qatar - October 11, 2023 التحليل الفني اليومي لب...
QNBFS Daily Technical Trader Qatar - October 11, 2023 التحليل الفني اليومي لب...QNB Group
 
QNBFS Daily Technical Trader Qatar - October 10, 2023 التحليل الفني اليومي لب...
QNBFS Daily Technical Trader Qatar - October 10, 2023 التحليل الفني اليومي لب...QNBFS Daily Technical Trader Qatar - October 10, 2023 التحليل الفني اليومي لب...
QNBFS Daily Technical Trader Qatar - October 10, 2023 التحليل الفني اليومي لب...QNB Group
 
QNBFS Daily Market Report October 04, 2023
QNBFS Daily Market Report October 04, 2023QNBFS Daily Market Report October 04, 2023
QNBFS Daily Market Report October 04, 2023QNB Group
 
QNBFS Daily Technical Trader Qatar - October 04, 2023 التحليل الفني اليومي لب...
QNBFS Daily Technical Trader Qatar - October 04, 2023 التحليل الفني اليومي لب...QNBFS Daily Technical Trader Qatar - October 04, 2023 التحليل الفني اليومي لب...
QNBFS Daily Technical Trader Qatar - October 04, 2023 التحليل الفني اليومي لب...QNB Group
 
QNBFS Daily Technical Trader Qatar - September 28, 2023 التحليل الفني اليومي ...
QNBFS Daily Technical Trader Qatar - September 28, 2023 التحليل الفني اليومي ...QNBFS Daily Technical Trader Qatar - September 28, 2023 التحليل الفني اليومي ...
QNBFS Daily Technical Trader Qatar - September 28, 2023 التحليل الفني اليومي ...QNB Group
 
QNBFS Daily Market Report September 24, 2023
QNBFS Daily Market Report September 24, 2023QNBFS Daily Market Report September 24, 2023
QNBFS Daily Market Report September 24, 2023QNB Group
 
QNBFS Daily Technical Trader Qatar - September 24, 2023 التحليل الفني اليومي ...
QNBFS Daily Technical Trader Qatar - September 24, 2023 التحليل الفني اليومي ...QNBFS Daily Technical Trader Qatar - September 24, 2023 التحليل الفني اليومي ...
QNBFS Daily Technical Trader Qatar - September 24, 2023 التحليل الفني اليومي ...QNB Group
 
QNBFS Daily Technical Trader Qatar - September 19, 2023 التحليل الفني اليومي ...
QNBFS Daily Technical Trader Qatar - September 19, 2023 التحليل الفني اليومي ...QNBFS Daily Technical Trader Qatar - September 19, 2023 التحليل الفني اليومي ...
QNBFS Daily Technical Trader Qatar - September 19, 2023 التحليل الفني اليومي ...QNB Group
 
QNBFS Daily Market Report September 17, 2023
QNBFS Daily Market Report September 17, 2023QNBFS Daily Market Report September 17, 2023
QNBFS Daily Market Report September 17, 2023QNB Group
 
QNBFS Weekly Market Report September 07, 2023
QNBFS Weekly Market Report September 07, 2023QNBFS Weekly Market Report September 07, 2023
QNBFS Weekly Market Report September 07, 2023QNB Group
 
QNBFS Daily Technical Trader Qatar - September 07, 2023 التحليل الفني اليومي ...
QNBFS Daily Technical Trader Qatar - September 07, 2023 التحليل الفني اليومي ...QNBFS Daily Technical Trader Qatar - September 07, 2023 التحليل الفني اليومي ...
QNBFS Daily Technical Trader Qatar - September 07, 2023 التحليل الفني اليومي ...QNB Group
 

More from QNB Group (20)

QNBFS Daily Market Report December 24, 2023
QNBFS Daily Market Report December 24, 2023QNBFS Daily Market Report December 24, 2023
QNBFS Daily Market Report December 24, 2023
 
QNBFS Daily Market Report November 29, 2023
QNBFS Daily Market Report November 29, 2023QNBFS Daily Market Report November 29, 2023
QNBFS Daily Market Report November 29, 2023
 
QNBFS Weekly Market Report November 23, 2023
QNBFS Weekly Market Report November 23, 2023QNBFS Weekly Market Report November 23, 2023
QNBFS Weekly Market Report November 23, 2023
 
QNBFS Weekly Market Report November 16, 2023
QNBFS Weekly Market Report November 16, 2023QNBFS Weekly Market Report November 16, 2023
QNBFS Weekly Market Report November 16, 2023
 
QNBFS Daily Technical Trader Qatar - November 14, 2023 التحليل الفني اليومي ل...
QNBFS Daily Technical Trader Qatar - November 14, 2023 التحليل الفني اليومي ل...QNBFS Daily Technical Trader Qatar - November 14, 2023 التحليل الفني اليومي ل...
QNBFS Daily Technical Trader Qatar - November 14, 2023 التحليل الفني اليومي ل...
 
QNBFS Daily Technical Trader Qatar - November 06, 2023 التحليل الفني اليومي ل...
QNBFS Daily Technical Trader Qatar - November 06, 2023 التحليل الفني اليومي ل...QNBFS Daily Technical Trader Qatar - November 06, 2023 التحليل الفني اليومي ل...
QNBFS Daily Technical Trader Qatar - November 06, 2023 التحليل الفني اليومي ل...
 
QNBFS Daily Market Report October 30, 2023
QNBFS Daily Market Report October 30, 2023QNBFS Daily Market Report October 30, 2023
QNBFS Daily Market Report October 30, 2023
 
QNBFS Daily Technical Trader Qatar - October 25, 2023 التحليل الفني اليومي لب...
QNBFS Daily Technical Trader Qatar - October 25, 2023 التحليل الفني اليومي لب...QNBFS Daily Technical Trader Qatar - October 25, 2023 التحليل الفني اليومي لب...
QNBFS Daily Technical Trader Qatar - October 25, 2023 التحليل الفني اليومي لب...
 
QNBFS Daily Technical Trader Qatar - October 10, 2023 التحليل الفني اليومي لب...
QNBFS Daily Technical Trader Qatar - October 10, 2023 التحليل الفني اليومي لب...QNBFS Daily Technical Trader Qatar - October 10, 2023 التحليل الفني اليومي لب...
QNBFS Daily Technical Trader Qatar - October 10, 2023 التحليل الفني اليومي لب...
 
QNBFS Daily Technical Trader Qatar - October 11, 2023 التحليل الفني اليومي لب...
QNBFS Daily Technical Trader Qatar - October 11, 2023 التحليل الفني اليومي لب...QNBFS Daily Technical Trader Qatar - October 11, 2023 التحليل الفني اليومي لب...
QNBFS Daily Technical Trader Qatar - October 11, 2023 التحليل الفني اليومي لب...
 
QNBFS Daily Technical Trader Qatar - October 10, 2023 التحليل الفني اليومي لب...
QNBFS Daily Technical Trader Qatar - October 10, 2023 التحليل الفني اليومي لب...QNBFS Daily Technical Trader Qatar - October 10, 2023 التحليل الفني اليومي لب...
QNBFS Daily Technical Trader Qatar - October 10, 2023 التحليل الفني اليومي لب...
 
QNBFS Daily Market Report October 04, 2023
QNBFS Daily Market Report October 04, 2023QNBFS Daily Market Report October 04, 2023
QNBFS Daily Market Report October 04, 2023
 
QNBFS Daily Technical Trader Qatar - October 04, 2023 التحليل الفني اليومي لب...
QNBFS Daily Technical Trader Qatar - October 04, 2023 التحليل الفني اليومي لب...QNBFS Daily Technical Trader Qatar - October 04, 2023 التحليل الفني اليومي لب...
QNBFS Daily Technical Trader Qatar - October 04, 2023 التحليل الفني اليومي لب...
 
QNBFS Daily Technical Trader Qatar - September 28, 2023 التحليل الفني اليومي ...
QNBFS Daily Technical Trader Qatar - September 28, 2023 التحليل الفني اليومي ...QNBFS Daily Technical Trader Qatar - September 28, 2023 التحليل الفني اليومي ...
QNBFS Daily Technical Trader Qatar - September 28, 2023 التحليل الفني اليومي ...
 
QNBFS Daily Market Report September 24, 2023
QNBFS Daily Market Report September 24, 2023QNBFS Daily Market Report September 24, 2023
QNBFS Daily Market Report September 24, 2023
 
QNBFS Daily Technical Trader Qatar - September 24, 2023 التحليل الفني اليومي ...
QNBFS Daily Technical Trader Qatar - September 24, 2023 التحليل الفني اليومي ...QNBFS Daily Technical Trader Qatar - September 24, 2023 التحليل الفني اليومي ...
QNBFS Daily Technical Trader Qatar - September 24, 2023 التحليل الفني اليومي ...
 
QNBFS Daily Technical Trader Qatar - September 19, 2023 التحليل الفني اليومي ...
QNBFS Daily Technical Trader Qatar - September 19, 2023 التحليل الفني اليومي ...QNBFS Daily Technical Trader Qatar - September 19, 2023 التحليل الفني اليومي ...
QNBFS Daily Technical Trader Qatar - September 19, 2023 التحليل الفني اليومي ...
 
QNBFS Daily Market Report September 17, 2023
QNBFS Daily Market Report September 17, 2023QNBFS Daily Market Report September 17, 2023
QNBFS Daily Market Report September 17, 2023
 
QNBFS Weekly Market Report September 07, 2023
QNBFS Weekly Market Report September 07, 2023QNBFS Weekly Market Report September 07, 2023
QNBFS Weekly Market Report September 07, 2023
 
QNBFS Daily Technical Trader Qatar - September 07, 2023 التحليل الفني اليومي ...
QNBFS Daily Technical Trader Qatar - September 07, 2023 التحليل الفني اليومي ...QNBFS Daily Technical Trader Qatar - September 07, 2023 التحليل الفني اليومي ...
QNBFS Daily Technical Trader Qatar - September 07, 2023 التحليل الفني اليومي ...
 

Recently uploaded

fca-bsps-decision-letter-redacted (1).pdf
fca-bsps-decision-letter-redacted (1).pdffca-bsps-decision-letter-redacted (1).pdf
fca-bsps-decision-letter-redacted (1).pdfHenry Tapper
 
Call Girls In Yusuf Sarai Women Seeking Men 9654467111
Call Girls In Yusuf Sarai Women Seeking Men 9654467111Call Girls In Yusuf Sarai Women Seeking Men 9654467111
Call Girls In Yusuf Sarai Women Seeking Men 9654467111Sapana Sha
 
Vip B Aizawl Call Girls #9907093804 Contact Number Escorts Service Aizawl
Vip B Aizawl Call Girls #9907093804 Contact Number Escorts Service AizawlVip B Aizawl Call Girls #9907093804 Contact Number Escorts Service Aizawl
Vip B Aizawl Call Girls #9907093804 Contact Number Escorts Service Aizawlmakika9823
 
Chapter 2.ppt of macroeconomics by mankiw 9th edition
Chapter 2.ppt of macroeconomics by mankiw 9th editionChapter 2.ppt of macroeconomics by mankiw 9th edition
Chapter 2.ppt of macroeconomics by mankiw 9th editionMuhammadHusnain82237
 
SBP-Market-Operations and market managment
SBP-Market-Operations and market managmentSBP-Market-Operations and market managment
SBP-Market-Operations and market managmentfactical
 
Lundin Gold April 2024 Corporate Presentation v4.pdf
Lundin Gold April 2024 Corporate Presentation v4.pdfLundin Gold April 2024 Corporate Presentation v4.pdf
Lundin Gold April 2024 Corporate Presentation v4.pdfAdnet Communications
 
(办理学位证)加拿大萨省大学毕业证成绩单原版一比一
(办理学位证)加拿大萨省大学毕业证成绩单原版一比一(办理学位证)加拿大萨省大学毕业证成绩单原版一比一
(办理学位证)加拿大萨省大学毕业证成绩单原版一比一S SDS
 
Andheri Call Girls In 9825968104 Mumbai Hot Models
Andheri Call Girls In 9825968104 Mumbai Hot ModelsAndheri Call Girls In 9825968104 Mumbai Hot Models
Andheri Call Girls In 9825968104 Mumbai Hot Modelshematsharma006
 
House of Commons ; CDC schemes overview document
House of Commons ; CDC schemes overview documentHouse of Commons ; CDC schemes overview document
House of Commons ; CDC schemes overview documentHenry Tapper
 
VIP Call Girls Service Begumpet Hyderabad Call +91-8250192130
VIP Call Girls Service Begumpet Hyderabad Call +91-8250192130VIP Call Girls Service Begumpet Hyderabad Call +91-8250192130
VIP Call Girls Service Begumpet Hyderabad Call +91-8250192130Suhani Kapoor
 
VIP Call Girls LB Nagar ( Hyderabad ) Phone 8250192130 | ₹5k To 25k With Room...
VIP Call Girls LB Nagar ( Hyderabad ) Phone 8250192130 | ₹5k To 25k With Room...VIP Call Girls LB Nagar ( Hyderabad ) Phone 8250192130 | ₹5k To 25k With Room...
VIP Call Girls LB Nagar ( Hyderabad ) Phone 8250192130 | ₹5k To 25k With Room...Suhani Kapoor
 
Financial institutions facilitate financing, economic transactions, issue fun...
Financial institutions facilitate financing, economic transactions, issue fun...Financial institutions facilitate financing, economic transactions, issue fun...
Financial institutions facilitate financing, economic transactions, issue fun...Avanish Goel
 
AfRESFullPaper22018EmpiricalPerformanceofRealEstateInvestmentTrustsandShareho...
AfRESFullPaper22018EmpiricalPerformanceofRealEstateInvestmentTrustsandShareho...AfRESFullPaper22018EmpiricalPerformanceofRealEstateInvestmentTrustsandShareho...
AfRESFullPaper22018EmpiricalPerformanceofRealEstateInvestmentTrustsandShareho...yordanosyohannes2
 
Call Girls Service Nagpur Maya Call 7001035870 Meet With Nagpur Escorts
Call Girls Service Nagpur Maya Call 7001035870 Meet With Nagpur EscortsCall Girls Service Nagpur Maya Call 7001035870 Meet With Nagpur Escorts
Call Girls Service Nagpur Maya Call 7001035870 Meet With Nagpur Escortsranjana rawat
 
Log your LOA pain with Pension Lab's brilliant campaign
Log your LOA pain with Pension Lab's brilliant campaignLog your LOA pain with Pension Lab's brilliant campaign
Log your LOA pain with Pension Lab's brilliant campaignHenry Tapper
 
Bladex Earnings Call Presentation 1Q2024
Bladex Earnings Call Presentation 1Q2024Bladex Earnings Call Presentation 1Q2024
Bladex Earnings Call Presentation 1Q2024Bladex
 
government_intervention_in_business_ownership[1].pdf
government_intervention_in_business_ownership[1].pdfgovernment_intervention_in_business_ownership[1].pdf
government_intervention_in_business_ownership[1].pdfshaunmashale756
 
VIP High Class Call Girls Saharanpur Anushka 8250192130 Independent Escort Se...
VIP High Class Call Girls Saharanpur Anushka 8250192130 Independent Escort Se...VIP High Class Call Girls Saharanpur Anushka 8250192130 Independent Escort Se...
VIP High Class Call Girls Saharanpur Anushka 8250192130 Independent Escort Se...Suhani Kapoor
 
Attachment Of Assets......................
Attachment Of Assets......................Attachment Of Assets......................
Attachment Of Assets......................AmanBajaj36
 

Recently uploaded (20)

fca-bsps-decision-letter-redacted (1).pdf
fca-bsps-decision-letter-redacted (1).pdffca-bsps-decision-letter-redacted (1).pdf
fca-bsps-decision-letter-redacted (1).pdf
 
Call Girls In Yusuf Sarai Women Seeking Men 9654467111
Call Girls In Yusuf Sarai Women Seeking Men 9654467111Call Girls In Yusuf Sarai Women Seeking Men 9654467111
Call Girls In Yusuf Sarai Women Seeking Men 9654467111
 
Vip B Aizawl Call Girls #9907093804 Contact Number Escorts Service Aizawl
Vip B Aizawl Call Girls #9907093804 Contact Number Escorts Service AizawlVip B Aizawl Call Girls #9907093804 Contact Number Escorts Service Aizawl
Vip B Aizawl Call Girls #9907093804 Contact Number Escorts Service Aizawl
 
Chapter 2.ppt of macroeconomics by mankiw 9th edition
Chapter 2.ppt of macroeconomics by mankiw 9th editionChapter 2.ppt of macroeconomics by mankiw 9th edition
Chapter 2.ppt of macroeconomics by mankiw 9th edition
 
SBP-Market-Operations and market managment
SBP-Market-Operations and market managmentSBP-Market-Operations and market managment
SBP-Market-Operations and market managment
 
Lundin Gold April 2024 Corporate Presentation v4.pdf
Lundin Gold April 2024 Corporate Presentation v4.pdfLundin Gold April 2024 Corporate Presentation v4.pdf
Lundin Gold April 2024 Corporate Presentation v4.pdf
 
(办理学位证)加拿大萨省大学毕业证成绩单原版一比一
(办理学位证)加拿大萨省大学毕业证成绩单原版一比一(办理学位证)加拿大萨省大学毕业证成绩单原版一比一
(办理学位证)加拿大萨省大学毕业证成绩单原版一比一
 
Andheri Call Girls In 9825968104 Mumbai Hot Models
Andheri Call Girls In 9825968104 Mumbai Hot ModelsAndheri Call Girls In 9825968104 Mumbai Hot Models
Andheri Call Girls In 9825968104 Mumbai Hot Models
 
House of Commons ; CDC schemes overview document
House of Commons ; CDC schemes overview documentHouse of Commons ; CDC schemes overview document
House of Commons ; CDC schemes overview document
 
VIP Call Girls Service Begumpet Hyderabad Call +91-8250192130
VIP Call Girls Service Begumpet Hyderabad Call +91-8250192130VIP Call Girls Service Begumpet Hyderabad Call +91-8250192130
VIP Call Girls Service Begumpet Hyderabad Call +91-8250192130
 
VIP Call Girls LB Nagar ( Hyderabad ) Phone 8250192130 | ₹5k To 25k With Room...
VIP Call Girls LB Nagar ( Hyderabad ) Phone 8250192130 | ₹5k To 25k With Room...VIP Call Girls LB Nagar ( Hyderabad ) Phone 8250192130 | ₹5k To 25k With Room...
VIP Call Girls LB Nagar ( Hyderabad ) Phone 8250192130 | ₹5k To 25k With Room...
 
Financial institutions facilitate financing, economic transactions, issue fun...
Financial institutions facilitate financing, economic transactions, issue fun...Financial institutions facilitate financing, economic transactions, issue fun...
Financial institutions facilitate financing, economic transactions, issue fun...
 
AfRESFullPaper22018EmpiricalPerformanceofRealEstateInvestmentTrustsandShareho...
AfRESFullPaper22018EmpiricalPerformanceofRealEstateInvestmentTrustsandShareho...AfRESFullPaper22018EmpiricalPerformanceofRealEstateInvestmentTrustsandShareho...
AfRESFullPaper22018EmpiricalPerformanceofRealEstateInvestmentTrustsandShareho...
 
Call Girls Service Nagpur Maya Call 7001035870 Meet With Nagpur Escorts
Call Girls Service Nagpur Maya Call 7001035870 Meet With Nagpur EscortsCall Girls Service Nagpur Maya Call 7001035870 Meet With Nagpur Escorts
Call Girls Service Nagpur Maya Call 7001035870 Meet With Nagpur Escorts
 
Log your LOA pain with Pension Lab's brilliant campaign
Log your LOA pain with Pension Lab's brilliant campaignLog your LOA pain with Pension Lab's brilliant campaign
Log your LOA pain with Pension Lab's brilliant campaign
 
Commercial Bank Economic Capsule - April 2024
Commercial Bank Economic Capsule - April 2024Commercial Bank Economic Capsule - April 2024
Commercial Bank Economic Capsule - April 2024
 
Bladex Earnings Call Presentation 1Q2024
Bladex Earnings Call Presentation 1Q2024Bladex Earnings Call Presentation 1Q2024
Bladex Earnings Call Presentation 1Q2024
 
government_intervention_in_business_ownership[1].pdf
government_intervention_in_business_ownership[1].pdfgovernment_intervention_in_business_ownership[1].pdf
government_intervention_in_business_ownership[1].pdf
 
VIP High Class Call Girls Saharanpur Anushka 8250192130 Independent Escort Se...
VIP High Class Call Girls Saharanpur Anushka 8250192130 Independent Escort Se...VIP High Class Call Girls Saharanpur Anushka 8250192130 Independent Escort Se...
VIP High Class Call Girls Saharanpur Anushka 8250192130 Independent Escort Se...
 
Attachment Of Assets......................
Attachment Of Assets......................Attachment Of Assets......................
Attachment Of Assets......................
 

QSE Rises 0.8% Led by Insurance, Telecom Indices

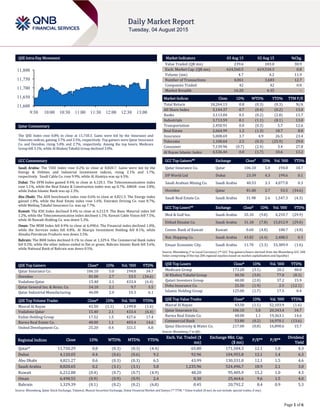
  • 1. Page 1 of 6 QSE Intra-Day Movement Qatar Commentary The QSE Index rose 0.8% to close at 11,750.3. Gains were led by the Insurance and Telecoms indices, gaining 3.7% and 2.5%, respectively. Top gainers were Qatar Insurance Co. and Ooredoo, rising 5.0% and 2.7%, respectively. Among the top losers, Medicare Group fell 3.1%, while Al Khaleej Takaful Group declined 3.0%. GCC Commentary Saudi Arabia: The TASI Index rose 0.2% to close at 8,820.7. Gains were led by the Energy & Utilities and Industrial Investment indices, rising 2.1% and 1.7%, respectively. Saudi Cable Co. rose 9.9%, while Al Alamiya was up 4.5%. Dubai: The DFM Index gained 0.4% to close at 4,120.1. The Telecommunication index rose 1.1%, while the Real Estate & Construction index was up 0.7%. AMAN rose 3.8%, while Dubai Islamic Bank was up 2.3%. Abu Dhabi: The ADX benchmark index rose 0.6% to close at 4,821.3. The Energy index gained 1.8%, while the Real Estate index rose 1.6%. Emirates Driving Co. rose 8.7%, while Methaq Takaful Insurance Co. was up 7.7%. Kuwait: The KSE Index declined 0.4% to close at 6,212.9. The Basic Material index fell 1.2%, while the Telecommunication index declined 1.1%. Kuwait Cable Vision fell 7.5%, while Al-Nawadi Holding Co. was down 5.3%. Oman: The MSM Index fell 0.9% to close at 6,498.6. The Financial index declined 1.0%, while the Services index fell 0.8%. Al Sharqia Investment Holding fell 8.1%, while Almaha Petroleum Products was down 3.5%. Bahrain: The BHB Index declined 0.1% to close at 1,329.4. The Commercial Bank index fell 0.2%, while the other indices ended in flat or green. Bahrain Islamic Bank fell 3.6%, while National Bank of Bahrain was down 0.5%. QSE Top Gainers Close* 1D% Vol. ‘000 YTD% Qatar Insurance Co. 106.10 5.0 194.8 34.7 Ooredoo 81.00 2.7 53.5 (34.6) Vodafone Qatar 15.40 2.1 433.4 (6.4) Qatar General Ins. & Reins. Co. 54.10 2.1 9.7 5.5 Qatar Industrial Manufacturing 46.00 2.0 10.3 6.1 QSE Top Volume Trades Close* 1D% Vol. ‘000 YTD% Masraf Al Rayan 43.50 (1.1) 1,199.8 (1.6) Vodafone Qatar 15.40 2.1 433.4 (6.4) Ezdan Holding Group 17.52 1.5 427.6 17.4 Barwa Real Estate Co. 48.00 1.1 403.4 14.6 United Development Co. 25.20 0.4 321.5 6.8 Market Indicators 03 Aug 15 02 Aug 15 %Chg. Value Traded (QR mn) 239.6 183.0 30.9 Exch. Market Cap. (QR mn) 624,560.5 619,534.3 0.8 Volume (mn) 4.7 4.2 11.9 Number of Transactions 4,061 3,603 12.7 Companies Traded 42 42 0.0 Market Breadth 16:20 4:35 – Market Indices Close 1D% WTD% YTD% TTM P/E Total Return 18,264.13 0.8 (0.3) (0.3) N/A All Share Index 3,144.37 0.7 (0.4) (0.2) 13.0 Banks 3,113.84 0.5 (0.2) (2.8) 13.7 Industrials 3,713.59 0.1 (1.1) (8.1) 13.0 Transportation 2,450.91 0.0 (0.3) 5.7 12.6 Real Estate 2,664.99 1.2 (1.3) 18.7 8.8 Insurance 5,008.69 3.7 4.9 26.5 23.4 Telecoms 1,100.64 2.5 (0.3) (25.9) 29.0 Consumer 7,139.96 (0.7) (2.4) 3.4 27.8 Al Rayan Islamic Index 4,536.44 0.0 (1.7) 10.6 13.2 GCC Top Gainers## Exchange Close# 1D% Vol. ‘000 YTD% Qatar Insurance Co. Qatar 106.10 5.0 194.8 34.7 DP World Ltd Dubai 23.39 4.3 199.6 0.1 Saudi Arabian Mining Co. Saudi Arabia 40.53 3.3 4,077.8 0.3 Ooredoo Qatar 81.00 2.7 53.5 (34.6) Saudi Real Estate Co. Saudi Arabia 31.98 2.6 1,547.3 (4.3) GCC Top Losers## Exchange Close# 1D% Vol. ‘000 YTD% Med & Gulf Ins. Saudi Arabia 35.10 (9.8) 4,259.7 (29.9) Etihad Etisalat Co. Saudi Arabia 31.18 (7.8) 15,012.9 (29.0) Comm. Bank of Kuwait Kuwait 0.60 (4.8) 180.7 (4.8) Nat. Shipping Co. Saudi Arabia 43.82 (4.4) 2,488.5 0.3 Emaar Economic City. Saudi Arabia 11.70 (3.3) 33,389.9 (1.6) Source: Bloomberg (# in Local Currency) (## GCC Top gainers/losers derived from the Bloomberg GCC 200 Index comprising of the top 200 regional equities based on market capitalization and liquidity) QSE Top Losers Close* 1D% Vol. ‘000 YTD% Medicare Group 173.20 (3.1) 20.2 48.0 Al Khaleej Takaful Group 40.50 (3.0) 77.0 (8.3) Qatari Investors Group 48.00 (2.0) 37.2 15.9 Doha Insurance Co. 25.50 (1.9) 2.5 (12.1) Islamic Holding Group 125.00 (1.7) 17.5 0.4 QSE Top Value Trades Close* 1D% Val. ‘000 YTD% Masraf Al Rayan 43.50 (1.1) 52,103.9 (1.6) Qatar Insurance Co. 106.10 5.0 20,343.4 34.7 Barwa Real Estate Co. 48.00 1.1 19,363.1 14.6 Commercial Bank 53.80 (0.2) 16,970.1 (13.6) Qatar Electricity & Water Co. 217.00 (0.8) 16,890.6 15.7 Source: Bloomberg (* in QR) Regional Indices Close 1D% WTD% MTD% YTD% Exch. Val. Traded ($ mn) Exchange Mkt. Cap. ($ mn) P/E** P/B** Dividend Yield Qatar* 11,750.29 0.8 (0.3) (0.3) (4.4) 65.80 171,504.3 12.1 1.8 4.3 Dubai 4,120.05 0.4 (0.6) (0.6) 9.2 92.96 104,955.8 12.1 1.4 6.3 Abu Dhabi 4,821.27 0.6 (0.3) (0.3) 6.5 43.99 130,331.0 12.1 1.5 4.6 Saudi Arabia 8,820.65 0.2 (3.1) (3.1) 5.8 1,235.96 524,496.7 18.9 2.1 3.0 Kuwait 6,212.88 (0.4) (0.7) (0.7) (4.9) 48.20 95,405.9 15.2 1.0 4.3 Oman 6,498.55 (0.9) (0.9) (0.9) 2.4 8.30 25,464.6 9.6 1.5 4.0 Bahrain 1,329.39 (0.1) (0.2) (0.2) (6.8) 0.45 20,792.2 8.4 0.9 5.3 Source: Bloomberg, Qatar Stock Exchange, Tadawul, Muscat Securities Exchange, Dubai Financial Market and Zawya (** TTM; * Value traded ($ mn) do not include special trades, if any) 11,600 11,650 11,700 11,750 11,800 9:30 10:00 10:30 11:00 11:30 12:00 12:30 13:00
  • 2. Page 2 of 6 Qatar Market Commentary  The QSE Index rose 0.8% to close at 11,750.3. The Insurance and Telecoms indices led the gains. The index rose on the back of buying support from non-Qatari shareholders despite selling pressure from Qatari and GCC shareholders.  Qatar Insurance Co. and Ooredoo were the top gainers, rising 5.0% and 2.7%, respectively. Among the top losers, Medicare Group fell 3.1%, while Al Khaleej Takaful Group declined 3.0%.  Volume of shares traded on Monday rose by 11.9% to 4.7mn from 4.2mn on Sunday. However, as compared to the 30-day moving average of 4.8mn, volume for the day was 1.3% lower. Masraf Al Rayan and Vodafone Qatar were the most active stocks, contributing 25.5% and 9.2% to the total volume, respectively. Source: Qatar Stock Exchange (* as a % of traded value) Earnings and Global Economic Data Earnings Releases Company Market Currency Revenue (mn) 2Q2015 % Change YoY Operating Profit (mn) 2Q2015 % Change YoY Net Profit (mn) 2Q2015 % Change YoY Sharjah Cement and Industrial Development Co. (SCIDC) Abu Dhabi AED 161.9 -21.7% – – 21.4 -3.7% Viva Kuwait Kuwait KD 67.9 16.8% – – 11.2 7.8% Dhofar Cattle Feed* Oman OMR 21.3 42.2% – – 1.5 NA Source: Company data, DFM, ADX, MSM (*1H2015 results) Global Economic Data Date Market Source Indicator Period Actual Consensus Previous 08/03 US Bureau of Eco. Analysis Personal Income June 0.40% 0.30% 0.40% 08/03 US Bureau of Eco.Analysis Personal Spending June 0.20% 0.20% 0.70% 08/03 US Bureau of Eco. Analysis PCE Deflator MoM June 0.20% 0.20% 0.30% 08/03 US Bureau of Eco. Analysis PCE Deflator YoY June 0.30% 0.20% 0.20% 08/03 US US Census Bureau Construction Spending MoM June 0.10% 0.60% 1.80% 08/03 US Inst. for Supply Mgmt. ISM Manufacturing July 52.7 53.5 0.019 08/03 UK Markit Markit UK PMI Manufacturing SA July 51.9 51.5 0.002 08/03 Spain Markit Markit Spain Manufacturing PMI July 53.6 54.3 -0.01 08/03 Italy Markit Markit/ADACI Italy Manuf. PMI July 55.3 53.9 98.71 08/03 Italy Italian Treasury Budget Balance July -2.2B – 12.3B Source: Bloomberg (s.a. = seasonally adjusted; n.s.a. = non-seasonally adjusted; w.d.a. = working day adjusted) Overall Activity Buy %* Sell %* Net (QR) Qatari 51.59% 58.11% (15,613,501.43) GCC 6.10% 6.28% (433,624.63) Non-Qatari 42.30% 35.60% 16,047,126.06
  • 3. Page 3 of 6 News Qatar  IQCD net income surges 54.9% QoQ in 2Q2015, beat our estimates – Significant uptick in steel revenue and petrochemical profitability drives earnings upside. IQCD posted QR1.47bn in net income for 2Q2015, which beat our estimate of QR1.21bn by 21% and Bloomberg mean estimate of QR1.13bn by 31%. While we were surprised by the 20% QoQ uptick in steel revenue, steel margins came in below estimates at 20% (net margin) vs. our model of 25%. Petrochemical net margin expanded to 52% from 34% in 1Q2015 with segment net income jumping by more than 130% QoQ benefiting from improved product prices and higher volume growth. The fertilizer segment top line came in line with our estimate. Further, in its disclosure, IQCD mentioned that Qatar Steel has opted to sell its 50% stake in the JV Qatar Steel International to its partner without disclosing the deal price. With Brent prices taking another swoon and going below $50/b, we believe the stock will continue to face negative sentiment despite 2Q2015’s upside. We rate IQCD a Market Perform. We remain of the view IQCD holds long-term potential. However, any meaningful recovery in the stock will likely come only when optimism regarding oil prices resurfaces. Highlights: 1) IQCD net income surges 55% QoQ in 2Q2015. The QoQ profit growth was on the back of a strong increase in revenue and JV income. IQCD also reported a strong YoY sales growth of 17.1 % in 1H2015 as most of its production facilities were on extensive planned and warranty maintenance shutdown during 1H2014; 2) Better volumes drive steel revenue upside but margins still somewhat depressed. The company’s steel revenue increased 20% QoQ (down 13% YoY) to QR1.58bn with segment net income gaining 52% QoQ (down 13%) to QR322mn. Net margins advanced to 20% from 16% in 1Q2015 and was flattish versus 2Q2014. Steel revenue beat our estimate by a significant 24% but net income was in line with our model given our assumption of higher margins; 3) Petrochemicals – higher price realizations (as expected) and some volume growth drive significant margin expansion. Petrochemical net margin expanded to 52% from 34% in 1Q2015 (43% in 2Q2014) with segment net income jumping by more than 130% to QR873mn benefiting from improved product prices and higher volume growth. Petrochemical revenue was up 50% QoQ (+14% YoY) to QR1.68bn. Reported revenue was 6% ahead of our model but net income beat our estimate by 39%; 4) Fertilizers faced price declines as expected with revenue/net falling QoQ. This segment recorded revenue of QR1.16bn (-14% QoQ, +1% YoY) and net income of QR262mn (-21% QoQ, +14% YoY). Reported revenue was in-line but profits were a bit softer than our model. Catalysts: The eventual recovery in oil prices will be a major positive. Also, QP has stated its intention to conduct feasibility studies in order to take advantage of the ethane feedstock available following the decision not to proceed with the proposed Al-Karaana Petrochemicals project. IQCD (through QAPCO) could end up benefiting from any resulting petrochemical ventures but not before 2018 or so. Recommendation and valuation: We maintain our Market Perform with a price of QR153.00. IQCD is trading at 2016 EV/EBITDA multiple of 12.8x. Risks: Declining oil prices remain a substantial risk to regional equity prices and have a direct detrimental impact on IQCD’s operations. (QNBFS Research, Company Press Release, QSE)  MRDS bottom-line rises 27.6% QoQ in 2Q2015 – Mazaya Qatar Real Estate Development Co. (MRDS) registered a jump of 27.6% QoQ (+2.3% YoY) in its 2Q2015 earnings to QR33.2mn, despite its top- line slipping 4.4% QoQ (down 26.6% YoY) to QR64.7mn. (QSE, QNBFS Research)  QTA: Qatar gets 1,400 more rooms for travelers – According to Qatar Tourism Authority’s (QTA) mid-year tourism performance report for 2015, around 11 new hotels and hotel apartments have opened in Qatar since the start of 2015 offering about 1,400 additional rooms to accommodate the growing number of visitors and tourists to the country. The report noted that the new properties are a mix of luxury, standard hotel and hotel apartment segments. These include five 5-star, one 4-star and five 3-star hotels. (Gulf-Times.com)  Qatari Diar venture agrees to sell $857mn London offices – A venture between Qatari Diar Real Estate Investment Co and Canary Wharf Group agreed to sell two office buildings in London’s South Bank district to Almacantar for over $857mn. Almacantar, led by the former Land Securities executive Mike Hussey, is buying the buildings near the Waterloo railway station before their completion in 2018. One of them will be leased by a unit of Royal Dutch Shell and occupiers will be sought for the other. (Gulf- Times.com)  Public urged to bring illegally partitioned villas to authority’s notice – The Ministry of Municipality and Urban Planning has urged the public to bring to its notice villas and apartments that have been partitioned illegally. The Ministry said that it is the duty of people to report cases involving illegally partitioned homes as they pose grave threats to public safety and adversely impact infrastructure and public services. The Ministry said tampered electrical wirings and water pipes in illegally partitioned homes pose a grave threat to the safety of people. Municipal inspectors have been asked to watch buildings from outside and based on air-conditioners and cars parked outside and other such features, they can assess whether there is a violation. (Peninsula Qatar) International  ISM: US manufacturing cools in July – Manufacturing in the US cooled in July from the highest level in five months, a sign of fitful progress in the industry. The Institute for Supply Management’s (ISM) national factory activity index fell to 52.7 from a June reading of 53.5 that was the fastest since the start of 2015. Readings greater than 50 indicate expansion. The ISM group’s new orders gauge climbed to 56.5 from 56 in June and a measure of production rose to 56 from 54. The measure of export orders fell to 48 from 49.5. A pickup in the ISM’s orders index and increased production indicate steady consumer spending is underpinning activity at American factories. The employment index declined to 52.7 from 55.5. Meanwhile, the Commerce Department said consumer spending, which accounts for over two-thirds of the US economic activity, rose by 0.2% in June after a 0.7% increase in May. Consumer spending in June was restrained by a decline in auto purchases. (Bloomberg, Reuters)  Eurozone factory activity steady in July despite Greek crisis – The Eurozone factory activity grew faster than estimates in July, easing only slightly from June’s 14-month record pace as rising prices kept new orders in check. Markit’s final Eurozone Manufacturing Purchasing Managers’ Index stood at 52.4, comfortably above the 50 level that separates growth from contraction. That beat a preliminary estimate of 52.2 but was just shy of 52.5 reading of June. The new order growth eased in July - the subindex dipped to 52.2 from 52.7 - as factories increased their prices for a second month, albeit at a weaker rate than in June. However, an index measuring output, which is seen as a good guide to growth held steady at June’s 53.6, surpassing the preliminary reading of 53.4. (Reuters)  S&P: Global capital spending to fall in 2015 for third straight year – According to a global capex survey released by Standard & Poor’s (S&P), the world’s top-spending corporations are set to cut back on investment in 2015 for the third year in a row, as a commodities sell-off hits confidence. The capital expenditure (or
  • 4. Page 4 of 6 capex) by non-financial companies is set to fall by 1% in 2015 and by 4% in 2016. The report said the decline in 2015 would be mainly due to the energy and materials industry, which is set to cut spending by 14% as it fights a loss of confidence in commodities amid fears over demand from China. Excluding energy and materials, global capital spending is estimated to rise by 8%. The report said the next hurdle for company spending will be a transition to higher interest rates, especially in the US. (Reuters)  Britain starts RBS sale with £2bn stake sale – Britain started the sale of a £2bn stake in the Royal Bank of Scotland (RBS) on Monday, beginning the disposal of its holding in the bank seven years after a multi-billion pound bailout at the height of the financial crisis. UK Financial Investments, the body that holds the government’s stake in RBS, said it would sell around 600mn shares, representing 5.2% of the bank, in a quick-fire sale to institutional investors after the market closed. Britain owns 78% of RBS after rescuing it with £45.8bn pounds of taxpayer cash at the peak of the credit crunch in 2008. Its stake will reduce to 73.2%. A bookrunner on the deal said shares were sold at a price of 330 pence each. The government will make a loss on the first RBS sale since the shares were bought at an average price of 502 pence each. The disposal marks a milestone in Britain’s recovery from the 2007-09 financial crisis and its drive to return RBS and Lloyds Banking Group to the private sector. (Reuters)  Chinese factory activity contraction exceeds earlier estimate in July – Economic headwinds facing Chinese manufacturers intensified in July, with conditions deteriorating to their weakest level in two years. The factory activity shrank more than initially estimated as final Caixin/Markit China Manufacturing PMI came in at 47.8 in July versus 49.4 in June. Similar business activity surveys for Taiwan, South Korea and Indonesia - all heavily reliant on Chinese demand - reflected varying degrees of weakness that is clouding hopes for a convincing global recovery in 2H2015. Providing a bit of relief, the manufacturing activity in Japan and India both picked up in July thanks to new orders, though analysts questioned if the momentum can be sustained. (Reuters)  HSBC 1H2015 profit rises 10% led by Asian earnings – HSBC Holdings’ 1H2015 profit beat analysts’ estimates, buoyed by income from Asia and securities trading, and the bank agreed to sell its Brazilian operations for around $1bn more than expected. The pretax profit rose by 10% YoY to $13.6bn, driven by a 19% jump in Asian earnings and surpassing the average estimate of $12.5bn. While HSBC’s 1H2015 revenue rose to $32.9bn from $31.2bn, net operating income in Asia jumped 16% to $14.1bn. The results give a boost to Chief Executive Officer Stuart Gulliver’s strategy to shift investment to Asia, the bank’s best-performing region, while cutting unprofitable divisions. Meanwhile, Banco Bradesco SA agreed to buy HSBC’s Brazilian unit for $5.2bn in cash. (Bloomberg) Regional  Saudi Arabia, UAE attract over 75% of MENA investment activity by value – The MENA Private Equity Association, in its ninth “MENA Private Equity & Venture Capital” annual report, said that the UAE and Saudi Arabia attracted over 75% of the Middle East and North Africa (MENA) region investment activity by value in 2014, reflecting their scale and stability as well as increased availability of larger target assets. The report said that the two countries accounted for a lower proportion of transaction volumes at 31%. Total number of known investment volumes increased to 72 in 2014 as compared to 66 in 2013. Values of disclosed investments also increased 118% to $1.5bn. Total funds raised in 2014 had reached the highest level since 2008 at $1,229mn as compared to $744mn in 2013. In 2014, the greatest investment values were in oil & gas and demographic-driven sectors such as education, services and food & beverage. (GulfBase.com)  SPA: Saudi Arabia approves contracts worth SR1.06bn – The Saudi Press Agency (SPA) has reported that Saudi Arabia has approved contracts worth SR1.06bn for 168 municipal projects in 14 governorates. The projects include storm water drainage systems, walkways, environmental health projects, seafront development & construction of municipal buildings and public facilities as well as several consultancy contracts. A spokesman for the Ministry of Municipal and Rural Affairs said that projects worth SR157.73mn, including public parks, walkways, cultural centers and water networks, will be carried out in the Riyadh province, while SR174.55mn contracts will be implemented in Jeddah. Among the key projects in Jeddah are the development of the South Corniche and a study on improving the city's performance. Similarly, projects worth SR45.5mn have been approved for Madinah. They include irrigation lines and a livestock market as well as the maintenance of Al Baqee Graveyard. (GulfBase.com)  Saudi Arabia to raise September oil price, wary of losing market share – Saudi Arabia is expected to raise prices for crude it sells to Asia in September 2015 due to a stronger Dubai benchmark, traders and analysts said, adding that the top oil exporter will be wary of a hike so big it would threaten its market share. The OPEC’s efforts to discourage growth from rival supply sources are bearing fruit as the group continued to pump at record levels in July 2015. Still, raising prices when Asian refiners are cutting runs because of weak margins could hurt Saudi oil demand. (Reuters)  JLL: Riyadh real estate market see limited growth in 2Q2015 – According to Jones Lang LaSalle’s (JLL) “Riyadh Real Estate Market Overview” report for 2Q2015, most sectors of Riyadh real estate market see limited growth in 2Q2015. National Director and Country Head of JLL KSA, Mr. Jamil Ghaznawi said that there has been relatively little change in the real estate market in Riyadh in 2Q2015 although recent changes to mortgage regulations have caused downward pressure in the residential sales market. The office market has seen little change in occupancies and rentals over the past quarter but rents are expected to soften going forward as a result of major new completions in the long delayed KAFD and ITCC projects during 2016. Retail remains one of the best performing sectors in Riyadh, as super-regional and regional mall performance continues to improve and retail spending remains strong. (GulfBase.com)  SFC appoints CEO – Saudi Fransi Capital (SFC) has appointed Mr. Waleed Fatani as its Chief Executive Officer (CEO). Fatani has a wide expertise of 21 years in the financing and banking fields. He acted as a treasurer as well as capital market and investment advisor at Abdul Latif Jameel Co. In addition, he served as the manager of Deutsche Bank – Saudi Arabia, as well as head of Banque Saudi Fransi treasury and member of the bank’s senior management. (GulfBase.com)  StanChart: UAE energy subsidy reforms to boost public finances – According to Standard Chartered Bank (StanChart) MENA economist Carla Slim, the recent fuel and power subsidy reforms in the UAE will have a sustainable impact on the government’s finances and could be visible in fiscal balances. Slim said that StanChart revised higher its 2016 fiscal surplus forecast to 2.5% of GDP, from 2.2% previously, to capture the savings on current expenditure in 2016. Energy subsidies have been a drag on financial resources that could be used more productively elsewhere such as education and infrastructure. In addition, they distort consumer incentives and they are not environmentally sustainable. (GulfBase.com)  Drydocks World creditors select Moelis as adviser – According to sources, creditors of Drydocks World, the Dubai government-
  • 5. Page 5 of 6 owned company seeking to revise part of a $2.3bn debt restructuring deal which it signed in 2012, have chosen Moelis & Co as their adviser. The selection of the New York-based advisory company should open the way to Drydocks offering a proposal to creditors, a move expected to happen later in 3Q2015, with a view to closing a deal as early as the end of 4Q2015. (Reuters)  ADIB: Abu Dhabi housing rents gain 3% in 2Q2015 – According to ADIB / MPM Real Estate report, Abu Dhabi residential rents rose on average by 3% during 2Q2015, and are expected to rise further in 2015 as limited new supply enters the UAE capital. 2Q2015 witnessed only 1,647 units entering the market, taking 2015 addition to 2,397 units with an additional 4,200 units expected to be completed by 2015-end. The 2015 supply represents a mere 2.9% increase in total housing stock in the capital and is the lowest level of increase for five years. The average annual growth has been around 5%. (GulfBase.com)  DCCI registers 8,830 new companies in 1H2015 – The Dubai Chamber of Commerce & Industry (DCCI) has registered a substantial growth in its membership base, which the non-profit business facilitator accredits to Dubai's rising profile as a sound business destination and its attractiveness to global investors. A total of 8,830 new companies joined DCCI in 1H2015, which can be attributed to a record number of 335 international delegation visits to the Chamber. This brought the total number of members to over 177,000. (Zawya, Bloomberg)  Agility: Dubai logistics infrastructure key to unlocking Africa potential – According to Sylvain Kluba, Chief Operating Officer of Middle East and Africa at Agility, Dubai's logistics infrastructure is providing huge opportunities for multinationals to expand their business in Africa. Kluba said that African businesses are also looking to Dubai to reach potential customers within the European and Asian markets because of the Emirate's air, land and sea connections. He said that Dubai offers unprecedented opportunities to capitalize on the strength of its favorable geographic location. He added that the turnaround time at Jebel Ali Port is among the quickest in the world. The Jebel Ali Free Zone's proximity to the main container terminal, airports and customs authorities provides an ideal location to operate a regional distribution center. (GulfBase.com)  NBAD receives SCA nod for securities lending & borrowing – The Securities & Commodities Authority (SCA) has granted approval to the National Bank of Abu Dhabi (NBAD) to engage in securities lending and borrowing activities, as part of its sustained efforts to develop local capital markets and meet the needs of investors and all strategic partners. NBAD is the first to receive this crucial approval to undertake such activities within the UAE capital markets. According to SCA, the approval will bolster the securities industry in tandem with the growth and development experienced in the region in general, and the local capital markets in particular. (GulfBase.com)  Oman boosts oil production to record high in June 2015 – Oman has ramped up its oil production to a record high in June 2015, adding to a global supply glut that has hit oil prices, as the Gulf Arab country compensates for the drop in its oil revenue. June 2015 production reached 992,700 barrels per day (bpd) of crude oil and light oil condensate, the highest ever according to official records going back to 2002. Oman produced an average of 975,000 bpd in May 2015. The sultanate is under pressure to pump more oil to make up for the drop in the price. It hopes to boost its crude oil production by 5% to 1mn bpd in 2015. (Zawya)  NCSI: Oman budget deficit reaches whopping OMR1,501.1mn – According to the National Centre for Statistics and Information (NCSI), Oman’s budget deficit for January to May 2015 surged ahead to OMR1,501.1mn, against a surplus of OMR232.9mn for January to May 2014, mainly due to a plunge in oil prices. This is against a government target of OMR2.5bn deficit for the whole of 2015. The government’s total revenue dipped by 36.2% to OMR3,858.1mn for January to May 2015, as compared to OMR6,044.1mn during January to May 2014, mainly on account of a drastic fall in oil revenue. Net oil revenue plunged by 46.3% to OMR2,325.9mn from OMR4,335.1mn. Average price of Oman Crude dipped by 43.7% to $59.3 per barrel in 1H2015 from $105.38 a barrel in 1H2014. However, crude oil production was up by 2.9% at 175.67mn barrels in 1H2015. (GulfBase.com)  Al Hassan Engineering unit receives LOI from HECC Korea – Al Hassan Engineering Co. Abu Dhabi, 49% owned by Al Hassan Engineering Company, has received a letter of intent (LOI) from Hyundai Engineering & Construction Company (HECC) Korea for $9mn instrumentation works at SARB package 4. The duration of the project is 22 months from August 2015. (MSM)  GFH's name changed to 'GFH Financial Group BSC' – Bahrain Bourse has announced that in line with Gulf Finance House B.S.C. request and with its extraordinary general meeting approval obtained on April 12, 2015 and completion of the relevant authorities formalities, Gulf Finance House B.S.C. commercial name will be changed to GFH Financial Group B.S.C. effective from August 4, 2015. (Bahrain Bourse)
  • 6. Contacts Saugata Sarkar Sahbi Kasraoui QNB Financial Services SPC Head of Research Head of HNI Contact Center: (+974) 4476 6666 Tel: (+974) 4476 6534 Tel: (+974) 4476 6544 PO Box 24025 saugata.sarkar@qnbfs.com.qa sahbi.alkasraoui@qnbfs.com.qa Doha, Qatar Disclaimer and Copyright Notice: This publication has been prepared by QNB Financial Services SPC (“QNBFS”) a wholly-owned subsidiary of QNB SAQ (“QNB”). QNBFS is regulated by the Qatar Financial Markets Authority and the Qatar Exchange QNB SAQ is regulated by the Qatar Central Bank. This publication expresses the views and opinions of QNBFS at a given time only. It is not an offer, promotion or recommendation to buy or sell securities or other investments, nor is it intended to constitute legal, tax, accounting, or financial advice. QNBFS accepts no liability whatsoever for any direct or indirect losses arising from use of this report. Any investment decision should depend on the individual circumstances of the investor and be based on specifically engaged investment advice. We therefore strongly advise potential investors to seek independent professional advice before making any investment decision. Although the information in this report has been obtained from sources that QNBFS believes to be reliable, we have not independently verified such information and it may not be accurate or complete. QNBFS does not make any representations or warranties as to the accuracy and completeness of the information it may contain, and declines any liability in that respect. For reports dealing with Technical Analysis, expressed opinions and/or recommendations may be different or contrary to the opinions/recommendations of QNBFS Fundamental Research as a result of depending solely on the historical technical data (price and volume). QNBFS reserves the right to amend the views and opinions expressed in this publication at any time. It may also express viewpoints or make investment decisions that differ significantly from, or even contradict, the views and opinions included in this report. This report may not be reproduced in whole or in part without permission from QNBFS COPYRIGHT: No part of this document may be reproduced without the explicit written permission of QNBFS. Page 6 of 6 Rebased Performance Daily Index Performance Source: Bloomberg Source: Bloomberg Source: Bloomberg Source: Bloomberg (*$ adjusted returns) 80.0 100.0 120.0 140.0 160.0 180.0 Jul-11 Jul-12 Jul-13 Jul-14 Jul-15 QSE Index S&P Pan Arab S&P GCC 0.2% 0.8% (0.4%) (0.1%) (0.9%) 0.6% 0.4% (1.0%) (0.5%) 0.0% 0.5% 1.0% SaudiArabia Qatar Kuwait Bahrain Oman AbuDhabi Dubai Asset/Currency Performance Close ($) 1D% WTD% YTD% Global Indices Performance Close 1D%* WTD%* YTD%* Gold/Ounce 1,086.80 (0.8) (0.8) (8.3) MSCI World Index 1,761.18 (0.3) (0.3) 3.0 Silver/Ounce 14.52 (1.8) (1.8) (7.5) DJ Industrial 17,598.20 (0.5) (0.5) (1.3) Crude Oil (Brent)/Barrel (FM Future) 49.52 (5.2) (5.2) (13.6) S&P 500 2,098.04 (0.3) (0.3) 1.9 Crude Oil (WTI)/Barrel (FM Future) 45.17 (4.1) (4.1) (15.2) NASDAQ 100 5,115.38 (0.3) (0.3) 8.0 Natural Gas (Henry Hub)/MMBtu 2.75 (0.6) (0.6) (8.1) STOXX 600 399.44 0.4 0.4 5.6 LPG Propane (Arab Gulf)/Ton 36.50 (3.3) (3.3) (25.5) DAX 11,443.72 0.8 0.8 5.2 LPG Butane (Arab Gulf)/Ton 48.00 (5.0) (5.0) (23.5) FTSE 100 6,688.62 (0.3) (0.3) 1.9 Euro 1.10 (0.3) (0.3) (9.5) CAC 40 5,120.52 0.4 0.4 8.6 Yen 124.03 0.1 0.1 3.5 Nikkei 20,548.11 (0.1) (0.1) 13.6 GBP 1.56 (0.2) (0.2) 0.1 MSCI EM 890.85 (1.2) (1.2) (6.8) CHF 1.03 (0.3) (0.3) 2.6 SHANGHAI SE Composite 3,622.91 (1.0) (1.0) 12.1 AUD 0.73 (0.3) (0.3) (10.9) HANG SENG 24,411.42 (0.9) (0.9) 3.4 USD Index 97.49 0.2 0.2 8.0 BSE SENSEX 28,187.06 0.1 0.1 1.2 RUB 63.55 3.0 3.0 4.6 Bovespa 50,138.05 (2.4) (2.4) (23.1) BRL 0.29 (0.9) (0.9) (23.2) RTS 834.89 (2.8) (2.8) 5.6 140.5 121.6 116.8