78-80 % energy of Urea process depends upon ammonia process and rest on power & steam. If the energy of ammonia plants is improved then the urea plant energy automatically improves. The specific consumption of urea stoichiometrically is 0.566 but due to losses it generally found 0.569-0.574 depends upon loses of urea/ammonia in the process etc. steam consumption if you are using 40 ata steam turbine then you will have to change into 100 ata steam turbine. The energy will be improved about 0.097 G.Cal/ton of urea. In this quiz how to improve energy in urea plants. Indian urea manufacturers are on a par with the best of the world in terms of low energy consumption and greenhouse gas (GHG) emissions, Besides becoming a global concern for pollution of groundwater and surface water bodies, the production and use of urea has also significantly contributed to GHG emissions. “Energy conserved is energy produced “Energy conserved is energy produced “
Question Answer on Energy Conservation Vol 2 by Prem Baboo.pdf
1. www.researchgate.net
22th
Aug,. 2022
DOI: 10.13140/RG.2.2.14959.10403 Research Gate is an academic social networking site
1
This is an open access article, Research Gate is a European commercial social networking site for scientists and researchers
Question Answer on Energy Conservation
(Vol-2)
By
Prem Baboo
Retired from National fertilizers Ltd., India
& Dangote fertilizers Ltd., Nigeria
Abstract
78-80 % energy of Urea process depends upon
ammonia process and rest on power & steam. If
the energy of ammonia plants is improved then
the urea plant energy automatically improves.
The specific consumption of urea
stoichiometrically is 0.566 but due to losses it
generally found 0.569-0.574 depends upon loses
of urea/ammonia in the process etc. steam
consumption if you are using 40 ata steam
turbine then you will have to change into 100 ata
steam turbine. The energy will be improved
about 0.097 G.Cal/ton of urea. In this quiz how
to improve energy in urea plants. Indian urea
manufacturers are on a par with the best of the
world in terms of low energy consumption and
greenhouse gas (GHG) emissions,
Besides becoming a global concern for pollution
of groundwater and surface water bodies, the
production and use of urea has also significantly
contributed to GHG emissions. “Energy
conserved is energy produced “Energy
conserved is energy produced “
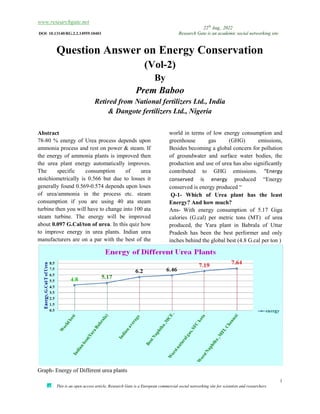
Q-1- Which of Urea plant has the least
Energy? And how much?
Ans- With energy consumption of 5.17 Giga
calories (G.cal) per metric tons (MT) of urea
produced, the Yara plant in Babrala of Uttar
Pradesh has been the best performer and only
inches behind the global best (4.8 G.cal per ton )
Graph- Energy of Different urea plants
2. www.researchgate.net
22th
Aug,. 2022
DOI: 10.13140/RG.2.2.14959.10403 Research Gate is an academic social networking site
2
This is an open access article, Research Gate is a European commercial social networking site for scientists and researchers
Graph- Indian Urea Plant energy trends
Q-2-How much CO2 emission from different
countries?
Ans.- Urea contributes to climate change with
the release of nitrous oxide that has a GHG
potential 300 times that of carbon dioxide
(CO2).In ammonia and urea production, CO2
emissions take place from the use of
hydrocarbons as fuel and feedstock, as well as
from captive power plants and purchased
electricity.
According to the study, the net emissions of CO2
in Indian plants were 0.7 CO2/MT of urea
produced.
This compares favorably with an average of 0.9
MT CO2/ MT of urea produced in the European
Union (when it had 27 member countries), 0.96
MT CO2/MT of urea produced in Africa, one
MT CO2/MT of urea produced in the United
States, 1.1 MT CO2/MT of urea produced in
Russia, 1.2 MT CO2/ MT of urea produced in
Chinese gas-based plants and 2.3 MT CO2/MT
of urea produced in Chinese coal-based plants.
Graph- CO2 Emission
3. www.researchgate.net
22th
Aug,. 2022
DOI: 10.13140/RG.2.2.14959.10403 Research Gate is an academic social networking site
3
This is an open access article, Research Gate is a European commercial social networking site for scientists and researchers
Q-3-How to calculate specific Consumption?
And what is practical specific consumption?
Ans. According to urea equation -
2NH3+CO2→NH2CONH2+ H2O
For ton urea stoichiometrically required
Ammonia required -34/60=0.566 MT
And CO2=44/60=0.733 MT
But practically these figures are more than
stoichiometrically. Then how to decide specific
consumption, there two method
1. By Ammonia & CO2 & urea Losses
calculate
2. Direct Bagging for at least 4 hrs.
As per Ammonia CO2 losses, we calculate
ammonia losses as per following table-and add
0.566+ losses, this will may be 0.569 or 0.572
etc
2nd
method for direct loading this is the absolute
method for determine Specific consumption of
CO2, Ammonia, water & steam etc. All the
integrator of above tabulate for four hours and
you can find out specific consumption of
Ammonia, CO2, water & steam.
Graph- Specific Consumption
Specific consumption of ammonia is an indicator
for efficient use of ammonia. Specific
consumption of ammonia is also determinant in
energy efficiency of urea plants. The Urea plant
energy calculated by following 3 parameters
1. Ammonia Energy
2. Steam Energy, &
3. Power Energy
The Ammonia energy Calculated by specific
consumption
Ammonia energy=Specific consumption X
Ammonia plant energy, if specific consumption
is higher than Urea energy will be more and
indicated losses is more.
.
5. www.researchgate.net
22th
Aug,. 2022
DOI: 10.13140/RG.2.2.14959.10403 Research Gate is an academic social networking site
5
This is an open access article, Research Gate is a European commercial social networking site for scientists and researchers
Sr.
No. Parameters 0.9.00 Hrs 13.00 Hrs In 4 Hrs
In ton
Sp.
Consumption
1 Urea production in 4 hours 450 450
2 Ammonia Integrator reading mass flow meter MT 15678 15934 256.05 256.05 0.569
3 CO2 Integrator reading, Nm3 545456 714754 169298 333 0.739
Table -4 hrs Integrator reading
Q-4- How to Save energy & product quality
by controlling Biuret?
Ans.- When Biuret formation takes place one
mole of ammonia is also loss and resulting poor
prills quality, i.e. hollow prills in presence of
free ammonia in molten urea. The maximum
Biuret formation takes place in urea melt pump
discharge line it can be control by jacket steam
pressure as shown in the following figures.
Fig-Biuret Formation at different Conditions.
Following table shows the saving of energy by
controlling the temperature in urea melt pump
discharge line, these practical’s were carried out
in National fertilizers, India Lab at different
temperature and others condition in the process.
At 1400C the Biuret formation in urea molten
line is about 1.2% and equivalent ammonia at
3600 TD Plant=7.13 Ton. This is the major loss
from prilling tower. This major loss can be
converted to useful energy.
2 Urea →Biuret + NH3 (g) ----∆RH = 55.6
kJ/mol
120 → 103 + 17
Below Figure shows the phase diagram of the
binary urea/Biuret system. This means that
Biuret is a liquid at 193 ◦C if the liquid phase
consists of 67% Biuret and 33% urea. As
decomposition or evaporation of urea becomes
faster at temperatures above 210 ◦C, Biuret will
become solid again. As we will see later, there is
another thermodynamic argument for the
apparent melting point of Biuret. This
interpretation yields a qualitative understanding
of experimental data for urea and Biuret. The
sharp peak at 133 ◦C indicates the melting of
urea. The decomposition of urea starts more or
less with the phase change. Biuret as a reaction
product will remain in the liquid phase. At 193
◦C the decomposition process also starts for
Biuret. The reaction slows down at around 210
◦C, when a foam-like structure is formed.
Presumably, there is no liquid urea present
anymore. Endothermic reactions may lead to
follow-up products like Triuret, cyanuric acid or
ammelide. Around 230 ◦C, the Biuret becomes
liquid again and a second decomposition step is
6. www.researchgate.net
DOI: 10.13140/RG.2.2.14959.10403
This is an open access article, Research Gate is a Europea
Observable in TG measurements. The third
decomposition step between 330 and 400
associated with the sublimation of cyanuric acid.
The remaining solid substances decompose at
Fig-Formation of Biuret with temperature
Following Figure plots the Gibbs free energy of
urea and Biuret in solid and liquid phases. As
expected for urea, the two graphs intersect at T =
22th
Aug,. 2022
Research Gate is an academic social networking site
This is an open access article, Research Gate is a European commercial social networking site for scientists and researchers
in TG measurements. The third
ecomposition step between 330 and 400 ◦C is
associated with the sublimation of cyanuric acid.
lid substances decompose at
temperatures above 400 ◦C, for which we
include a reaction path through ammelide, but
this shall not be the focus of this presentation.
Formation of Biuret with temperature residence time.
plots the Gibbs free energy of
urea and Biuret in solid and liquid phases. As
expected for urea, the two graphs intersect at T =
133 ◦C. However, in case of Biuret
melting temperature is 233 ◦C.
Research Gate is an academic social networking site
6
n commercial social networking site for scientists and researchers
◦C, for which we
include a reaction path through ammelide, but
his presentation.
◦C. However, in case of Biuret the predicted
◦C.
7. www.researchgate.net
DOI: 10.13140/RG.2.2.14959.10403
This is an open access article, Research Gate is a Europea
Fig- Gibbs energy for Urea & Biuret
simultaneously.
Maximum Biuret formation in discharge line of
Urea melt pump as following figure for 3850
Fig- Urea Biuret Formation with material balance for 3850 TPD Plants
Q-5- How much energy saves with additional
HET installation in Urea reactor?
22th
Aug,. 2022
Research Gate is an academic social networking site
This is an open access article, Research Gate is a European commercial social networking site for scientists and researchers
ibbs energy for Urea & Biuret
Maximum Biuret formation in discharge line of
a melt pump as following figure for 3850
TPD plant.(A Case study of RFCL & NFL,
India)
Urea Biuret Formation with material balance for 3850 TPD Plants
How much energy saves with additional
HET installation in Urea reactor?
Ans.- A steam saving of 40 Kg/tone & 42
Kg/tone of urea has been reported by fertili
Research Gate is an academic social networking site
7
n commercial social networking site for scientists and researchers
TPD plant.(A Case study of RFCL & NFL,
saving of 40 Kg/tone & 42
of urea has been reported by fertilizers
8. www.researchgate.net
22th
Aug,. 2022
DOI: 10.13140/RG.2.2.14959.10403 Research Gate is an academic social networking site
8
This is an open access article, Research Gate is a European commercial social networking site for scientists and researchers
manufactures using M/S Snam & M/S Casale
trays. The decrease in steam consumption = 40
Kg/tone of urea as extraction steam.Reduction in
MS extraction flow= (40 x 1800) / (24 x 1000)
=3.0Te/hr. Generally thumb rule, 1.0 Ton less in
extraction flow will increase 0.25Ton
condensing load. Hence reduction in net KS inlet
steam = (3.0 - 0.545) = 2.455Te/hr,
KS=29.9Kg/ton of urea
saving in energy = (30 x 0.81)/1000=0.0243
G.Cal/ton of urea.
Q-6-How much energy save with installation
of Pre- Concentrator?
Ans.- Pre-concentrator is an additional vacuum
stage utilizing heat of condensation of carbamate
vapors from MP decomposer which otherwise is
wasted in CW. Saving of LP Steam (saturated)
@ 200 kg/tone of Urea is expected with the
installation of Pre-Concentrator. Prills quality of
Urea will also improve.
Calculation:
Total SL saved =200*3600/24/1000 T/h = 30.0
T/h, Superheated SL equivalent to
above=30/1.07= 28.03
Therefore by stopping one Benfield turbine &
One BFW pump turbine SL balance can be met.
Considering 0.4 T/h SL as losses Net SM saved
by stopping backpressure turbine =20 T/h
Decrease in SM export of CPP =20 T/H
Decrease in heat input in Boiler in CPP =28 X
0.705 G.cal =19.74 G.cal/h
Calculation:
Increase in fuel in GTG due to running of
additional motor (assuming motor efficiency
90%)=1.8 MW*1.02 G.cal/MWH/0.90=1.932
G.cal/h
Net Energy saving=19.74-2.04=17.7 G.cal/h
Specific Energy saving =17.7x24/3600
=0.118 G.cal/MT of Urea
Say Specific Energy=0.118 G.cal/tone of urea.
Q-7- How to save energy by operation
philosophy?
Ans.-Energy Saving by operation Philosophy
The rate of urea reaction is directly proportional
to
1. N/C ratio
2. Temperature
3. System pressure
4. No. of particles collision with ammonia
& Carbon Dioxide (may be carried out
with Vortex)
5. Surface area.
6. Active mass of the reaction(i.e. law of
mass action)
7. To reduce H/C ratio.
The speed of urea reaction varies hugely
according to above. The minimum amount of
energy needed for the CO2 & ammonia to react
is called the activation energy, and is different
for each reaction. This activation energy can be
supplied by internal flow dynamics of particles
with some mechanical device like Vortex
mixture & conversion booster. The rate of a
reaction depends on two things:
The frequency of collisions between particles
and the energy with which particles collide. If
particles collide with less energy than the
activation energy, they will not react. The
higher the temperature, the faster the rate of a
reaction. In many reactions, a rise in temperature
of 10 °C causes the rate of reaction to
approximately double. At a higher temperature,
particles have more energy. This means they
move faster and are more likely to collide with
other particles. When the particles collide, they
do so with more energy, and so the number of
successful collisions increases. This collision
phenomenon may be done with vortex mixture.
The particles will just bounce off each other.
Anything that increases the number of successful
collisions between reactant particles will speed
up a reaction. The turbulence is necessary to
speed up of reaction.
9. www.researchgate.net
22th
Aug,. 2022
DOI: 10.13140/RG.2.2.14959.10403 Research Gate is an academic social networking site
9
This is an open access article, Research Gate is a European commercial social networking site for scientists and researchers
Reactions do not proceed at a steady rate. They
start off at a certain speed, then get slower and
slower until they stop. As the reaction
progresses, the concentration of reactants
decreases. This reduces the frequency of
collisions between particles and so the reaction
slows down.
Fig -1(Comparison of Reactor internals/trays)
Following operation philosophy to improve
the energy of urea plants.
1. N/C ratio
2. H/C ratio
3. Reactors internals replaced with
advance technology.
1. N/C Ratio
Theoretical mole ratio of NH3: CO2 is 2:1; but in
this condition urea yield is only around 43.44%
at 170 kg/cm2
a and 155° C. This low yield can
be improved by changing NH3: CO2 ratio. When
the excess ammonia is increased to 279 % (mole
ratio of NH3/CO2 is increased), urea yield will
change from 43.5 to 85.2%. The excess of
ammonia over that required to form ammonium
carbamate acts as a dehydrating agent, removing
the water from active mass, thus preventing its
reaction with urea and thereby shifting the
equilibrium toward the urea side. In M/S Saipem
process the optimum N/C ratio is 3.2 to 3.5.
Urea is produced by synthesis from liquid
ammonia and gaseous carbon dioxide. Ammonia
and carbon dioxide react to form ammonium
10. www.researchgate.net
22th
Aug,. 2022
DOI: 10.13140/RG.2.2.14959.10403 Research Gate is an academic social networking site
10
This is an open access article, Research Gate is a European commercial social networking site for scientists and researchers
carbamate, a portion of which dehydrates to
form urea and water. The reaction of ammonium
carbamate dehydration is influenced by the ratio
of various reactants, operating pressure,
temperature and residence time in reactor.
Fig. 2(N/C Ratio Vs. Conversion)
2. H/C ratio
Water is one of the products of reaction during
transformation reaction of carbamate to urea. Its
presence has a depressing effect on the
conversion. Any addition of water with the feed
reduces the conversion. In the urea process the
energy input to the process is mainly in the form
of steam for stripping and the recycling of the
unconverted reactants, water recycling and
concentrating the solution. It is consumption of
the steam, which can be saved by the
optimization of process parameters and can be
reduced water recycling into the reactor. The
main focus area is to optimize the water recycle
in the process and reduce the variability in
process parameters mainly temperature at the
outlet of each stage of decomposition and
concentration common section distillation tower
overhead product i.e. V-8(reflux accumulator)
concentration can be increased by reflux to C-
2(distillation Tower) can be optimized.
The optimization of water recycle should aim at
to reduce the load of common section thereby
steam. One mole of water is formed when one
mole of urea is produced. Presence of excess
water shifts the reaction equilibrium in reverse
direction and yield of urea is reduced. However,
water has to be added for recycling unconverted
ammonia and CO2 back to the reactor. Lower the
amount of water concentration in low pressure
0
10
20
30
40
50
60
70
80
90
100
Equilibrium
Yield
of
Urea
%
Molar Ratio of Ammonia/CO2
Ammonia : CO2 Ratio
Vs
Conversion
With HET
With HET Plus Vortex
with Booster
11. www.researchgate.net
22th
Aug,. 2022
DOI: 10.13140/RG.2.2.14959.10403 Research Gate is an academic social networking site
11
This is an open access article, Research Gate is a European commercial social networking site for scientists and researchers
recovery section results in high concentration of
carbamate and this causes pumping and choking
problem in piping system. Excess water in
reactor reduces effective volume for urea
formation and additional energy is required in
evaporation section. Study shows that presence
of one mole of excess water per mole of
carbamate reduces the equilibrium yield of urea
by nearly one half. Extra water from any other
source has an adverse effect upon the
concentration of urea. First, extra water occupies
volume in the autoclave, thereby decreases its
productive capacity. Second, extra water dilutes
the urea solution, increases the load on the
evaporation and increases energy consumption.
But most important of all, excess water decrease
the yield of urea. The presence of one mole of
excess water per mole of carbamate cuts down
the yield of urea by nearly half. The presence of
excess ammonia over the NH3: CO2 ratio of 2:1
counter acts to a great extent the adverse
influence of water. The formation of urea in
homogeneous solutions is in no case dependant
on the partial pressure of carbon dioxide, but
that the conversion of carbamate into urea is
directly proportional to the partial pressure of
ammonia and inversely proportional to the
partial pressure of water.
Q-8 -How much power consumption in
Granulation, mentioned area?
Ans.- In Granulation section huge amount of
power is used, The High capacity Blowers &
Compressor consume large amount of power.
The power consumption as follows.
Total Power 9.04 MW for 3850 capacity plants.
0.259KW/Ton of Urea consumption in
Granulation section this is only by Blowers &
Compressor while numbers of pumps are there.
Including all it will be 0.264 KW/Ton of Urea
and in terms of K.Cal=226.98 K.Cal/ton of Urea.
OR 0.2269 G.Cal/Ton of Urea.
Q-9- What is the advantages of granular
urea, efficiency wise?
Ans.-There has been a worldwide shift from
prilling of Urea to granulation because the more
desirable products made in granulator. This shift
has taken place to supply growing fertilizer
demand for larger, harder and denser particles.
The urea granules are always better than urea
prills in following ways. The mechanical
properties as well as the slow-release properties
of Nitrogen through urea granules. . Importantly,
as an economical, effective, and environment-
friendly technology.
(A) Direct benefits to the farmer
1. Higher the granular size of Urea lesser would
be leaching losses and hence better yields.
2. Volatilization losses in granular urea are
almost half of Prilled
12. www.researchgate.net
22th
Aug,. 2022
DOI: 10.13140/RG.2.2.14959.10403 Research Gate is an academic social networking site
12
This is an open access article, Research Gate is a European commercial social networking site for scientists and researchers
3. Lesser quantity of granular urea gives better
yields due to saving in leaching and
Volatilization losses.
4. Point placement of granular urea gives much
better yields to point placement.
5. Efficiency is 15-20 % better than prills as per
fig No. 1.
6. No urea losses during the throwing spray
because no dust in granules and urea dust also
harmful for plant leaf.
7. Biuret percentage is less than the prills, hence
more availability of Nitrogen and also harmful
of biuret for crops. Biuret in Granules is 0.8-
0.9 % by weight while in urea prills it is 1.2-
1.3 % and some time it is more than 1.5%, so it
the poison for crops and the biuret toxicity was
identified in crops like avocado, citrus,
pineapple while foliar spray. Biuret does
interfere with N-metabolism. Biuret in urea
can cause agronomic problems if placed near
the seed or even if added pre plant in bands
where seeds will later be planted. The major
damage of biuret is to germinating seeds.
8. Free ammonia in granules is less than prills, in
Urea prills free Ammonia is 160 ppm while in
urea granules it is less than 100 ppm. Free
ammonia is the direct loss and made by biuret
formation and high temperature of urea prills
solution and concentration. The Urea solution
concentration for prills required 99.7 % while
in Urea granules it only 97.0%.So there is less
chances for formation of Biuret & Triuret.
In Urea (NH2CONH2), N-46.6%
In Biuret (NH2CONHCONH2), N-40.7%
9. Due large granules size, slow-release fertilizers
have received increasing attention lately
because the use of them could improve
nutrient-use efficiency and then reduce
environmental hazards.
Sr. No Particulars Prilled Urea Granular Urea
1 Nitrogen Contents, wt.% 46.0% 46.0%
2 Biuret, wt. % 1.1-1.4% 0.8-0.9%
3 Moisture ,% 0.35-0.45% 0.3-0.4%
4 Free Ammonia, ppm 150-190 80-100 ppm
5 Granulometry ,Av % 1.65 mm 2.8-3.5 mm
6 Crushing Strength 0.6-1.2 kg/prill 1.3-3.2 kg/granule
7 Losses By Leaching &
Volatization
Less Losses
8 Environmental Issue Problem due to dust
and ammonia
Friendly
environment
9 Efficiency Efficiency low due to
Ammonia & Dust
Efficiency higher
than Prills,
about,15-20%
10 Any Harm to vegetations Leaf damaged by
Biuret & dust
No harm due to
Biuret & dust is less
11 Leaching Yes No
12 Point Placement No Yes
13 Losses in throwing Yes No
(B) More beneficial due to crushing
strength
The urea granule crushing strength is
approximately is about three times higher than
the prills so the losses during handling is also
minimum. Generally, the crushing strength
about 600 gm to 1.2 Kg per prill. The crushing
strength of Granule Urea is about 1.3 to 3.2 kg
per granules. The crushing strength of fertilizer
particles differs greatly depending on
13. www.researchgate.net
22th
Aug,. 2022
DOI: 10.13140/RG.2.2.14959.10403 Research Gate is an academic social networking site
13
This is an open access article, Research Gate is a European commercial social networking site for scientists and researchers
the chemical composition. Crushing strength is
the minimum pressure needed to crush
individual particles. Determining the crushing
strength, or hardness, will help determine
handling and storage requirements of a chosen
granular product.
(C) Urea granular are environment
friendly
Less leaching loss hence, environment
friendly and less dust losses. In also prilling
process. The prilling tower is the major source
of emission in urea plants. The large volume of
discharge untreated cooling air contain
particulate urea dust 1-2 kg/ton of urea as well
as ammonia 0.7 -1.0 kg/ton of urea. In force
draft prilling tower this figures are 2-5 kg/ton of
urea and ammonia 0.8-1.5 kg/ton of urea.
Increasing the load on a prilling tower can have
negative consequence of prills quality. higher
moisture contents and higher temperature cause
more dust formation and increased likelihood of
caking problems. Urea prills stored at too high
temperatures will also tend to cake, because of
their high plasticity and the presence of residual
liquid phase. In addition, the slow cooling at the
pile surface triggers water migration within the
pile.
Advantages in Use of Granulated Urea:
1. Better industrial quality.
2. Even granulometry.
3. Harder granules.
4. Absorbs lesser moisture from
atmosphere.
5. Can be mixed with other fertilizers.
6. Does not become compact.
Best adaptation to humid climates
1. Less leaching loss hence, environment
friendly.
2. It has less fines and dust when handled
and transported.
Q-10-How much energy saves by inserts gas
recovery? And calculate?
Ans.- (The calculation for NFL, India) In Urea
plant, C-3 off gases from medium pressure
section is being vented continuously to control
the loop pressure. Each stream of Urea Plant
generates around 700 -800 Nm³/h of C-3 off
gases, so total generation of C-3 off gases is
around 2800 Nm³/h. C-3 off gas comprises
Hydrogen, Methane, Ammonia, Nitrogen &
Oxygen in the ratio of 25- 30%, 7-10%, 2.5-
12%, 50-55% & 6-10% respectively.
Considering the heating value of C-3 off gases,
it has been utilized these gases in HRU-I &II as
supplementary fuel. MP inerts washing tower
absorbs ammonia from it’s inlet vapour
comprising of inerts such as hydrogen, methane
argon nitrogen & oxygen in three numbers of
valve trays fitted at the top of the E-11 which is
called as C-03 cold condensate at 40 0
C of about
0.5 -0.8 m3 /hr. is being used as absorbent which
is being introduced at the top of the valve tray
tower(C-3). The some amount (30-50 sm3 /hr)
of natural gas feed in inlet of medium pressure
condenser (E-7) to avoid explosive mixture in
exit of control valve because the oxygen about
8-10 % present in gases mixture. The heat of
absorption for formation of ammonical solution
is being taken out through vertically installed
cooling water exchanger E-11 for better heat
transfer by forming falling film; E-11 has been
equipped with ferrules at top having 02 numbers
tangential hole of 1.5 mm dia hole. Ammonical
solution while falling down through heat
exchanger (E-11) gets cooled after exchanger
heat with cooling water up to about 430C and
recycles back into the upstream equipment as
economy of the process. Inerts along with
residual ammonia was being vented to top of the
prilling tower through 31/41 PV 108 and this
removal of inerts are required to maintain MP
loop pressure at desired range. This inerts gases
along with residual ammonia is called C-3 off
gas having lower calorific value in the range of
1500 Kcal/nm3 . Since commissioning of urea-II
14. www.researchgate.net
DOI: 10.13140/RG.2.2.14959.10403
This is an open access article, Research Gate is a Europea
plant, C-3 off gas comprising of about 4
ammonia was vented to atmosphere through
prilling tower top stack continuously with flow
of about 600-800 nm3 /hr. from each stream of
urea-II. In 2012 these gases had been lined to
HRU in CPP for recovers its energy. However
line-I ammonia in off gasses are 0.5
this gas having significant calorific value. This
modification became successful with saving
0.88G.cal /hr. resulted in financial saving of $
1703 per day. Further during capacity
enhancement project of urea-II plant, process
Licenser M/S. Saipem had recommended certain
modification for the vapour inlet nozzle of 31/
E-11/C-3 and the same modification, vapour
inlet nozzle has been extended up to minimum
bottom level of C-3/E-11 bottom solution holder
from its original location of the equipment weld
neck flange position. After implementation the
modification proposed by process licenser in
July 2012, C-3 off gas ammonia content reduced
drastically from 4-6 to 3-5 % in urea
Off gas is being used as supplementary fuel in
CPP HRSG burner with flow of about 600
nm3 /hr. from each stream with ammonia
contents of 3-6 % giving higher NOx level in the
flue gases of CPP, HRSG. In May 2016 shut
Fig- Energy saving by Inerts gas Fuel.
22th
Aug,. 2022
Research Gate is an academic social networking site
This is an open access article, Research Gate is a European commercial social networking site for scientists and researchers
3 off gas comprising of about 4-5% of
ammonia was vented to atmosphere through
prilling tower top stack continuously with flow
800 nm3 /hr. from each stream of
II. In 2012 these gases had been lined to
HRU in CPP for recovers its energy. However
I ammonia in off gasses are 0.5-1.2 %, In
line-II plant this figure is more than line
minor modification has been do
efficiency of heat exchanger E
since October 2012, modification has been
carried out for utilization of C
supplementary fuel in CPP HRSG burners as
this gas having significant calorific value. This
became successful with saving
financial saving of $
. Further during capacity
II plant, process
Licenser M/S. Saipem had recommended certain
modification for the vapour inlet nozzle of 31/41
3 and the same modification, vapour
inlet nozzle has been extended up to minimum
11 bottom solution holder
from its original location of the equipment weld
neck flange position. After implementation the
by process licenser in
3 off gas ammonia content reduced
5 % in urea-II plant.
Off gas is being used as supplementary fuel in
CPP HRSG burner with flow of about 600-900
nm3 /hr. from each stream with ammonia
6 % giving higher NOx level in the
flue gases of CPP, HRSG. In May 2016 shut
down cooling water exchanger of MP Inerts
washing tower (E-11) has been modified by
plugging about 110 peripheral tubes at top only
with press fitted Teflon plug as shown in
attached photograph in figure No.1. Further one
SS plate has been welded to retain the press
fitted plug at its position firmly. After
implementation of this modification ammonia
contents in C-3 off gas has been come down to
1-2 % .Matter has been tak
Saipem & process Licenser has been agreed for
proposed modification for plugging of E
peripheral tubes. The water contents 0.5
m3/hr is the very less quantity within 400 tubes
the film in heat exchanger was not made, also
the sufficient hold up level up to ferrules
tangential holes on tube sheet, now the 27 %
tubes has been plugged and now no problem in
heat exchanger heat transfer.
Energy saving by Inerts gas Fuel.
Research Gate is an academic social networking site
14
n commercial social networking site for scientists and researchers
II plant this figure is more than line-I so the
minor modification has been done to improved
efficiency of heat exchanger E-11. However
since October 2012, modification has been
carried out for utilization of C-3 off gas as
supplementary fuel in CPP HRSG burners as
down cooling water exchanger of MP Inerts
11) has been modified by
plugging about 110 peripheral tubes at top only
with press fitted Teflon plug as shown in the
attached photograph in figure No.1. Further one
SS plate has been welded to retain the press
fitted plug at its position firmly. After
implementation of this modification ammonia
3 off gas has been come down to
2 % .Matter has been taken up with M/S
Saipem & process Licenser has been agreed for
proposed modification for plugging of E-11
peripheral tubes. The water contents 0.5-0.8
m3/hr is the very less quantity within 400 tubes
the film in heat exchanger was not made, also
nt hold up level up to ferrules
tangential holes on tube sheet, now the 27 %
tubes has been plugged and now no problem in
15. www.researchgate.net
22th
Aug,. 2022
DOI: 10.13140/RG.2.2.14959.10403 Research Gate is an academic social networking site
15
This is an open access article, Research Gate is a European commercial social networking site for scientists and researchers
.
Table- Off gas Fuel Calculation
16. www.researchgate.net
22th
Aug,. 2022
DOI: 10.13140/RG.2.2.14959.10403 Research Gate is an academic social networking site
16
This is an open access article, Research Gate is a European commercial social networking site for scientists and researchers
Fig- some of the tube plugged
Q-11- The ammonia pre heater in Urea plants
what is function and how save energy?
Ans.-Ammonia preheater can be installed in HP
Ammonia Feed pump discharge and can be
heated with Steam condensate which is export to
DM plant or LP decomposer vapour.
Advantages
1. The Conversion increased in urea
reactor, slightly N/C ratio also increase
by 0.1 to 0.2.
2. Steam generation also increased in HP
carbamate condenser.
3. The heat of steam condensate or LPD
vapour dumped to cooling water can be
utilized.
4. Energy saved by this scheme is about
0.01 G.cal /ton of urea
Calculation- For 3850 TPD Plant ammonia
required per hour is 134208 Kg. The Ammonia
preheater heated ammonia up to 200
C to
500
C.the specific enthalpy at 500
C is 445.04
KJ/kg and that of 200
C is 306.68 KJ kg, Hence
for 134208 kg heat transfer=134208*(445.04-
306.68)=18569018.88 KJ/Hr
Hence LS steam
Saved=18569018.88/2107.42=8811.25 Kg/hr
steam OR 8.881 Ton /hr.
Hence energy saved=0.0273 G.Cal /Ton of
urea
17. www.researchgate.net
22th
Aug,. 2022
DOI: 10.13140/RG.2.2.14959.10403 Research Gate is an academic social networking site
17
This is an open access article, Research Gate is a European commercial social networking site for scientists and researchers
Table Ammonia Properties and calculation for 3850 TPD plants
Q-12- How energy saves with modification of
Compressor Internals?
Ans.-The 2D & 3D impellers are very effective
for efficiency wise. The impellers with 3D
blades and leading edges in an axial part were
applied firstly in aviation gas turbine engines
and compressor stages. Their obvious advantage
is the highest durability at high blade velocity.
3D impellers are more effective at high Mach
number and big loading factor. Compressor
users insist on 3D impellers application in areas
where they sometimes have no advantages.
Properly designed compressor with 2D impellers
can be cheaper and not less effective in many
cases. There are no doubts that the advantages of
high flow rate stages with des 0.07-0.08 can
be achieved only by application of 3D impellers.
High flow rate stages effective design principles
deserve proper attention.
Fig-3 D impellers
Q-13-How much energy saves by replacement
of 40ata Turbine drive of CO2 Compressor
with 100 ata turbine?
Ans.-This scheme will optimally utilize steam
from HRU-III of CPP. Use of KS will decrease
heat loss to C/W due to reduction of turbine
condensing load. Steam (100 Kg & 510 degree
18. www.researchgate.net
22th
Aug,. 2022
DOI: 10.13140/RG.2.2.14959.10403 Research Gate is an academic social networking
site
18
This is an open access article, Research Gate is a European commercial social networking site for scientists and researchers
C) 1 Ton 40 Kg steam requires 87 Sm3
NG in boiler 1.0Ton 100 Kg steam requires 94 Sm3
NG. Actually max. Energy (G.Cal) is
consumed during phase change over to
produce steam.
Phase changeover for steam production =0.54
G.Cal/MT.
Heat energy for 40 Kg & 382 degree C steam
production = 0.760 G.Cal/tone of urea.
Heat energy for 100 Kg & 510 degree C steam
production = 0.810 G.Cal/ton of urea.
Calculations
60 Ton/Hr KS is equivalent to (60 x 810) /
760= 64 Ton/Hr of 40 Kg steam.
Saving of 40 Kg steam = (80 – 64) =16
Ton/Hr.
Energy saving = (16 x 0.713 x24)/2620 =
0.104 G.cal/MT of urea.
1 Ton 40 Kg steam = 87 Sm3
NG = 87 X 8200
K.Cal=0.713 G.Cal.
Turbine (shaft power) = Power in (less) -
Power extraction (same) - Power condensing
(high).
Energy saving=0.097 G.cal/tone Urea
Table-Comparison of 1001 ata and 40 ata
Turbine
Q-14- How much Energy saves by Super
cup?
Ans..-In Urea Conversion gas/liquid mixing in
urea reactor with application of high efficiency
trays homogeneous and heterogeneous phases’
equilibria and kinetics is very important. The
efficiency of Urea Reactors can be improved
by the application of the latest generation of
internals .Generally Fluid dynamics
phenomenon are created by the concurrent gas
liquid flow through the simple perforated trays
which generates irregular bubbles now this
problem has been solved by new generation
high efficiency device super cup patented by
M/S. Saipem. Present article intended how
conversion increases by super cup with
geometry of the shape of super cup etc. The
increase in the efficiency has permitted direct
benefits to the overall production and energy
of the units, thus allowing lower energy
consumption and a reduced environmental
impact emission of greenhouse gases. The
Super Cups can be applied to design a new
generation of urea reactors as well as to
improve the performance of existing
equipment in a revamp design.The numbers of
plants installed SuperCup, China, Pakistan,
Maxico, Argentina etc. The performances of
Urea Reactors can be improved by the
19. www.researchgate.net
22th
Aug,. 2022
DOI: 10.13140/RG.2.2.14959.10403 Research Gate is an academic social networking
site
19
This is an open access article, Research Gate is a European commercial social networking site for scientists and researchers
application of the latest generation of internals:
the Saipem Super Cups. In Urea Conversion
gas/liquid mixing in urea reactor with
application of high efficiency trays
homogeneous and heterogeneous phases’
equilibrium and kinetics is very important.
Generally Fluid dynamics phenomenon are
created by the concurrent gas liquid flow
through the simple perforated trays which
generates irregular bubbles now this problem
has been solved by new generation high
efficiency device super cup patented by M/S.
Saipem The proprietary design of this
innovative reaction device is the further step
ahead to approach the theoretical equilibrium
conversion in the urea synthesis. As a
consequence, the Super Cups can be applied to
design a new generation of urea reactors as
well as to improve the performance of existing
equipment in a retrofit design. The Reactor
trays that prevent back-flow of the heavier
solution from the upper part downwards and
favors the gas absorption in the liquid phase.
The support of a systematic plan of fluid-
dynamic simulations gave a significant
contribution to the development of the
innovative design. The increase in the
efficiency has permitted direct benefits to the
overall day-by-day performances of the units,
thus allowing lower energy consumption and a
reduced environmental impact. The fluid-
dynamics of a urea reactor can be significantly
improved by the introduction of the latest
generation of internals recently invented and
patented by Saipem. The driving force for
innovation has come from the continuous trend
toward higher and higher plant efficiency with
the aim to optimize the capital investment of
the high pressure equipment, decrease the
energy consumption and so reduce the
environmental impact of plant operation. The
proprietary Saipem Super Cups drastically
increase the mixing of the reactants phases,
respectively ammonia / ammonium carbamate
and carbon dioxide, thus optimizing the
product conversion rate in the reactor.
The immediate benefit is the lower specific
steam consumption requirement to decompose
Carbamate to CO2 and NH3 in downstream
sections. Taking into consideration the
necessity to minimize the pressure drop across
the reactor, the improved mixing is obtained
without any increase of compression energy
for carbon dioxide. This represents a further
step ahead to get closer to the theoretical
equilibrium conversion in the reactor.
20. www.researchgate.net
DOI: 10.13140/RG.2.2.14959.10403
This is an open access article, Research Gate is a Europea
Graph- Plant load before & after and payback period
Fig- reactor Internals comparison
22th
Aug,. 2022
Research Gate is an academic social networking site
This is an open access article, Research Gate is a European commercial social networking site for scientists and researchers
Plant load before & after and payback period
Research Gate is an academic social networking site
20
n commercial social networking site for scientists and researchers
21. www.researchgate.net
22th
Aug,. 2022
DOI: 10.13140/RG.2.2.14959.10403 Research Gate is an academic social networking site
21
This is an open access article, Research Gate is a European commercial social networking site for scientists and researchers
Table- Conversion comparison
Energy Save- A steam saving of 70 Kg/tone of
urea has been reported by plants who have
installed super cup trays. The decrease in steam
consumption = 40 Kg/tone of urea as extraction
steam. Reduction in MS extraction flow= (70 x
1800) / (24 x 1000) =5.25Te/hr. Generally
thumb rule, 1.0 Ton less in extraction flow will
increase 0.25Ton condensing load. Hence
reduction in net KS inlet steam = (5.25 - 0.545)
= 5.47Te/hr, KS=70 Kg/ton of urea ,saving in
energy = (70 x 0.81)/1000=0.0563 G.Cal/ton of
urea.
22. www.researchgate.net
DOI: 10.13140/RG.2.2.14959.10403
site
This is an open access article, Research Gate is a Europea
Q-15 -How much energy saves by
mixture?
Advantages of Vortex mixture and Conversion
Booster
The Medium pressure steam(24bar) saved
about 75 Kg to 80 kg per ton of urea
Suppose Production= 3500 TPD
Total steam saving= 75 X 3500=262500
kg=262.5 Ton
Enthalpy of M. S=0.670 G.Cal /Ton of 24 bar
steam
Enthalpy= 262.5 X 0.670 G.Cal =175.875
G.cal.
OR saving of Energy=175.875/3500=0.05
G.Cal/ton of urea.
Cost of Energy=Dollar/LHV=1/0.01126
88.8/G.Cal
Saving=88.8 X 0.05 3500 =$15540 per day.
In 365 days==$ 15540 X 365=$ 5672100
1. The temperature profile variation in
the reactor post installation of SIDs.
Usually after installation of Internal
Devices we observe a slight increase
of Urea Reactor bottom temperature
around 0, 5-1 °С. Other temperatures
in Urea Reactor remain the same.
2. The effect on corrosion
especially on reactor lining.
Since the first installation of Internal
Devices in 1997, we have not
observed any negative effect on the
liner (both corrosive and erosive). In
order to protect reactor bottom
there is a special baffle plate installed
under Vortex Mixer.
3. Maintenance of N/C ratio.
N/C ratio after installation of Internal
Devices maintained at the same level.
4. Effect of high temperature reactor
effluent on downstream section.
Urea solution temperature at
reactor outlet is not increased. The
amount of unreacted feedstock (NH
22th
Aug,. 2022
Research Gate is an academic social networking
This is an open access article, Research Gate is a European commercial social networking site for scientists and researchers
How much energy saves by Vortex
Advantages of Vortex mixture and Conversion
The Medium pressure steam(24bar) saved
about 75 Kg to 80 kg per ton of urea
Total steam saving= 75 X 3500=262500
/Ton of 24 bar
Enthalpy= 262.5 X 0.670 G.Cal =175.875
OR saving of Energy=175.875/3500=0.05
Cost of Energy=Dollar/LHV=1/0.01126=$
=$15540 per day.
5672100
emperature profile variation in
the reactor post installation of SIDs.
Usually after installation of Internal
Devices we observe a slight increase
of Urea Reactor bottom temperature
1 °С. Other temperatures
in Urea Reactor remain the same.
effect on corrosion rate and
reactor lining.
Since the first installation of Internal
Devices in 1997, we have not
observed any negative effect on the
liner (both corrosive and erosive). In
order to protect reactor bottom line,
ecial baffle plate installed
N/C ratio after installation of Internal
Devices maintained at the same level.
Effect of high temperature reactor
effluent on downstream section.
Urea solution temperature at the
reactor outlet is not increased. The
amount of unreacted feedstock (NH3
and CO2) in the solution is reduced
which results in reduction of steam
consumption in distillation sections.
5. Residence time variation in reactor.
Due to more efficient carbamate
formation reaction and reduction of
gas liquid volume when the gas turns
into liquid media in reactor bottom,
residence time in urea
reactor is increased.
NFCL Experience
06/17/2014 Guarantee tests Vortex Mixer at
a factory in India successfully completed
On June 30, 2014 NIIK and Nagarjuna
Fertilizers and Chemicals Ltd (NFCL), India
signed a Guarantee Test Certificate of
successful completion of the guarantee test
after installation of the Vortex Mixer into the
urea reactor of Urea Unit
inaugurating the first appearance of NIIK
technology in India. An interest of the Indian
urea producers in NIIK technology can be
explained easily. As one of the largest
fertilizer consumers in the world India is now
facing a huge demand–supply gap of urea.
Driven by raising feedstock prices and high
utility cost the urea manufacturers are looking
for energy reduction and efficiency
enhancement solutions for the plants. NIIK’s
Internal Devices that have already proved its
efficiency in different urea units in Russia and
Research Gate is an academic social networking
22
n commercial social networking site for scientists and researchers
) in the solution is reduced
which results in reduction of steam
consumption in distillation sections.
Residence time variation in reactor.
Due to more efficient carbamate
formation reaction and reduction of
gas liquid volume when the gas turns
into liquid media in reactor bottom,
residence time in urea
Guarantee tests Vortex Mixer at
successfully completed.
On June 30, 2014 NIIK and Nagarjuna
Fertilizers and Chemicals Ltd (NFCL), India
signed a Guarantee Test Certificate of
successful completion of the guarantee test
after installation of the Vortex Mixer into the
Unit-II, thereby
inaugurating the first appearance of NIIK
An interest of the Indian
urea producers in NIIK technology can be
explained easily. As one of the largest
fertilizer consumers in the world India is now
upply gap of urea.
Driven by raising feedstock prices and high
utility cost the urea manufacturers are looking
for energy reduction and efficiency
enhancement solutions for the plants. NIIK’s
Internal Devices that have already proved its
erent urea units in Russia and
23. www.researchgate.net
22th
Aug,. 2022
DOI: 10.13140/RG.2.2.14959.10403 Research Gate is an academic social networking
site
23
This is an open access article, Research Gate is a European commercial social networking site for scientists and researchers
the CIS countries enhance efficiency of the
urea reactor and reduce energy
consumption. The results of the Vortex Mixer
performance at NFCL have surpassed
expectations. A substantial increase in CO2
conversion rate and reduction of ammonium
carbamate recycle resulted in a significant
decrease of medium pressure steam
consumption in distillation sections which was
a guarantee condition. As a result a final MS
steam reduction value was not only achieved
but exceeded the value guaranteed to
RCF Experience
Guarantee performance certificate was signed
on modernization works performed by NIIK
for urea synthesis reactor at Rashtriya
Chemicals and Fertilizers urea plant. The
contract on procurement & installation of a Set
of Internal Devices comprising Vortex Mixer
and Conversion Booster for urea synthesis
reactor at RCF Urea plant was signed in 2015.
Due to limitation of available energy resources
the energy saving measures are in a high
priority in India. NIIK has committed to
guarantee 75 kg steams saving per ton of urea
and accepted great responsibility in the event
of non-reaching of the guaranteed
amount. Despite of limited time for
manufacture and supply of the devices, strict
marking and labeling requirements, special
requirements towards material acceptance
procedure which was performed by
independent third-party inspection authority
and resulted in additional requirements on
legal documents processing, NIIK completed
the task and performed its obligation under the
contract. The works were performed in full
and within the agreed timeline. Local Indian
company Shiv Engineering has been engaged
for assembly operations enabling assembly to
be completed within nine days. Based on the
results of the Guarantee Performance test the
value of steam saving achieved 78,4 kg/t
level. Thus the result not only confirmed the
expected efficiency of NIIK’s engineering
solutions but also exceeded the expectation of
Indian specialists. World’s wise numbers of
vortex mixtures have been installed and
reported best excellent performance.
Q-16- How to save energy by LMS (Load
Management System)?
Ans. The LMS can save plant tripping with
load management. The LMS can save whole
plant by tripping of partial tripping, i.e some of
the items that can be run after resume power
creises. There are vast opportunities to
improve energy use efficiency by eliminating
waste through process optimization. Applying
today’s computing and control equipment and
techniques is one of the most cost-effective
and significant opportunities for larger energy
users to reduce their energy costs and improve
profits. The Load management system (LMS)
is an important element of a comprehensive
energy management program. Complete
information about the plant (circuit breakers
status, source of feeding and level of the
consumed power).Information about the
operating values of the voltage, operating
values of the transformers, operating values of
the medium voltage, load feeders, operating
values of the generators. These values will
assist in getting any action to return the plant
to its normal operation by minimum costs. As
the Smart grid is intelligent power grid,
combining information Technology to the
existing power grid. Electricity suppliers and
consumers exchange real-time information to
two-way and is a next-generation power grid
to optimize energy efficiency.Complete
information about the plant (circuit breakers
status, source of feeding, and level of the
consumed power).Information about the
operating values of the voltage, operating
values of the transformers, operating values of
the medium voltage, load feeders, operating
values of the generators. These values will
assist in getting any action to return the plant
to its normal operation by minimum costs.
Protective information such as the insulation
of cables, temperatures of the generators.
24. www.researchgate.net
22th
Aug,. 2022
DOI: 10.13140/RG.2.2.14959.10403 Research Gate is an academic social networking
site
24
This is an open access article, Research Gate is a European commercial social networking site for scientists and researchers
These parameters are used as a back up for the main protection.
Table- Load Management System priority
25. www.researchgate.net
22th
Aug,. 2022
DOI: 10.13140/RG.2.2.14959.10403 Research Gate is an academic social networking
site
25
This is an open access article, Research Gate is a European commercial social networking site for scientists and researchers
Q-17- What is the others energy tips/thumb
rules ?
Ans.-Billers
1. 22ºC reduction in flue gas temperature
increases boiler efficiency by 1%.
2. 5% reduction in excess air increases
boiler efficiency by 1% OR 1%
reduction of residual oxygen in stack
gas increases boiler efficiency by 1%.
3. A 1 mm thick scale (deposit) on the
water side could increase fuel
consumption by 5 to 8%.
4. A 3 mm thick soot deposition on the
heat transfer surface can cause an
increase in fuel consumption to the
tune of 2.5%.
Steam System
1. A 3 mm diameter hole on a pipe line
carrying 7 kg/cm2 steam would waste
33 kilo litres of fuel oil per year.
2. 6 º C rises in feed water temperature
by economizer / condensate recovery
corresponds to a 1% saving in fuel
consumption, in boiler.
3. 0.25 mm thick air film offers the
same resistance to heat transfer as a
330 mm thick copper wall……
Insulation
1. A bare steam pipe of 150 mm
diameter & 100-meter length, carrying
saturated steam at 8 kg/cm2 would
waste 25000 litres furnace oil in a
year…..!
2. 70% heat losses can be reduced by
floating a layer of 45 mm diameter
polypropylene (plastic) balls on the
surface of 900 hot liquid / condensate
Motors.
1. High efficiency motors offer 4-5%
higher efficiency than standard
motors.
2. For every 100 C increase in motor
operating temperature over
recommended peak, the motor life is
estimated to be halves.
3. If rewinding is not done properly, the
efficiency can be reduced by 5-8%.
Compressed Air
1. Reduction of 1 kg/cm2 air pressure
(8kg/cm2 to 7 kg/cm2) would result in
9% input power savings. This will
reduce compressed air leakage rates by
10%.
2. Compressed air leak from 1 mm hole
size at 7 kg/cm2
pressure would result
mean power loss equivalent to 0.5 kW.
3. Every 50 C reduction in intake air
temperature would result in 1%
reduction in compressor power
consumption.
Chillers
1. Reducing condensing temperature by
5.50 C results in 20-25% decrease in
compressor power consumption.
2. 5.50 C increase in evaporator
temperature reduces compressor
power consumption by 20-25%.
3. 1 mm scale build up on condenser
tubes can increase energy
consumption by 40%.
Conclusion
The most effective way to reduce energy costs
is to cultivate a culture of energy efficiency
within your organization.The energy saving is
the continuous process.Further potential of
energy saving through implementation of
energy saving schemes is limited due to
Technical Feasibility in a plant Replacement
are highly capital intensive with very long
payback period. “Improvement in energy
efficiency reduces cost of production & results
in environmental benefits, e.g. mitigation of
global warming by way of less emission of
Greenhouse gases in the atmosphere.
“Remember that efficiencies of each energy
conversion steps of energy conversion get
multiplied (not averaged) to give the overall
efficiency of the system. Hence, more are the
no. of steps, less is the overall efficiency.”
**********************************************************************************