CCS355 Neural Network & Deep Learning Unit II Notes with Question bank .pdf
MATERIALS-ENGG-UNIT- 2.pptx
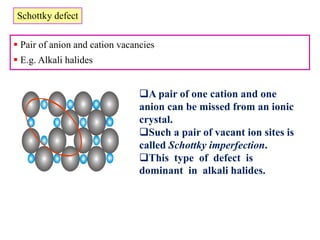
1. Schottky defect
Pair of anion and cation vacancies
E.g. Alkali halides
A pair of one cation and one
anion can be missed from an ionic
crystal.
Such a pair of vacant ion sites is
called Schottky imperfection.
This type of defect is
dominant in alkali halides.
2. EFFECT OF POINT IMPERFECTIONS
The presence of a point
imperfection introduces distortions
in the crystal.
In the case of impurity atom,
because of its difference in size,
elastic strains are created in the
regions surrounding the impurity
atom.
All these factors tend to increase
the potential energy of the crystal
called ‘enthalpy’.
The work done for the creation of
such a point defect is called the
‘enthalpy of formation’ of the point
imperfection.
3. LINE DEFECTS (IMPERFECTIONS)
The defects, which take place due to dislocation or
distortion of atoms along a line, in some direction are
called as ‘line defects’.
Line defects are also called dislocations. In the
geometic sense, they may be called as ‘one
dimensional defects’.
A dislocation may be defined as a disturbed region
between two substantially perfect parts of a crystal.
It is responsible for the phenomenon of slip by which
most metals and alloys deform plastically.
There are two basic types of dislocations:
• Edge dislocation and
• Screw dislocation.
• "Mixed" dislocations, combining aspects of both
types, are also common.
4. EDGE DISLOCATIONS
In perfect crystal, atoms are arranged
in both vertical and horizontal planes
parallel to the side faces.
If one of these vertical planes does not
extend to the full length, but ends in
between within the crystal it is called
‘edge dislocation’.
In the perfect crystal, just above the
edge of the incomplete plane the atoms
are squeezed and are in a state of
compression.
Just below the edge of the incomplete
plane, the atoms are pulled apart and
are in a state of tension.
Edge dislocations are represented by
‘’ or ‘‘ depending on whether the
incomplete plane starts from the top or
from the bottom of the crystal.
These two configurations are referred
to as positive and negative edge
dislocations respectively.
6. BURGER’S VECTOR
The magnitude and the direction of the
displacement are defined by a vector,
called the Burgers Vector.
In figure (a), starting from the point P,
we go up by 6 steps, then move towards
right by 5 steps, move down by 6 steps
and finally move towards left by 5 steps
to reach the starting point P.Now the
Burgers circuit gets closed.
When the same operation is
performed on the defect crystal (figure
(b)) we end up at Q instead of the
starting point.
So, we have to move an extra step to
return to P, in order to close the Burgers
circuit.
The magnitude and the direction of
the step defines the Burgers Vector (BV).
BV = = b
The Burgers Vector is perpendicular
to the edge dislocation line.
7. SCREW DISLOCATIONS
In this dislocation, the atoms
are displaced in two separate
planes perpendicular to each
other.
It forms a spiral ramp around
the dislocation.
The Burgers Vector is parallel
to the screw dislocation line.
Speed of movement of a screw
dislocation is lesser compared to
edge dislocation.
Normally, the real dislocations
in the crystals are the mixtures
of edge and screw dislocation.
8. Planar or Surface Defects
Planar defects arise due to change in the stacking of
atomic planes during mechanical and thermal
treatments.
The change may be of the orientation or of the
stacking sequence of the planes.
Planar defects are of following types:
A. Grain boundaries
B. Tilt boundaries
C. Twin boundaries
8
9. Grain Boundaries
A Grain Boundary is a general planar defect that separates
regions of different crystalline orientation (i.e. grains) within
a polycrystalline solid .
Grain boundaries are usually the result of uneven growth
when the solid is crystallizing.
9
10. GRAIN BOUNDARIES
It is a two dimensional imperfection.
During crystallization, new crystals form in different parts
and they are randomly oriented with respect to one
another.
They grow and impinge on each other.
The atoms held in between are attracted by crystals on
either side and depending on the forces, the atoms
occupy equilibrium positions.
These positions at the boundary region between two
crystals are distorted.
As a result, a region of transition exists in which the
atomic packing is imperfect.
The thickness of this region is 2 to 10 or more atomic
diameters.
The boundary region is called a crystal boundary or a
grain boundary .
11. Tilt Boundaries
When the angle between two crystals is less than 10 deg, the
distortion is not so drastic as to be compared with a non
crystalline material .They are also called low angle boundaries.
It can be described as set of parallel, equally spaced edge
dislocation of same sign located one above other.
A Tilt Boundary, between two slightly mis-aligned grains
appears as an array of edge dislocations.
11
12. Twin Boundaries
These are the boundaries in the grains at which the
atomic arrangement on one side of the boundary is
the mirror image of the atoms on the other side .
The volume of material which has an orientation
similar to the mirror image of the matrix orientation is
called a twin.
The plane is called twinning plane.
12
14. TENSILE BEHAVIOUR TESTING MACHINE
Hard machine
A rigid testing machine with a
high spring constant.
Ex: Screw driven machine.
Will reproduce faithfully the
upper and the lower yield point
Soft machine
Hydraulic testing machine.
The effect of upper and lower yield
point will be smeared out and only
the extension at constant load will be
recorded.
Screw driven machine Hydraulic testing machine 14
16. Engineering stress-strain curve
•Basic design information on the strength of materials.
•An acceptance test for the specification of materials.
Average longitudinal
tensile stress
Average linear strain
Eq.1
Eq.2
16
17. Factors affecting shape and magnitude of
stress-strain curve
• Composition
• Heat treatment
• Prior history of plastic
deformation
• Strain rate
• Temperature
• State of stress
Metallurgical factors
Test conditions
17
18. Tensile strength
Tensile strength or ultimate tensile strength (UTS) su is the
maximum load Pmax divided by the original cross-sectional area Ao
of the specimen.
• Tensile strength is the most value quoted from tensile test
results.
• Useful for specifications, quality control of a product.
• In engineering design, safety factor should be applied.
• Note: yield stress is more practical for ductile materials. But it
has little relation to complex conditions of stress.
18
19. Yielding
Various criteria for the initiation of yielding are used depending
on the sensitivity of the strain measurements and the intended
use of the data.
1) True elastic limit: based on microstrain
measurement at strains on order of 2 x 10⁻⁶.
Very low value and is related to the motion of
a few hundred dislocations.
2) Proportional limit: the highest stress at
which stress is directly proportional to strain.
3) Elastic limit: is the greatest stress the
material can withstand without any
measurable permanent strain after unloading.
Elastic limit > proportional limit.
4) Yield strength: is the stress required to
produce a small specific amount of
deformation.
19
20. Yield strength of materials
The offset yield strength can be determined by the stress corresponding to
the intersection of the stress-strain curve and a line parallel to the elastic
line offset by a strain of 0.2 or 0.1%. (e = 0.002 or 0.001)
In Great Britain, the offset yield stress is
referred to proof stress either at 0.1 or
0.5%strain.
Used for design and specification purposes to avoid the practical
difficulties of measuring the elastic limit or proportional limit. 20
21. Ductility
Ductility is a qualitative, subjective property of a material.
In general, ductility is of interest in three different ways
1) For metal working operation :
indicating amount of deformation can be applied without failure.
2) For stress calculation or the prediction of severe load :
indicating the ability of the metal to flow plastically before failure.
3) For indication of any changes in heat treatments or processing
conditions in metal.
21
22. Measures of ductility
Elongation
Reduction of area, q
These parameters are obtained after fracture by putting specimen
back together and taking the measurement.
Zero-gauge length elongation
22
23. Modulus of elasticity
Modulus of elasticity or Young’s modulus is a measure of material stiffness
(given by the slope of the stress-strain curve).
Modulus of elasticity is determined by
the binding forces between atoms
(structure insensitive property)
Cannot change E, but can improve by
forming composites.
Only slightly affected by alloying
addition, heat treatment or cold work.
Young’s modulus
Stiffness
Deflection
Temperature Young’s modulus
23
24. Resilience
Resilience is an ability of a material to absorb energy when
elastically deformed and to return it when unloaded.
Usually measured by modulus of resilience (strain energy per
unit volume required to stress the material from zero to the yield
stress, σo.
Note: for mechanical springs high yield stress and low modulus of
elasticity.
24
25. Toughness
Toughness is an ability to absorb energy in the plastic range Or
the ability to withstand occasional stresses above the yield
stress without fracture.
Can be simply defined by the area under the stress-strain curve
(amount of work per unit volume that the material can withstand
without failure.)
The structural steel although has a
lower yield point but more ductile than
high carbon spring steel. Structural
steel is therefore tougher.
Toughness = strength + ductility
Ductile materials Brittle materials
Comparison of stress-strain
curves for high and low-
toughness materials
25
26. True-stress-true-strain curve
True stress-strain curve gives a true indication of deformation
characteristics because it is based on the instantaneous dimension
of the specimen.
The true stress-strain curve is also known as the flow curve.
In engineering stress-strain curve,
stress drops down after necking since
it is based on the original area.
In true stress-strain curve, the stress
however increases after necking since
the cross-sectional area of the
specimen decreases rapidly after
necking.
True stress True strain
Comparison of engineering
and the true stress-strain
curves
26
27. True stress at maximum load
True stress at maximum load corresponds to the true tensile strength.
The ultimate tensile strength
The true stress at maximum load
And true strain at maximum load
Eliminating Pmax gives
Where σu true stress at maximum load
εu true strain at maximum load
Au cross-sectional area of the specimen at maximum load
27
28. True fracture stress
The true fracture stress σf is the load at fracture Pfracture divided
by the cross sectional area at fracture Af.
Note: Need to be corrected for the
triaxial state of stress existing in the
tensile specimen at fracture. Often
error.
True fracture strain
The true fracture strain εf is based
on the original area Ao and the area
after fracture Af.
After necking, the true fracture
strain can be related to the area
of reduction q.
28
29. True uniform strain
The true uniform strain εu is the
true strain based only on the strain
up to the maximum load.
Can either be measured from Au or
Lu at maximum load.
The uniform strain is often used in
estimating the formability of metals
from the result of a tension test.
The true local necking strain is the
strain required to deform the specimen
from the maximum load to fracture.
True local necking strain
Engineering and true
stress-strain curves
29
30. Power-law flow curve
The flow curve of many metals in the region of uniform plastic
deformation can be expressed by the simple power law.
Where n is the strain hardening exponent
K is the strength coefficient
Log-log plot of true stress-strain curve from yield point up to the maximum
load will result in a straight line where n is the slope and K
is the true stress at ε = 1.0.
n = 0 perfectly plastic solid
n = 1 elastic solid
For most metals, 0.1< n < 0.5
Log-log plot of true
stress-strain curve
Different forms of power
curve σ = Kεn
30