https://poweredtemplate.com/quality-assurance-plan-google-slides-117610/
A Quality Assurance Plan (QAP) is a presentation created by the QA team or project team. Following the rules described in plan will ensure the finished product meets all quality criteria and making it meet all customer requirements. This presentation template has useful topics such as: Introduction; Project Summary; Project Goals; QA Process; QA Model; Cost of Software Quality; QA Team; Project Team Structure; QA Task Matrix; S.W.O.T Analysis; QA Dashboard; Action Plan; Defect Management Approach, Six Sigma Framework, Risk Types, Risk Identification Process; Risk Management Process; Risk Matrix; QA Assessment Sheet; Critical Patch Method; Contacts.
https://poweredtemplate.com/project-proposal-google-slide-template-116251/
Get a modern Presentation that is beautifully designed, functional, and specialised on business project proposal. This presentation comes with infographic elements, all the proposal real topics, table, charts graphs, maps, device showcase and icons.
This presentation template is so versatile that it can be used in many different businesses, with this many slides you are able to make a complete presentation (proposal) that best suit your needs.
**NO KNOWLEDGE REQUIRED IN ANY APPLICATION**
We made this presentation with many formats for different type of technical and non technical person. Choose what and how can you edit it.
Our Education Presentation Template allows you to simply add your logo, and images and edit your brand colors and typography and you’re good to go. Don’t waste your time, we’ve done all the hard work for you.
Export and send to clients as a pdf, pptx. Easy to replace typography and brand colors with your own.
The Education Presentation Template is a classic timeless clean design, inspired by one of my favorite brands: Aesop.
We have designed this template to be as flexible as possible for a variety of clients. Sections include Cover, Welcome, Content, About, Special Service, Team Management, Typography, Imagery, Data Chart & Infographic, and Contact.
https://poweredtemplate.com/corporate-business-presentation-template-114159/
**New look, professional, modern and clean business powerpoint template. Perfect for corporate business presentations, such as- Business Pitch Deck, Business Proposal, Company Profile, Marketing Strategy, Annual Report, Startup, Academic etc. All pictures can be easily inserted with just drag and drop or one click. Professional layout, unique and useful design. This item includes about 130+ slides ready to impress your audience!**
https://poweredtemplate.com/business-plan-powerpoint-template-113934/
**New look, professional, modern and clean business powerpoint template. Perfect for corporate business presentations, such as- Business Pitch Deck, Business Proposal, Company Profile, Marketing Strategy, Annual Report, Startup, Academic etc. All pictures can be easily inserted with just drag and drop or one click. Professional layout, unique and useful design. This item includes about 130+ slides ready to impress your audience!**
https://poweredtemplate.com/process-infographics-google-slide-layout-110961/
Looking for a way to explain your complex Process Infographics Template or workflow to your team or clients? With these pre-designed process infographic templates, you can quickly and easily craft a visually striking presentation. Whether you’re looking to explain a simple process or a more complex workflow, we have a template for you. Use line, circular, or gear-based designs to show the flow of your process. Or, use a linear design to show a step-by-step process. Whether you’re looking to explain a simple process or a more complex workflow, we have a template for you.
Cellular Network Diagram (for PowerPoint and Google Slides)PoweredTemplate.com
https://poweredtemplate.com/powerpoint-diagrams-charts/ppt-business-models-diagrams/01109/0/index.html
To visualize cellular network or principles of mobile phone networks will be ideal to use this Cellular Network Diagram is a good choice for presentations on business, communications, telecommunications, connections, mobile telephony, technology, science, etc.
https://poweredtemplate.com/powerpoint-diagrams-charts/ppt-pie-charts/01056/0/index.html
Polar Area Diagram will be perfect for visualization multiple comparisons, statistic research, etc. Could be used in statistic dedicated presentations.
Balance the Scales Diagram (for PowerPoint and Google Slides)PoweredTemplate.com
https://poweredtemplate.com/powerpoint-diagrams-charts/ppt-business-models-diagrams/01031/0/index.html
Balance the Scales Diagram with balance and human shapes on it will be ideal for presentations on sociological topics, population research, study of various social groups in society, etc.
Business Process Diagram (for PowerPoint and Google Slides)PoweredTemplate.com
https://poweredtemplate.com/powerpoint-diagrams-charts/ppt-process-diagrams/01011/0/index.html
Business Process Diagram will be ideal choice for showing connections between business, benefits, processes, relationships, business groups, strategy, goals, stages, step-by-step objects, circular objects, flowchart, etc.
Presentation Process Diagram (for PowerPoint and Google Slides)PoweredTemplate.com
https://poweredtemplate.com/powerpoint-diagrams-charts/ppt-business-models-diagrams/00953/0/index.html
This Presentation Process Diagram was created for demonstration effectiveness of presentations in your slideshow. Will be ideal for presentations on art of public speaking, training of public speaking, etc.
Gears System Concept Diagram (for PowerPoint and Google Slides)PoweredTemplate.com
https://poweredtemplate.com/powerpoint-diagrams-charts/ppt-stage-diagrams/00940/0/index.html
Gears System Concept Diagram with gear wheels and human shapes will be ideal for visualization processes of interactions between stages, departments, parts of mechanism, etc. Will be used for presentations on business, scientific, mechanical processes, education, sociology, etc.
Cloud Computing Diagram (for PowerPoint and Google Slides)PoweredTemplate.com
https://poweredtemplate.com/powerpoint-diagrams-charts/ppt-business-models-diagrams/00930/0/index.html
Cloud Computing Diagram will explain your audience main idea of cloud computing. Through this you could explain what means distributed computing, cloud technology, remote terminal, etc. Will be ideal for presentations on different IT topics.
https://poweredtemplate.com/powerpoint-diagrams-charts/ppt-process-diagrams/00740/0/index.html
In case you need to graphically display linear processes you could use this 3D Process Arrows set. It will be helpful for presentations on stages of business processes, business plan from start to the achievement, etc.
https://poweredtemplate.com/powerpoint-diagrams-charts/ppt-shapes/00734/0/index.html
Gears and wheels set is useful when it's necessary to show interaction between production processes and human resources, links between human factor and stages of business processes, etc.
Working Time Process Diagram (for PowerPoint and Google Slides)PoweredTemplate.com
https://poweredtemplate.com/powerpoint-diagrams-charts/ppt-stage-diagrams/00653/0/index.html
Nice set of clock faces , timers, will be ideal for presentations on time management, time management resources, milestones monitoring, process stages, etc.
https://poweredtemplate.com/powerpoint-diagrams-charts/ppt-process-diagrams/00634/0/index.html
Mixing of gear wheels, clock faces and human silhouettes allows to use this set in various presentation on process stages, time management and human resources management, connection between various aspects of human activity, etc.
https://poweredtemplate.com/powerpoint-diagrams-charts/ppt-shapes/00620/0/index.html
The 4 Stage Shapes presentation template is an excellent tool to showcase complex ideas in an elegant and visually appealing way, a dynamic and visually compelling infographics template that is ideal for illustrating business models or frameworks that involve a 4-stage process. This template features a sophisticated 3D diagram comprising 4 wedges that simulate being part of a sphere. The unique shape of the diagram is perfect for representing a cyclical or continuous process, allowing you to showcase your business model innovatively and engagingly. It also can be used for representing a solid business model with 4 parts or stages, like a SWOT diagram (strengths, weaknesses, opportunities, and threats).
Whether you are presenting a sales process, a product development framework, or a marketing strategy, the 4 Stage Shapes template can help you convey complex information in a clear and compelling manner. The 4 wedges can represent different stages of a process, such as Ideation, Planning, Execution, and Evaluation. Alternatively, you can use them to illustrate different phases of a product life cycle, such as Introduction, Growth, Maturity, and Decline.
Other business models that can be represented as a 4-stage process or framework include the Lean Startup model (Build, Measure, Learn, Iterate), the Design Thinking process (Empathize, Define, Ideate, Prototype), and the Product Development process (Concept, Design, Prototype, Launch).
https://poweredtemplate.com/powerpoint-diagrams-charts/ppt-stage-diagrams/00594/0/index.html
This nice collection of tubby charts will help you in presentations dedicated to comparison, evaluation, business grow, etc.
SWOT Analysis Petals Diagram (for PowerPoint and Google Slides)PoweredTemplate.com
https://poweredtemplate.com/powerpoint-diagrams-charts/ppt-business-models-diagrams/00589/0/index.html
SWOT petals diagram is a valuable tool for any business, and especially useful for business consultants and students. SWOT is the acronym for Strengths, Weaknesses, Opportunities and Threats and is often diagrammed for comparisons. Will be useful for presentations on SWOT, SWOT analysis, marketing, business, etc.
Balanced Scorecards Diagram (for PowerPoint and Google Slides)PoweredTemplate.com
https://poweredtemplate.com/powerpoint-diagrams-charts/ppt-business-models-diagrams/00587/0/index.html
Balanced Scorecard diagram is strategic planning and management system used to align business activities to the vision statement of an organization.
Life Cycle Assessment Diagram (for PowerPoint and Google Slides)PoweredTemplate.com
https://poweredtemplate.com/powerpoint-diagrams-charts/ppt-process-diagrams/00573/0/index.html
Chevron type diagram set will be ideal for presentations about lace, life circle assessment, life cycle analysis, Eco balance, cradle-to-grave analysis, assess environmental impacts, stages of a product's life, etc.
Supply Chain Management Diagram (for PowerPoint and Google Slides)PoweredTemplate.com
https://poweredtemplate.com/powerpoint-diagrams-charts/ppt-business-models-diagrams/00571/0/index.html
Supply Chain Management Diagram Set will be perfect choice for presentations on scm, supply chain, logistics, operating costs, management, strategic planing, supply chain planing, etc.
Students, digital devices and success - Andreas Schleicher - 27 May 2024..pptxEduSkills OECD
Andreas Schleicher presents at the OECD webinar ‘Digital devices in schools: detrimental distraction or secret to success?’ on 27 May 2024. The presentation was based on findings from PISA 2022 results and the webinar helped launch the PISA in Focus ‘Managing screen time: How to protect and equip students against distraction’ https://www.oecd-ilibrary.org/education/managing-screen-time_7c225af4-en and the OECD Education Policy Perspective ‘Students, digital devices and success’ can be found here - https://oe.cd/il/5yV
We all have good and bad thoughts from time to time and situation to situation. We are bombarded daily with spiraling thoughts(both negative and positive) creating all-consuming feel , making us difficult to manage with associated suffering. Good thoughts are like our Mob Signal (Positive thought) amidst noise(negative thought) in the atmosphere. Negative thoughts like noise outweigh positive thoughts. These thoughts often create unwanted confusion, trouble, stress and frustration in our mind as well as chaos in our physical world. Negative thoughts are also known as “distorted thinking”.
The Art Pastor's Guide to Sabbath | Steve ThomasonSteve Thomason
What is the purpose of the Sabbath Law in the Torah. It is interesting to compare how the context of the law shifts from Exodus to Deuteronomy. Who gets to rest, and why?
Synthetic Fiber Construction in lab .pptxPavel ( NSTU)
Synthetic fiber production is a fascinating and complex field that blends chemistry, engineering, and environmental science. By understanding these aspects, students can gain a comprehensive view of synthetic fiber production, its impact on society and the environment, and the potential for future innovations. Synthetic fibers play a crucial role in modern society, impacting various aspects of daily life, industry, and the environment. ynthetic fibers are integral to modern life, offering a range of benefits from cost-effectiveness and versatility to innovative applications and performance characteristics. While they pose environmental challenges, ongoing research and development aim to create more sustainable and eco-friendly alternatives. Understanding the importance of synthetic fibers helps in appreciating their role in the economy, industry, and daily life, while also emphasizing the need for sustainable practices and innovation.
The French Revolution, which began in 1789, was a period of radical social and political upheaval in France. It marked the decline of absolute monarchies, the rise of secular and democratic republics, and the eventual rise of Napoleon Bonaparte. This revolutionary period is crucial in understanding the transition from feudalism to modernity in Europe.
For more information, visit-www.vavaclasses.com
Read| The latest issue of The Challenger is here! We are thrilled to announce that our school paper has qualified for the NATIONAL SCHOOLS PRESS CONFERENCE (NSPC) 2024. Thank you for your unwavering support and trust. Dive into the stories that made us stand out!
2024.06.01 Introducing a competency framework for languag learning materials ...Sandy Millin
http://sandymillin.wordpress.com/iateflwebinar2024
Published classroom materials form the basis of syllabuses, drive teacher professional development, and have a potentially huge influence on learners, teachers and education systems. All teachers also create their own materials, whether a few sentences on a blackboard, a highly-structured fully-realised online course, or anything in between. Despite this, the knowledge and skills needed to create effective language learning materials are rarely part of teacher training, and are mostly learnt by trial and error.
Knowledge and skills frameworks, generally called competency frameworks, for ELT teachers, trainers and managers have existed for a few years now. However, until I created one for my MA dissertation, there wasn’t one drawing together what we need to know and do to be able to effectively produce language learning materials.
This webinar will introduce you to my framework, highlighting the key competencies I identified from my research. It will also show how anybody involved in language teaching (any language, not just English!), teacher training, managing schools or developing language learning materials can benefit from using the framework.
The Indian economy is classified into different sectors to simplify the analysis and understanding of economic activities. For Class 10, it's essential to grasp the sectors of the Indian economy, understand their characteristics, and recognize their importance. This guide will provide detailed notes on the Sectors of the Indian Economy Class 10, using specific long-tail keywords to enhance comprehension.
For more information, visit-www.vavaclasses.com
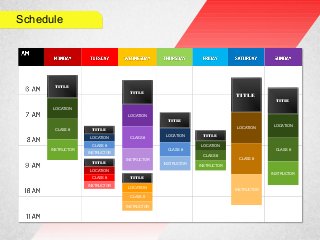
3. Schedule
SUNDAYSUNDAY MONDAYMONDAY TUESDAYTUESDAY
WEDNESDAWEDNESDA
YY
THURSDAYTHURSDAY FRIDAYFRIDAY SATURDAYSATURDAY
6 AM :30
7 AM :30
8 AM :30
9 AM :30
10 AM :30
11 AM :30
12 PM :30
1 PM :30
2 PM :30
3 PM :30
4 PM :30
5 PM :30
6 PM :30
7 PM :30
8 PM :30
9 PM :30
10 PM :30
11 PM :30
TITLE
LOCATION
CLASS #
INSTRUCTOR
TITLE
LOCATION
CLASS #
INSTRUCTOR
TITLE
LOCATION
CLASS #
INSTRUCTOR
TITLE
LOCATION
CLASS #
INSTRUCTOR
TITLE
LOCATION
CLASS #
INSTRUCTOR
TITLE
LOCATION
CLASS #
INSTRUCTOR
TITLE
LOCATION
CLASS #
INSTRUCTOR
7. Schedule
SUNDAYSUNDAY MONDAYMONDAY TUESDAYTUESDAY
WEDNESDAWEDNESDA
YY
THURSDAYTHURSDAY FRIDAYFRIDAY SATURDAYSATURDAY
6 AM :30
7 AM :30
8 AM :30
9 AM :30
10 AM :30
11 AM :30
12 PM :30
1 PM :30
2 PM :30
3 PM :30
4 PM :30
5 PM :30
6 PM :30
7 PM :30
8 PM :30
9 PM :30
10 PM :30
11 PM :30
TITLE
LOCATION
CLASS #
INSTRUCTOR
TITLE
LOCATION
CLASS #
INSTRUCTOR
TITLE
LOCATION
CLASS #
INSTRUCTOR
TITLE
LOCATION
CLASS #
INSTRUCTOR
TITLE
LOCATION
CLASS #
INSTRUCTOR
TITLE
LOCATION
CLASS #
INSTRUCTOR
TITLE
LOCATION
CLASS #
INSTRUCTOR