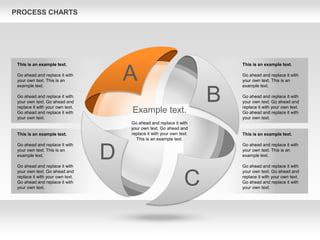
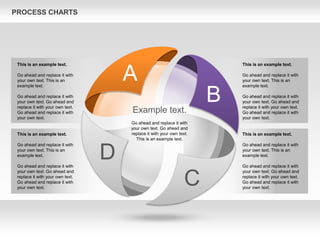
https://poweredtemplate.com/powerpoint-diagrams-charts/ppt-shapes/00620/0/index.html
The 4 Stage Shapes presentation template is an excellent tool to showcase complex ideas in an elegant and visually appealing way, a dynamic and visually compelling infographics template that is ideal for illustrating business models or frameworks that involve a 4-stage process. This template features a sophisticated 3D diagram comprising 4 wedges that simulate being part of a sphere. The unique shape of the diagram is perfect for representing a cyclical or continuous process, allowing you to showcase your business model innovatively and engagingly. It also can be used for representing a solid business model with 4 parts or stages, like a SWOT diagram (strengths, weaknesses, opportunities, and threats).
Whether you are presenting a sales process, a product development framework, or a marketing strategy, the 4 Stage Shapes template can help you convey complex information in a clear and compelling manner. The 4 wedges can represent different stages of a process, such as Ideation, Planning, Execution, and Evaluation. Alternatively, you can use them to illustrate different phases of a product life cycle, such as Introduction, Growth, Maturity, and Decline.
Other business models that can be represented as a 4-stage process or framework include the Lean Startup model (Build, Measure, Learn, Iterate), the Design Thinking process (Empathize, Define, Ideate, Prototype), and the Product Development process (Concept, Design, Prototype, Launch).
Action Steps 3D Arrows (for PowerPoint and Google Slides)PoweredTemplate.com
https://poweredtemplate.com/powerpoint-diagrams-charts/ppt-stage-diagrams/00400/0/index.html
These charts will be a great choice for presentations on step-by-step processes, stages of process, dividing into parts, main moments of process, order of actions, interconnection of actions, etc.
https://poweredtemplate.com/powerpoint-diagrams-charts/ppt-stage-diagrams/00594/0/index.html
This nice collection of tubby charts will help you in presentations dedicated to comparison, evaluation, business grow, etc.
https://poweredtemplate.com/powerpoint-diagrams-charts/ppt-process-diagrams/00740/0/index.html
In case you need to graphically display linear processes you could use this 3D Process Arrows set. It will be helpful for presentations on stages of business processes, business plan from start to the achievement, etc.
Cloud Computing Diagram (for PowerPoint and Google Slides)PoweredTemplate.com
https://poweredtemplate.com/powerpoint-diagrams-charts/ppt-business-models-diagrams/00930/0/index.html
Cloud Computing Diagram will explain your audience main idea of cloud computing. Through this you could explain what means distributed computing, cloud technology, remote terminal, etc. Will be ideal for presentations on different IT topics.
https://poweredtemplate.com/powerpoint-diagrams-charts/ppt-business-models-diagrams/00945/0/index.html
Process Teamwork will show interactions in team, team management, team duty, etc. Will be used in presentations on business processes, startup projects, team working, etc.
Business Process Diagram (for PowerPoint and Google Slides)PoweredTemplate.com
https://poweredtemplate.com/powerpoint-diagrams-charts/ppt-process-diagrams/01011/0/index.html
Business Process Diagram will be ideal choice for showing connections between business, benefits, processes, relationships, business groups, strategy, goals, stages, step-by-step objects, circular objects, flowchart, etc.
https://poweredtemplate.com/powerpoint-diagrams-charts/ppt-powerpoint-education-charts/00457/0/index.html
This collection of diagrams with lens that focuses various flows will be nice choice for presentations on business trends, business components, etc.
https://poweredtemplate.com/quality-assurance-plan-google-slides-117610/
A Quality Assurance Plan (QAP) is a presentation created by the QA team or project team. Following the rules described in plan will ensure the finished product meets all quality criteria and making it meet all customer requirements. This presentation template has useful topics such as: Introduction; Project Summary; Project Goals; QA Process; QA Model; Cost of Software Quality; QA Team; Project Team Structure; QA Task Matrix; S.W.O.T Analysis; QA Dashboard; Action Plan; Defect Management Approach, Six Sigma Framework, Risk Types, Risk Identification Process; Risk Management Process; Risk Matrix; QA Assessment Sheet; Critical Patch Method; Contacts.
https://poweredtemplate.com/project-proposal-google-slide-template-116251/
Get a modern Presentation that is beautifully designed, functional, and specialised on business project proposal. This presentation comes with infographic elements, all the proposal real topics, table, charts graphs, maps, device showcase and icons.
This presentation template is so versatile that it can be used in many different businesses, with this many slides you are able to make a complete presentation (proposal) that best suit your needs.
**NO KNOWLEDGE REQUIRED IN ANY APPLICATION**
We made this presentation with many formats for different type of technical and non technical person. Choose what and how can you edit it.
More Related Content
Similar to Stage Shapes (for PowerPoint and Google Slides)
https://poweredtemplate.com/powerpoint-diagrams-charts/ppt-process-diagrams/00740/0/index.html
In case you need to graphically display linear processes you could use this 3D Process Arrows set. It will be helpful for presentations on stages of business processes, business plan from start to the achievement, etc.
Cloud Computing Diagram (for PowerPoint and Google Slides)PoweredTemplate.com
https://poweredtemplate.com/powerpoint-diagrams-charts/ppt-business-models-diagrams/00930/0/index.html
Cloud Computing Diagram will explain your audience main idea of cloud computing. Through this you could explain what means distributed computing, cloud technology, remote terminal, etc. Will be ideal for presentations on different IT topics.
https://poweredtemplate.com/powerpoint-diagrams-charts/ppt-business-models-diagrams/00945/0/index.html
Process Teamwork will show interactions in team, team management, team duty, etc. Will be used in presentations on business processes, startup projects, team working, etc.
Business Process Diagram (for PowerPoint and Google Slides)PoweredTemplate.com
https://poweredtemplate.com/powerpoint-diagrams-charts/ppt-process-diagrams/01011/0/index.html
Business Process Diagram will be ideal choice for showing connections between business, benefits, processes, relationships, business groups, strategy, goals, stages, step-by-step objects, circular objects, flowchart, etc.
https://poweredtemplate.com/powerpoint-diagrams-charts/ppt-powerpoint-education-charts/00457/0/index.html
This collection of diagrams with lens that focuses various flows will be nice choice for presentations on business trends, business components, etc.
https://poweredtemplate.com/quality-assurance-plan-google-slides-117610/
A Quality Assurance Plan (QAP) is a presentation created by the QA team or project team. Following the rules described in plan will ensure the finished product meets all quality criteria and making it meet all customer requirements. This presentation template has useful topics such as: Introduction; Project Summary; Project Goals; QA Process; QA Model; Cost of Software Quality; QA Team; Project Team Structure; QA Task Matrix; S.W.O.T Analysis; QA Dashboard; Action Plan; Defect Management Approach, Six Sigma Framework, Risk Types, Risk Identification Process; Risk Management Process; Risk Matrix; QA Assessment Sheet; Critical Patch Method; Contacts.
https://poweredtemplate.com/project-proposal-google-slide-template-116251/
Get a modern Presentation that is beautifully designed, functional, and specialised on business project proposal. This presentation comes with infographic elements, all the proposal real topics, table, charts graphs, maps, device showcase and icons.
This presentation template is so versatile that it can be used in many different businesses, with this many slides you are able to make a complete presentation (proposal) that best suit your needs.
**NO KNOWLEDGE REQUIRED IN ANY APPLICATION**
We made this presentation with many formats for different type of technical and non technical person. Choose what and how can you edit it.
Our Education Presentation Template allows you to simply add your logo, and images and edit your brand colors and typography and you’re good to go. Don’t waste your time, we’ve done all the hard work for you.
Export and send to clients as a pdf, pptx. Easy to replace typography and brand colors with your own.
The Education Presentation Template is a classic timeless clean design, inspired by one of my favorite brands: Aesop.
We have designed this template to be as flexible as possible for a variety of clients. Sections include Cover, Welcome, Content, About, Special Service, Team Management, Typography, Imagery, Data Chart & Infographic, and Contact.
https://poweredtemplate.com/corporate-business-presentation-template-114159/
**New look, professional, modern and clean business powerpoint template. Perfect for corporate business presentations, such as- Business Pitch Deck, Business Proposal, Company Profile, Marketing Strategy, Annual Report, Startup, Academic etc. All pictures can be easily inserted with just drag and drop or one click. Professional layout, unique and useful design. This item includes about 130+ slides ready to impress your audience!**
https://poweredtemplate.com/business-plan-powerpoint-template-113934/
**New look, professional, modern and clean business powerpoint template. Perfect for corporate business presentations, such as- Business Pitch Deck, Business Proposal, Company Profile, Marketing Strategy, Annual Report, Startup, Academic etc. All pictures can be easily inserted with just drag and drop or one click. Professional layout, unique and useful design. This item includes about 130+ slides ready to impress your audience!**
https://poweredtemplate.com/process-infographics-google-slide-layout-110961/
Looking for a way to explain your complex Process Infographics Template or workflow to your team or clients? With these pre-designed process infographic templates, you can quickly and easily craft a visually striking presentation. Whether you’re looking to explain a simple process or a more complex workflow, we have a template for you. Use line, circular, or gear-based designs to show the flow of your process. Or, use a linear design to show a step-by-step process. Whether you’re looking to explain a simple process or a more complex workflow, we have a template for you.
Cellular Network Diagram (for PowerPoint and Google Slides)PoweredTemplate.com
https://poweredtemplate.com/powerpoint-diagrams-charts/ppt-business-models-diagrams/01109/0/index.html
To visualize cellular network or principles of mobile phone networks will be ideal to use this Cellular Network Diagram is a good choice for presentations on business, communications, telecommunications, connections, mobile telephony, technology, science, etc.
https://poweredtemplate.com/powerpoint-diagrams-charts/ppt-pie-charts/01056/0/index.html
Polar Area Diagram will be perfect for visualization multiple comparisons, statistic research, etc. Could be used in statistic dedicated presentations.
Balance the Scales Diagram (for PowerPoint and Google Slides)PoweredTemplate.com
https://poweredtemplate.com/powerpoint-diagrams-charts/ppt-business-models-diagrams/01031/0/index.html
Balance the Scales Diagram with balance and human shapes on it will be ideal for presentations on sociological topics, population research, study of various social groups in society, etc.
Presentation Process Diagram (for PowerPoint and Google Slides)PoweredTemplate.com
https://poweredtemplate.com/powerpoint-diagrams-charts/ppt-business-models-diagrams/00953/0/index.html
This Presentation Process Diagram was created for demonstration effectiveness of presentations in your slideshow. Will be ideal for presentations on art of public speaking, training of public speaking, etc.
Gears System Concept Diagram (for PowerPoint and Google Slides)PoweredTemplate.com
https://poweredtemplate.com/powerpoint-diagrams-charts/ppt-stage-diagrams/00940/0/index.html
Gears System Concept Diagram with gear wheels and human shapes will be ideal for visualization processes of interactions between stages, departments, parts of mechanism, etc. Will be used for presentations on business, scientific, mechanical processes, education, sociology, etc.
https://poweredtemplate.com/powerpoint-diagrams-charts/ppt-shapes/00734/0/index.html
Gears and wheels set is useful when it's necessary to show interaction between production processes and human resources, links between human factor and stages of business processes, etc.
Working Time Process Diagram (for PowerPoint and Google Slides)PoweredTemplate.com
https://poweredtemplate.com/powerpoint-diagrams-charts/ppt-stage-diagrams/00653/0/index.html
Nice set of clock faces , timers, will be ideal for presentations on time management, time management resources, milestones monitoring, process stages, etc.
https://poweredtemplate.com/powerpoint-diagrams-charts/ppt-process-diagrams/00634/0/index.html
Mixing of gear wheels, clock faces and human silhouettes allows to use this set in various presentation on process stages, time management and human resources management, connection between various aspects of human activity, etc.
SWOT Analysis Petals Diagram (for PowerPoint and Google Slides)PoweredTemplate.com
https://poweredtemplate.com/powerpoint-diagrams-charts/ppt-business-models-diagrams/00589/0/index.html
SWOT petals diagram is a valuable tool for any business, and especially useful for business consultants and students. SWOT is the acronym for Strengths, Weaknesses, Opportunities and Threats and is often diagrammed for comparisons. Will be useful for presentations on SWOT, SWOT analysis, marketing, business, etc.
Balanced Scorecards Diagram (for PowerPoint and Google Slides)PoweredTemplate.com
https://poweredtemplate.com/powerpoint-diagrams-charts/ppt-business-models-diagrams/00587/0/index.html
Balanced Scorecard diagram is strategic planning and management system used to align business activities to the vision statement of an organization.
Life Cycle Assessment Diagram (for PowerPoint and Google Slides)PoweredTemplate.com
https://poweredtemplate.com/powerpoint-diagrams-charts/ppt-process-diagrams/00573/0/index.html
Chevron type diagram set will be ideal for presentations about lace, life circle assessment, life cycle analysis, Eco balance, cradle-to-grave analysis, assess environmental impacts, stages of a product's life, etc.
Supply Chain Management Diagram (for PowerPoint and Google Slides)PoweredTemplate.com
https://poweredtemplate.com/powerpoint-diagrams-charts/ppt-business-models-diagrams/00571/0/index.html
Supply Chain Management Diagram Set will be perfect choice for presentations on scm, supply chain, logistics, operating costs, management, strategic planing, supply chain planing, etc.
https://poweredtemplate.com/powerpoint-diagrams-charts/ppt-process-diagrams/00568/0/index.html
Spiral chart set will be ideal for illustrate data in presentations dedicated to spiral model, cycling process, spiral process, product development, conceptualization, production, promotion, etc
Process with Gears Chart Toolbox (for PowerPoint and Google Slides)PoweredTemplate.com
https://poweredtemplate.com/powerpoint-diagrams-charts/ppt-process-diagrams/00377/0/index.html
Beautiful template with diagrams which can help for presentations on processes, processes interactions, processes comparison, running processes, business processes, processes dependence, etc.
Enterprise Excellence is Inclusive Excellence.pdfKaiNexus
Enterprise excellence and inclusive excellence are closely linked, and real-world challenges have shown that both are essential to the success of any organization. To achieve enterprise excellence, organizations must focus on improving their operations and processes while creating an inclusive environment that engages everyone. In this interactive session, the facilitator will highlight commonly established business practices and how they limit our ability to engage everyone every day. More importantly, though, participants will likely gain increased awareness of what we can do differently to maximize enterprise excellence through deliberate inclusion.
What is Enterprise Excellence?
Enterprise Excellence is a holistic approach that's aimed at achieving world-class performance across all aspects of the organization.
What might I learn?
A way to engage all in creating Inclusive Excellence. Lessons from the US military and their parallels to the story of Harry Potter. How belt systems and CI teams can destroy inclusive practices. How leadership language invites people to the party. There are three things leaders can do to engage everyone every day: maximizing psychological safety to create environments where folks learn, contribute, and challenge the status quo.
Who might benefit? Anyone and everyone leading folks from the shop floor to top floor.
Dr. William Harvey is a seasoned Operations Leader with extensive experience in chemical processing, manufacturing, and operations management. At Michelman, he currently oversees multiple sites, leading teams in strategic planning and coaching/practicing continuous improvement. William is set to start his eighth year of teaching at the University of Cincinnati where he teaches marketing, finance, and management. William holds various certifications in change management, quality, leadership, operational excellence, team building, and DiSC, among others.
Improving profitability for small businessBen Wann
In this comprehensive presentation, we will explore strategies and practical tips for enhancing profitability in small businesses. Tailored to meet the unique challenges faced by small enterprises, this session covers various aspects that directly impact the bottom line. Attendees will learn how to optimize operational efficiency, manage expenses, and increase revenue through innovative marketing and customer engagement techniques.
Putting the SPARK into Virtual Training.pptxCynthia Clay
This 60-minute webinar, sponsored by Adobe, was delivered for the Training Mag Network. It explored the five elements of SPARK: Storytelling, Purpose, Action, Relationships, and Kudos. Knowing how to tell a well-structured story is key to building long-term memory. Stating a clear purpose that doesn't take away from the discovery learning process is critical. Ensuring that people move from theory to practical application is imperative. Creating strong social learning is the key to commitment and engagement. Validating and affirming participants' comments is the way to create a positive learning environment.
Discover the innovative and creative projects that highlight my journey throu...dylandmeas
Discover the innovative and creative projects that highlight my journey through Full Sail University. Below, you’ll find a collection of my work showcasing my skills and expertise in digital marketing, event planning, and media production.
Unveiling the Secrets How Does Generative AI Work.pdfSam H
At its core, generative artificial intelligence relies on the concept of generative models, which serve as engines that churn out entirely new data resembling their training data. It is like a sculptor who has studied so many forms found in nature and then uses this knowledge to create sculptures from his imagination that have never been seen before anywhere else. If taken to cyberspace, gans work almost the same way.
The world of search engine optimization (SEO) is buzzing with discussions after Google confirmed that around 2,500 leaked internal documents related to its Search feature are indeed authentic. The revelation has sparked significant concerns within the SEO community. The leaked documents were initially reported by SEO experts Rand Fishkin and Mike King, igniting widespread analysis and discourse. For More Info:- https://news.arihantwebtech.com/search-disrupted-googles-leaked-documents-rock-the-seo-world/
Digital Transformation and IT Strategy Toolkit and TemplatesAurelien Domont, MBA
This Digital Transformation and IT Strategy Toolkit was created by ex-McKinsey, Deloitte and BCG Management Consultants, after more than 5,000 hours of work. It is considered the world's best & most comprehensive Digital Transformation and IT Strategy Toolkit. It includes all the Frameworks, Best Practices & Templates required to successfully undertake the Digital Transformation of your organization and define a robust IT Strategy.
Editable Toolkit to help you reuse our content: 700 Powerpoint slides | 35 Excel sheets | 84 minutes of Video training
This PowerPoint presentation is only a small preview of our Toolkits. For more details, visit www.domontconsulting.com
Personal Brand Statement:
As an Army veteran dedicated to lifelong learning, I bring a disciplined, strategic mindset to my pursuits. I am constantly expanding my knowledge to innovate and lead effectively. My journey is driven by a commitment to excellence, and to make a meaningful impact in the world.
What are the main advantages of using HR recruiter services.pdfHumanResourceDimensi1
HR recruiter services offer top talents to companies according to their specific needs. They handle all recruitment tasks from job posting to onboarding and help companies concentrate on their business growth. With their expertise and years of experience, they streamline the hiring process and save time and resources for the company.
Cracking the Workplace Discipline Code Main.pptxWorkforce Group
Cultivating and maintaining discipline within teams is a critical differentiator for successful organisations.
Forward-thinking leaders and business managers understand the impact that discipline has on organisational success. A disciplined workforce operates with clarity, focus, and a shared understanding of expectations, ultimately driving better results, optimising productivity, and facilitating seamless collaboration.
Although discipline is not a one-size-fits-all approach, it can help create a work environment that encourages personal growth and accountability rather than solely relying on punitive measures.
In this deck, you will learn the significance of workplace discipline for organisational success. You’ll also learn
• Four (4) workplace discipline methods you should consider
• The best and most practical approach to implementing workplace discipline.
• Three (3) key tips to maintain a disciplined workplace.
Kseniya Leshchenko: Shared development support service model as the way to ma...Lviv Startup Club
Kseniya Leshchenko: Shared development support service model as the way to make small projects with small budgets profitable for the company (UA)
Kyiv PMDay 2024 Summer
Website – www.pmday.org
Youtube – https://www.youtube.com/startuplviv
FB – https://www.facebook.com/pmdayconference
"𝑩𝑬𝑮𝑼𝑵 𝑾𝑰𝑻𝑯 𝑻𝑱 𝑰𝑺 𝑯𝑨𝑳𝑭 𝑫𝑶𝑵𝑬"
𝐓𝐉 𝐂𝐨𝐦𝐬 (𝐓𝐉 𝐂𝐨𝐦𝐦𝐮𝐧𝐢𝐜𝐚𝐭𝐢𝐨𝐧𝐬) is a professional event agency that includes experts in the event-organizing market in Vietnam, Korea, and ASEAN countries. We provide unlimited types of events from Music concerts, Fan meetings, and Culture festivals to Corporate events, Internal company events, Golf tournaments, MICE events, and Exhibitions.
𝐓𝐉 𝐂𝐨𝐦𝐬 provides unlimited package services including such as Event organizing, Event planning, Event production, Manpower, PR marketing, Design 2D/3D, VIP protocols, Interpreter agency, etc.
Sports events - Golf competitions/billiards competitions/company sports events: dynamic and challenging
⭐ 𝐅𝐞𝐚𝐭𝐮𝐫𝐞𝐝 𝐩𝐫𝐨𝐣𝐞𝐜𝐭𝐬:
➢ 2024 BAEKHYUN [Lonsdaleite] IN HO CHI MINH
➢ SUPER JUNIOR-L.S.S. THE SHOW : Th3ee Guys in HO CHI MINH
➢FreenBecky 1st Fan Meeting in Vietnam
➢CHILDREN ART EXHIBITION 2024: BEYOND BARRIERS
➢ WOW K-Music Festival 2023
➢ Winner [CROSS] Tour in HCM
➢ Super Show 9 in HCM with Super Junior
➢ HCMC - Gyeongsangbuk-do Culture and Tourism Festival
➢ Korean Vietnam Partnership - Fair with LG
➢ Korean President visits Samsung Electronics R&D Center
➢ Vietnam Food Expo with Lotte Wellfood
"𝐄𝐯𝐞𝐫𝐲 𝐞𝐯𝐞𝐧𝐭 𝐢𝐬 𝐚 𝐬𝐭𝐨𝐫𝐲, 𝐚 𝐬𝐩𝐞𝐜𝐢𝐚𝐥 𝐣𝐨𝐮𝐫𝐧𝐞𝐲. 𝐖𝐞 𝐚𝐥𝐰𝐚𝐲𝐬 𝐛𝐞𝐥𝐢𝐞𝐯𝐞 𝐭𝐡𝐚𝐭 𝐬𝐡𝐨𝐫𝐭𝐥𝐲 𝐲𝐨𝐮 𝐰𝐢𝐥𝐥 𝐛𝐞 𝐚 𝐩𝐚𝐫𝐭 𝐨𝐟 𝐨𝐮𝐫 𝐬𝐭𝐨𝐫𝐢𝐞𝐬."
RMD24 | Debunking the non-endemic revenue myth Marvin Vacquier Droop | First ...BBPMedia1
Marvin neemt je in deze presentatie mee in de voordelen van non-endemic advertising op retail media netwerken. Hij brengt ook de uitdagingen in beeld die de markt op dit moment heeft op het gebied van retail media voor niet-leveranciers.
Retail media wordt gezien als het nieuwe advertising-medium en ook mediabureaus richten massaal retail media-afdelingen op. Merken die niet in de betreffende winkel liggen staan ook nog niet in de rij om op de retail media netwerken te adverteren. Marvin belicht de uitdagingen die er zijn om echt aansluiting te vinden op die markt van non-endemic advertising.
VAT Registration Outlined In UAE: Benefits and Requirementsuae taxgpt
Vat Registration is a legal obligation for businesses meeting the threshold requirement, helping companies avoid fines and ramifications. Contact now!
https://viralsocialtrends.com/vat-registration-outlined-in-uae/
LA HUG - Video Testimonials with Chynna Morgan - June 2024Lital Barkan
Have you ever heard that user-generated content or video testimonials can take your brand to the next level? We will explore how you can effectively use video testimonials to leverage and boost your sales, content strategy, and increase your CRM data.🤯
We will dig deeper into:
1. How to capture video testimonials that convert from your audience 🎥
2. How to leverage your testimonials to boost your sales 💲
3. How you can capture more CRM data to understand your audience better through video testimonials. 📊
LA HUG - Video Testimonials with Chynna Morgan - June 2024
Stage Shapes (for PowerPoint and Google Slides)
1. PROCESS CHARTS
A
B
C
D
Example text.
Go ahead and replace it with
your own text. Go ahead and
replace it with your own text.
This is an example text.
Go ahead and replace it with
your own text. This is an
example text.
Go ahead and replace it with
your own text. Go ahead and
replace it with your own text.
Go ahead and replace it with
your own text.
This is an example text.
Go ahead and replace it with
your own text. This is an
example text.
Go ahead and replace it with
your own text. Go ahead and
replace it with your own text.
Go ahead and replace it with
your own text.
This is an example text.
Go ahead and replace it with
your own text. This is an
example text.
Go ahead and replace it with
your own text. Go ahead and
replace it with your own text.
Go ahead and replace it with
your own text.
This is an example text.
Go ahead and replace it with
your own text. This is an
example text.
Go ahead and replace it with
your own text. Go ahead and
replace it with your own text.
Go ahead and replace it with
your own text.
2. PROCESS CHARTS
A
B
C
D
Example text.
Go ahead and replace it with
your own text. Go ahead and
replace it with your own text.
This is an example text.
Go ahead and replace it with
your own text. This is an
example text.
Go ahead and replace it with
your own text. Go ahead and
replace it with your own text.
Go ahead and replace it with
your own text.
This is an example text.
Go ahead and replace it with
your own text. This is an
example text.
Go ahead and replace it with
your own text. Go ahead and
replace it with your own text.
Go ahead and replace it with
your own text.
This is an example text.
Go ahead and replace it with
your own text. This is an
example text.
Go ahead and replace it with
your own text. Go ahead and
replace it with your own text.
Go ahead and replace it with
your own text.
This is an example text.
Go ahead and replace it with
your own text. This is an
example text.
Go ahead and replace it with
your own text. Go ahead and
replace it with your own text.
Go ahead and replace it with
your own text.
3. PROCESS CHARTS
A
B
C
D
Example text.
Go ahead and replace it with
your own text. Go ahead and
replace it with your own text.
This is an example text.
Go ahead and replace it with
your own text. This is an
example text.
Go ahead and replace it with
your own text. Go ahead and
replace it with your own text.
Go ahead and replace it with
your own text.
This is an example text.
Go ahead and replace it with
your own text. This is an
example text.
Go ahead and replace it with
your own text. Go ahead and
replace it with your own text.
Go ahead and replace it with
your own text.
This is an example text.
Go ahead and replace it with
your own text. This is an
example text.
Go ahead and replace it with
your own text. Go ahead and
replace it with your own text.
Go ahead and replace it with
your own text.
This is an example text.
Go ahead and replace it with
your own text. This is an
example text.
Go ahead and replace it with
your own text. Go ahead and
replace it with your own text.
Go ahead and replace it with
your own text.
4. PROCESS CHARTS
A
B
C
D
Example text.
Go ahead and replace it with
your own text. Go ahead and
replace it with your own text.
This is an example text.
Go ahead and replace it with
your own text. This is an
example text.
Go ahead and replace it with
your own text. Go ahead and
replace it with your own text.
Go ahead and replace it with
your own text.
This is an example text.
Go ahead and replace it with
your own text. This is an
example text.
Go ahead and replace it with
your own text. Go ahead and
replace it with your own text.
Go ahead and replace it with
your own text.
This is an example text.
Go ahead and replace it with
your own text. This is an
example text.
Go ahead and replace it with
your own text. Go ahead and
replace it with your own text.
Go ahead and replace it with
your own text.
This is an example text.
Go ahead and replace it with
your own text. This is an
example text.
Go ahead and replace it with
your own text. Go ahead and
replace it with your own text.
Go ahead and replace it with
your own text.
5. PROCESS CHARTS
A
B
C
D
Example text.
Go ahead and replace it with
your own text. Go ahead and
replace it with your own text.
This is an example text.
Go ahead and replace it with
your own text. This is an
example text.
Go ahead and replace it with
your own text. Go ahead and
replace it with your own text.
Go ahead and replace it with
your own text.
This is an example text.
Go ahead and replace it with
your own text. This is an
example text.
Go ahead and replace it with
your own text. Go ahead and
replace it with your own text.
Go ahead and replace it with
your own text.
This is an example text.
Go ahead and replace it with
your own text. This is an
example text.
Go ahead and replace it with
your own text. Go ahead and
replace it with your own text.
Go ahead and replace it with
your own text.
This is an example text.
Go ahead and replace it with
your own text. This is an
example text.
Go ahead and replace it with
your own text. Go ahead and
replace it with your own text.
Go ahead and replace it with
your own text.
6. PROCESS CHARTS
A
B
C
D
Example text.
Go ahead and replace it with
your own text. Go ahead and
replace it with your own text.
This is an example text.
Go ahead and replace it with
your own text. This is an
example text.
Go ahead and replace it with
your own text. Go ahead and
replace it with your own text.
Go ahead and replace it with
your own text.
This is an example text.
Go ahead and replace it with
your own text. This is an
example text.
Go ahead and replace it with
your own text. Go ahead and
replace it with your own text.
Go ahead and replace it with
your own text.
This is an example text.
Go ahead and replace it with
your own text. This is an
example text.
Go ahead and replace it with
your own text. Go ahead and
replace it with your own text.
Go ahead and replace it with
your own text.
This is an example text.
Go ahead and replace it with
your own text. This is an
example text.
Go ahead and replace it with
your own text. Go ahead and
replace it with your own text.
Go ahead and replace it with
your own text.
7. PROCESS CHARTS
A
B
C
D
This is an example text.
Go ahead and replace it with your own
text. This is an example text.
Go ahead and replace it with your own
text. Go ahead and replace it with your
own text.
This is an example text.
Go ahead and replace it with your own
text. This is an example text.
Go ahead and replace it with your own
text. Go ahead and replace it with your
own text.
This is an example text.
Go ahead and replace it with your own
text. This is an example text.
Go ahead and replace it with your own
text. Go ahead and replace it with your
own text.
This is an example text.
Go ahead and replace it with your own
text. This is an example text.
Go ahead and replace it with your own
text. Go ahead and replace it with your
own text.
8. PROCESS CHARTS
A
B
C
D
This is an example text.
Go ahead and replace it with your own text. This is an
example text.
Go ahead and replace it with your own text. Go ahead
and replace it with your own text.
This is an example text.
Go ahead and replace it with your own text. This is an
example text.
Go ahead and replace it with your own text. Go ahead
and replace it with your own text.
This is an example text.
Go ahead and replace it with your own text. This is an
example text.
Go ahead and replace it with your own text. Go ahead
and replace it with your own text.
This is an example text.
Go ahead and replace it with your own text. This is an
example text.
Go ahead and replace it with your own text. Go ahead
and replace it with your own text.
This is an example text.
Go ahead and replace it with your own text. Go ahead and
replace it with your own text. This is an example text.
9. PROCESS CHARTS
A
B
C
D
Example text.
Go ahead and replace it with
your own text. Go ahead and
replace it with your own text.
This is an example text.
Go ahead and replace it with
your own text. This is an
example text.
Go ahead and replace it with
your own text. Go ahead and
replace it with your own text.
Go ahead and replace it with
your own text.
This is an example text.
Go ahead and replace it with
your own text. This is an
example text.
Go ahead and replace it with
your own text. Go ahead and
replace it with your own text.
Go ahead and replace it with
your own text.
This is an example text.
Go ahead and replace it with
your own text. This is an
example text.
Go ahead and replace it with
your own text. Go ahead and
replace it with your own text.
Go ahead and replace it with
your own text.
This is an example text.
Go ahead and replace it with
your own text. This is an
example text.
Go ahead and replace it with
your own text. Go ahead and
replace it with your own text.
Go ahead and replace it with
your own text.
10. PROCESS CHARTS
A
B
C
D
This is an example text.
Go ahead and replace it with your own text. This is an
example text.
Go ahead and replace it with your own text. Go ahead
and replace it with your own text.
This is an example text.
Go ahead and replace it with your own text. This is an
example text.
Go ahead and replace it with your own text. Go ahead
and replace it with your own text.
This is an example text.
Go ahead and replace it with your own text. This is an
example text.
Go ahead and replace it with your own text. Go ahead
and replace it with your own text.
This is an example text.
Go ahead and replace it with your own text. This is an
example text.
Go ahead and replace it with your own text. Go ahead
and replace it with your own text.
This is an example text.
Go ahead and replace it with your own text. Go ahead and
replace it with your own text. This is an example text.