A Review of Criteria of Fit for Hydrological Models
Arizona Stream Chemistry
1. COVERAGE,APPROACH,AND‘DELIVERABLES’SUMMARY
Thisprojectbeganwitha chance observationof some interestingchemistryata site onthe Colorado
River. One thingledtoanotherand ithas grownwithtime intoa fairly comprehensivesurveyof Arizona
streamchemistry. The approachusedhere is‘integrated’and presentsadifferentwayof lookingat
data inthe ADEQ WaterQualityDatabase.The hope isthat the information gatheredwillleadtoa
betterunderstandingof the dynamicsof Arizonastreamchemistry.
The projectdevelopedinseveral stages. The firstwascreatingthe toolsforan integratedapproach.
The secondwas to produce ‘profiles’of site chemistryusing average valuesforanumberof Arizona
streams.The thirdwas to add the capabilitiesof USGSgeochemical modellingprograms. Fourth,the
modellingprogramswere usedtogenerate more detailedviewsof some of the same sitesforwhich
profileshadbeenmade. Finally,toolswere createdthatallow forthe rapidcharacterizationand
depictionof streamchemistry.
An integratedapproachtostreamchemistryinvolvestryingtoachieve a‘complete’pictureof the
systembeingconsidered. The massand charge balance are the basictools. The advantagesof an
integratedapproachare that resultscaneasilybe checkedand differencesraisequestionsthatleadto
furtherinvestigation.The discovery processis,asitwere,self-perpetuating.
The massbalance,forexample,canbe checkedagainstaphysical measurement -- total dissolvedsolids
results. The difference between the twoisa measure of the completenessof the ‘picture’of the
system.The charge balance can use a numberof tests(sevenare usedhere). How manytests the
charge balance passes orfailsgivessome indicationof how wellthe numbersinthe individual analyses
‘fittogether.’ A poorcharge balance indicates only thatthere isaproblemsomewhere inthe ‘complete’
picture beingproduced andgiveslittle ornoindicationwhere thatmayproblemmight be.
Implicitinthe approachisthat all available dataisused.There are some pitfallsaswell asadvantagesto
thisaspect. The profilesproducedare overthe entire periodof recordbutthatmay range from
hundredsof samplesover40 to 50 yearsto five totensamples overa yearor two.In general,siteswith
manysamplesoverlongperiodsof time were favored.
A fewsiteswithlessernumberof samples,however,were alsoused,typicallythose withahistoryof
exceedingwaterqualitystandardsand/ortofill gapsinlong stretchesalongastream.Obviously,some
care has to be usedingeneralizingfromresultsthatwere generatedfromonlyafew samplesovera
short spanof time. Withsuchsites,comparisonwithothermore adequatelycoveredsiteseither
upstreamor downstream,if available,canaidinevaluation.
Some siteshave manysamplesbutnotall the sampleswere ‘complete’analyzes.Inthisstudy,generally
onlysampleswithall the majorions(Na,Ca,Mg, Cl,SO4, HCO3) and at leastsome metalswere used.
These restrictionshave todo bothwiththe methodsand withthe purpose of the study. The ideaisthat
there isan electronicstructure createdbythe majorions(the ‘matrix’) andthatminorconstituentssuch
as metalshave tofit intothisstructure incertainways. Some attemptswere made toextrapolate major
2. ionconcentrationsfrombasicchemical measurementsbutthese were notfoundsatisfactoryandwere
discontinued.
To date,about 100 ‘average’value profileshave beencompleted. Theseprofiles includemassand
charge balance resultsandPiperPlot(software courtesyof UtahUSGS) depictionsof the majorions. As
an aide to navigation,profilesare alwayssavedatthe same place (the PiperPlotonthe ‘results’sheet)
and followasetlayout(describedin‘Intro-howto-metadata’file)
PiperPlotsare particularlygoodat depictingnotonlythe relativepositionof the particular‘mix’of ions
but alsothe variability. Some siteshave mostof the individual sample pointsclusteredtightlyintoa
small area,othershave themina wide swathacrossthe diagram. The firstrepresentswhatmightbe
calledinsome sensesa‘stable’matrix while the secondisamore ‘diffuse’or‘more highlyvariable’
matrix. Some sites,like the ColoradoatLeesFerry,show both – a verydiffuse matrix before 1964 and a
verytightmatrix afterwards. Forthe mostpart, however,the average value profilesare static,
representing a‘snapshot’of the systemoverthe entire periodof record.
The resultsof these profilesare depictedinaseriesof about35 GIS mapsand associatedfiles. Thirteen
of the mapsare statewide depictionsof the variouswatermatrix compositionsand groupingsof
interest. The mainmap,labelledAZwatermatrix,unfortunatelyhadtobe divided into4partsdue to size
limitations. The ‘composition’mapsshow the matrix compositionsatabout16 sites,representing9of
the major streamsaroundthe state (1-3 samplesalongthe Colorado,Bill Williams,AguaFria,Verde,
Gila,Salt,Santa Cruz,San Pedroand Little Colorado)
‘Composition1”usesapie chart depictionof the charge percentsof the majorionswhile ‘Composition2’
usessymbolsproportionaltosize. ‘Confidence’and‘variability’mapsgive chartdepictionsof the mass
and charge balance resultsandsome measurementsof the variabilityshowninthe PiperPlot.Ideally,
confidence andvariabilityinformationshouldbe presentedalongside composition.
Othermaps inthe statewide sectiondepictadditional,associatedinformation. Three mapstermed
‘AZhotspots’show the locationsof waterqualityexceedances atprofiledsites intermsof numberof
parametersexceeding, magnitude of exceedances,and maximumvalues(regardlessof exceedance
status).There are also two maps showingareasof high or low solidsproduction. One mapand an Excel
file categorize matrix compositionsintermsof dominantanionsandcations (alkalinityandhardness
types).
Finallytwofiles,one mapandone Excel file,are the resultof alargelyabortive attempttofindevidence
of ‘transition’or‘mixing’ zonesatthe variousexceedance ‘hotspots’ aroundthe state. Many‘hotspots’
do occur at the junctionof differentwatermatricesbutactuallyseeingthe resultsof mixingdemands
that justthe right flowsandconcentrationsexistandlast longenoughtogatherenoughdatato see
them. ‘Mixing’of some sortoccurs, of course,everytime atributaryflowsintoa streambutunlessthe
flowsare highand/orthe concentrationsverydissimilarthere maybe littleorno concentration
response.
3. The rest of the 35 mapsare locatedina subfoldercalled‘MajorStreams’. Here the 9 streamsplusthe
Hassayampaare shownonindividual mapswithcomposition,confidence andvariabilityall shownon
the same map. Sitesare labellednotonlywiththe name butalsowiththe numberof samplesandyears
coveredincludedinparentheses. ‘GilaatGillespieDam(385/42)’indicatesthe site has385 (complete)
analysesoveraperiodof 42 years, while ‘GilaatBuckeye Canal(6/1)’,thrown intohelpcoverthe long
stretchbetweenGillespieandKelvin,hasonly6complete analysesover1year(Fortunatelythe results
are perfectlyconsistentwithKelvinandGillespie.) Some of the tributariestothe Gila,QueenCreekand
the San Carlos,however,have few samplesbuthave widelydifferentcompositionsfromthe Gila. Both
showlowervariance than the Gilabut have poor charge balance results. How muchtheycontribute to
the Gila woulddependonflowsandrelative concentrations.
As the profilesapproachedcompletion,workbeganinvestigatingthe use of USGSgeochemical
modellingprograms. Twoprograms,WATEQ4F and PHREEQC,were used. WATEQ4F isan older
program,somewhatlimitedinoutputandusingdifferentassumptionsthanPHREEQC. Both programs
dependonan underlyingdatabase of thermodynamicdata (standardenthalpies). Whatthe programs
offerisa quickway of doingdifficult,iterative ‘bestfit’calculationstogetspeciation,activity,and
solubility frompHand redox data.While handy,these programscome withassumptionsandthere is
some riskintheiruse (see theoretical considerationsbelow)
To date,twentythree profiles coveringfourteenstreams have beenredoneusingthe programs. The
filesare labelledwith‘grab’atthe endof the file name andthe elementsexaminedindetail in
parentheses(usuallyFe andCu). The analysisinthese profilesislimitedtoaverage valuesandplaced
nextto the earliervalues(PiperPlot) forcomparison.Inadditiontothe charge percentcomposition pie
charts, however,are cationandanionspeciation,activityandsolubilitychartsaswell asall metal s and
predominantmetalsactivitiesandsolubilities. Resultsare linedupbyprogramfromleftto right,
WATEQ4F, PHREEQC withitsowndatabase,and PHREEQC withthe more extensive LawrenceLivermore
database. Resultswere generallyfairlysimilarforall three programsandall were usuallywithin1-4%of
earliercalculations.
Once some confidence hadbeenbuiltupwiththe average values,workbeganongettingamore
detailedviewof the variousmatrices. Toolswere developedtogenerate graphsandcorrelation
matricesfromdata on the ‘output2’sheetof the ‘grab’profiles. The ‘output2’sheethasdatagrouped
and organizedinsetlocationsmakingitveryeasytopickout data byelement,analysistype (speciation,
concentration(activity) orsolubility),andanindependent(x) variablesuchasdate,pH or conductivity(or
anotherelement).Virtuallyanythingcanbe plottedorcorrelatedwithanythingelse(thoughthe
programshave not been checkedforeverypossible combinationsothere are occasional hangupsand
snafus)
The ideahere isto give as manyperspectivesaspossible onthe system. Several graphtemplateswere
developedcomparingmatrix parametersagainstbasicmeasurementandeachother. The most used
template haspH,flowandconductivityand‘massflux’chartsacross the topof the sheetwithdifferent
matrix parametersfollowingbelow. The ideaistolookat conductivity, flow,andpH‘events’andthen
4. checkthe chemistryatthe same pointsto see if there appearstobe any response. Matrix parameters
are alsoexaminedagainsteachothertosee if there are anypatterns.
Because correlations canbe chance,one-time events(coincidental) andpatternsmayneeddifferent
time spansto become visible,mapsandcorrelationscanbe generatedusingdifferenttime frames.
Maps were usuallygeneratedwith‘all’data,whichare mostlyuselessforanalysisdue to toomany
pointstosee anything, butoccasionallyshow patternsnotseeninfinerdetail,andyearlyincrements.
Correlationswere usuallydoneoverthe periodof record,largelytoverifyif seemingcorrelations
spottedongraphs hadany general validity,butcanalsobe done forany time frame of interest. One
program runscorrelationsof one parameteragainstanynumberof otherparametersona yearlybasis
and itis interestingtosee thatcorrelationscancome and go overtime (thoughhardto judge what
significance thismayhave)
To date,14 ‘matrix’studieshave beencompletedonfourstreams(Gila,Salt,ColoradoandSantaCruz).
Whenfirstbegun,the studiestookseveral daysbutrefinementshave reducedthe time to2-3hours.
One sheetof mapsis producedusinggraphingprograms,thenthe entire sheetiscopiedandanother
program usedtochange the dateson all the graphsof the new sheet. IN thisway,annual graphs
covering20-30 yearscan be producedveryquickly. Correlationmatriceswere developedand rowand
columnheaderscopiedtoproduce the nextfilescorrelations.
The resultsof these studiesare examinedbelow butfirstafew considerationsof some of the risks
involvedinthistype of analysisare necessary.
THEORETICAL CONSIDERATIONS
The USGS programstake the ‘total’analysesof the database andworkout the variouscompoundsthat
are mostlikelytoexistata givenpHand redox potential.The majorions,particularlyNa,Cl andSO4, are
predominantlyintheirionicform.NaasNa and Cl as Cl, forexample,are almostalwaysnearly100%
(Na/Na,Cl/Cl ~100%, SO4/SO4 istypically60-80%) Ca, Mg, andHCO3 oftenexistincompoundssuchas
CaHCO3, CaSO4 etc.
PO4 existsinsmall amountsasPO4,is mostcommonlyfoundasHPO4 and formscompoundsprimarily
withothermajorionsand iron.What thismeansisthat, if PO4 has anyeffecton free metal
concentrations,ithasto be an indirectone,possiblythroughalowerlevelcompetitionwithOHand
CO3, and to a lesserextentSandSO4, for major cations.
Ultimately,the wholeanalysisdependsonLaChateliersprinciple (asystemunderastresswill move to
relieve thatstress) anditsparticularformappropriate togeochemicalsystems,the law of massaction.
These principles positthatif tworeactantscome intocontact in a closedsystemthere isatendencyfor
themto forma product(time notspecified). Eachsetof reactantsform productup to a setamount
specifictothe system,atwhichtime the ‘stress’onthe systemreversesdirectiontowarddissolutionof
the product back intoreactants. At thispointthe system hasreached whatistermed‘equilibrium’
whichisdefinedas the reactiontowardcreationof productbeing equal tothat towarddissolution. The
5. equilibriumistermeddynamicinthat the concentrations,while alwaysfluctuatingslightly,appear
unchangingbecause there isnooverall movementineitherdirection.
Equilibriumsituationsare mosteasilyanalyzed inlabbeakers. Saysmall amountsof soluble CaandSO4
compounds(CaNO3and NaSO4 wouldprobablydo) are placedina beakerof DI wateron a lab bench
(thatis,withno analyzable inputsof massorheat). The compoundswill dissolvealmostinstantlyand
veryquicklyCaSO4will begintoform. Firstthere wouldbe a tendencyfor Caand SO4 ionsto associate,
thensome pairswouldbegintoformmolecularbonds,finallyif conditionsare right,CaSO4wouldbegin
to precipitate outof solution.
Ca + SO4 [CaSO4] (CaSO4 aq
Here a couple of potential problemscropup. What the programsfind,asfar as I know, are the
associatedionsorso called‘ionpairs’notactual molecularspecies. Ionpairsare describedasgroupings
of ionsthatare heldtogetherbyveryweakforces(coulombicinteractions)as opposedtothe stronger
bondsof actual molecules. Whethertheyare,ingeneral,strongenoughtowithstandthe forcesof
filtrationisnotknown(atleastby me) so whethertheywouldbe inthe dissolvedorthe total analysis
portionisnot clear. In these analysisdissolveddatawasusedwheneverpossible unlesstotal was
specified(WATEQ4Fspecifiestotal Fe).The rationale here isthatthe suspendedsolidportion,which
includeslargelyunchargedparticles,doesnot figure directlyintothe electronicstructure.
Evenmore significant,however,isthat equilibriumis,Ibelieve,generallyconsideredasbetween
reactantsand (molecular) products. There mayalsobe anequilibriumbetweenreactantsandionpairs
but itmightbe verydifficulttoanalyze. IFthere isnomolecularproductthere isnoequilibriumand
resultsmaybe “misleading,’accordingtoone authority(Hems).
Of course,the whole conceptof equilibriumisnotquite appropriateforreal worldsystemseither.
Natural systemsare usually not‘closed’toinputsof massand/orheat. The CaSO4 reactionthatoccurs
inseconds ina beaker,apparentlylasted overaperiodof eightmonthsonBoulderCreek (atleastif
increasedionpairformationisanyindication andpredictedprecipitation). The term‘steadystate’is
usedto describe opensystemsinwhichinputsof massandheatare assimilatedinafashionthatmimics
equilibrium.
But while mostof usare happyenoughtoset aside the whole notionof ‘equilibrium’as‘theoretical’and
use the resultinginformationbasedonitsassumptiontosolve problems,there are otherdifficulties.
Evenin the case of Ca and SO4 ina beaker,the resultsmightbe verydifferentif acompetingionwere
present. We relyonthe programto sort out these competingrelationshipsbutthe programscan only
use the informationwe give themandthe informationinthe underlyingdatabase. Typically‘modelling’
meansthat a givensystemisanalyzedtoinclude all the parametersthatare involvedandthe underlying
database ischeckedforboth internal consistencyandrelevance tothe system. Where appropriate,the
informationinthe database mayneedtobe changedor addedto. None of thatwas done here.
Insteadthe programswere usedwithverylittle ‘tweaking’ toinvestigatethe watersystems notbecause
thisisthe bestwayto do it butbecause of lack of knowledge onthe userspart(i.e.me!). Atfirst,the
6. inputswere limitedtoaverage valuesandcomparedtothe profilesgeneratedusingsimplymethods.
Usuallythe activitiesderivedfromthe programswere within 1-4percentof the concentrations(even
thoughthe two are not the same). The redox potential wassettothat of the H20/O2 pair – that isfor
full saturation. This‘dominant’pairassumptionishotlydebatedingroundwaterstudiesbut accepted
(Fraseretal.) and probablyo.k. forthe typicallymore homogeneoussurface watersample.
The underlyingdatabaseswerenotexaminedforconsistency,completenessorrelevance thoughthey
probablyshouldhave been. Instead,the resultswere evaluatedagainstgenerallyacceptedfindings. For
example,PHREEQChastwodatabasesthatcan be pluggedin,one comeswiththe programand the
otheris a compilationfrom the Lawrence Livermore Laboratories. The latter isa verycomplete setof
data but some valuesmayhave beenderivedinveryspecificcircumstances. Usingthe Lawrence
Livermore dataset onColoradoRiverwateryielded the findingthatCuCO3was the mostcommon form
of copper,while WATEQ4FandPHREEQC datasetsagree withthe more generallyacceptedfindingthat
Cu(OH)2, ismore common. The Lawrence Livermore datasetwasusedbutmore fora ‘whatif’
comparison.
In some cases,however,the problemsresultingfromnottweakingthe underlyingdatasetto matchthe
systembeinganalyzedmayhave andprobablydidmake the analysesmeaningless. The SantaCruz in
particularseemsalmost‘unanalyzable’,showingverylittle correlationorpatternsamongthe majorions,
but that maybe because,historically,there hasbeenasignificantconcentrationof ammoniaandthe
programshave ammonia‘uncoupled’fromotherreactions.Thisisanarea where furtherworkis
definitelyneeded.
FINDINGS.
Thisprojectbeganwiththe chance notice of some interestingchemistry inthe ADEQsurface water
database forthe ColoradoRiveratMorelos. Sulfate typicallyrunsabouta100 mg/L higherthan
bicarbonate atthissite but in1992, sulfate concentrationsdippedbelow bicarbonate. The situation
persistedforalmostayear,fromDec. 1992 to Dec 1993. Sucha change inone of the fundamental
constituentsoversuchalongperiodof time seemedsignificant.
The nextstepoccurredsometime laterwhenmetalsatthe same site were beingexamined.Plotting a
numberof metals,scaledtoappearinthe same part of the chart, vstime,reveals thatmetals
concentrationsgoupand downin a regularpatternwitha periodof about5-7 years. But there are also
several pointsalongthe graph (nodes) where somethingdifferentseemstobe goingon. One of these
pointsturnsout to be Dec 1992- Dec 1993.
The metalsinthisperiod seemtobe movinginunisonina patternsomewhatdifferentfromthe overall
pattern. Removinganymetalsthatdonot have at leasttwopointswithinthe time frame of interest,
yieldsthe followingpicture.
7. Obviouslythis periodwouldbe eitheravery ‘good’or a very‘bad’time todo metalssampling
dependingonones’purpose. One mightbe temptedtolabel the periodas‘upset’inageneral sense
and leave itat that.But such a correlatedmovementraisesthe questionof whatmightbe the cause.
The reasonfor the above phenomenonremainedamystery forsome time.Then anexaminationof
flowsrevealedthatthe period1992-1993 wasone of those timeswhen majorflows onthe Gilacausedit
to flowall the wayto the Colorado.The movementinthe metalsis,apparently,the resultof mixingof
twoverydifferentwaters. The Gilaishighinsodiumandchloride whereasthe predominantcationand
anioninthe Coloradocharge structure are sodiumand sulfate. Whatwe seemtobe seeingare the
metalsadjustingfromtheirpositioninthe Coloradomatrix tothatinthe Gilamatrix andthenslowly
returningasGila flowtapersoff.
A searchwas made for similarpatternsof mixing atother‘transition’zonesbetweendifferentmatrices
aroundthe state.Veryfewexampleswere foundprobablybecause,while somemixingoccursevery
time a tributaryentersa stream,flow,concentrationandtime spanneedtobe justrightto actuallysee
a concentrationresponse (most‘grab’samplesare takenamonthapart – for that reasonthe mixing
needstogo on foralmosta yearas here)
Havingreachedsomethingof adeadend,focuschangedto examiningthe twomatricesinvolved. The
Gila,like the restof the south or westflowingstreamsexamined(Colorado,Gila,Salt,Verde) gainsin
sulfate asit progresses. (Northflowingstreams(SantaCruz,SanPedroandLittle Colorado) gaininCl.)
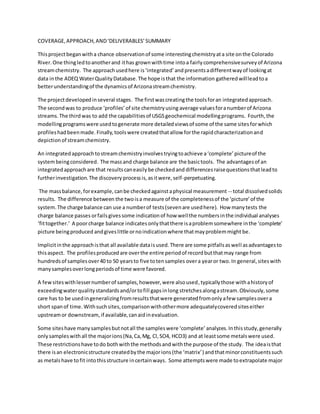
Correlations - elevated flows from Gila
0
100
200
300
400
500
600
700
9/19/91 4/6/92 10/23/92 5/11/93 11/27/93 6/15/94 1/1/95 7/20/95
date
units
SULFATE, TOTAL (MG/L AS SO4)
CALCIU x 4.48 + -99.12
MAGNES x 12.49 + -86.67
SODIUM x 1.96 + 8.37
POTASS x 75.57 + -86.88
BORON, x 1182.90 + 63.40
ARSENI x 41684.85 + 185.38
MANGAN x 4930.23 + 233.11
COPPER x 44421.93 + 218.25
BARIUM x 4337.11 + -98.62
12/92 to 12/933-6/92
12/94-8/95
8. More significantly,relationshipsbetweenthe majorionschange withelevationasthe Gila proceeds.
The Gila at Saffordshowsthe original matrix mostclearlywhile Gillespie andDome show the same
patternbut withadditional thingsgoingon.
At Safford the majorionconcentrations(activities) are highlycorrelatedwitheachotherwiththe
exceptionof bicarbonate. Inthe following ‘correlation matrix’thatcoversthe periodof record,high
correlation(>.90) isin lightmagentawhile some correlation(>.75,<.89) isinlightblue.
Safford
concentration Ca Mg Na Cl SO4 HCO3
Ca 1 0.953973 0.881617 0.879023 0.833019 0.298355
Mg 0.953973 1 0.934212 0.930191 0.919909 0.163743
Na 0.881617 0.934212 1 0.996687 0.959978 0.215696
Cl 0.879023 0.930191 0.996687 1 0.95163 0.182205
SO4 0.833019 0.919909 0.959978 0.95163 1 0.164268
HCO3 0.298355 0.163743 0.215696 0.182205 0.164268 1
The highcorrelation isimmediatelyapparentin graphsof majorionconcentrations.
Comparingthe upand downof the concentrationswithflow andconductivityrevealsthat the response
isto two differenttypesof eventswhichare dubbed‘dilution’and‘concentration’events(though
9. concentrationtendstobe less(singular) eventsthanextendedperiods).Inadilutioneventflow goesup
while conductivity(standinginforconcentration)goesdown, whileinaconcentrationeventflow goes
downand conductivity goesup.
Notall flow/concentrationeventscanbe labelleddilutionorconcentration.Instancesof flow and
conductivitybothrisingare dubbed‘influx’whilebothdroppingare called ‘outflux.’ (Note thisisapoint
to pointevaluationwithpointstypicallyamonthapart) Of the 160 samplesat Safford,79 were
concentrationand 61 were dilution(49and38% respectively) Only9were labelled ‘influx’and12
‘outflux’ (6&8%).
‘Influx’ishypothesizedtobe an inflowof higherconcentrationwatersuchasmightoccur withan inflow
of groundwaterorag returns. ‘Outflux’mightbe aneventsimilartoinfiltration,waterpercolating
throughsoil andlosingsome of itssolidscontent.These eventsare hardertovisualize asphysical
phenomena(particularly‘outflux’) andmayinsome casesactuallybe errorsin designation.Asa check,
conductivitymaybe comparedtoTDS andADEQ flows(grabs) toUSGS flows(means).If the twodonot
agree indirection,thenthe designation maybe erroneousdue toabad conductivityorflow read. In
general,the simpledilution/concentrationmodel seemsappropriateabout90-95% of the time.Of the
influx andoutflux designationsmostwere foundtobe problematic,so5-10% iseithererroror actual
influx oroutlflux.
The concentrationresponse atSafford todilutionandconcentrationevents inthe same time framesas
the graphs above isclear.
10. All the concentrations,withthe possibleexceptionof bicarbonate,godownat a dilutioneventandupat
a concentrationevent. The dropinsodiumandchloride isproportionallygreaterthanthatof calcium(or
bicarbonate whenitdrops). The resultisthatcharge%, a functionof concentrationbutas a percent
sensitivetorelative change, goesdown forsodiumandchloride goeswhile calciumandbicarbonate go
up. Thismeansthat the majorcharge carrierscan change fromsodiumandchloride tocalciumand
bicarbonate. Thisistermeda ‘matrix inversionandisclearlyseeninthe graph of charge onthe left
(dilution event-same yearasabove dilutiongraph). The significance of the matrix inversionisnot
knownbutone suspectsitmightbe a ‘trigger’forbiological activity.
Note here thata differenttype of charge% calculationisused: molese (molesof electrons).Charge%,as
usedinthe USGS programs, dividesmolesof plusorminus species bythe total plusorminusmoles,
molese multipliesmolesby charge,ionicitymultiplies molesbycharge squared. Charge% emphasizes
the effectof relative concentrations,molese isclosesttothe contributiontoconductivity,while
iconicityemphasizesthe charge.Graphsof all three show onlyslight,expected variations–whichisused
dependsonfocusandinterest.
Several more graphsshow variationsinhow charge respondstodilutionevents.
11. Charge response dependsonthe extentof flow/concentration droporrise and the numberof data
pointsoverwhichthe eventisspread.Single pointeventsappearsharplydefinedwhile multiplepoint
eventsare flattenedoutregardlessof relative drop/rise magnitudes.
The dynamicbetweensodium-chloride andcalcium-bicarbonate charge isstrikinglyrevealedinthe
followingmatrix.Sodiumandchloride are stronglycorrelatedtoeachotherand negativelycorrelatedto
calciumand bicarbonate.
Safford
molse Ca Mg Na Cl SO4 HCO3
Ca 1 0.869854 -0.93593 -0.8688 0.241483 0.852654
Mg 0.869854 1 -0.89957 -0.83721 0.437799 0.813541
Na -0.93593 -0.89957 1 0.930656 -0.29567 -0.90326
Cl -0.8688 -0.83721 0.930656 1 -0.35323 -0.97398
SO4 0.241483 0.437799 -0.29567 -0.35323 1 0.283348
HCO3 0.852654 0.813541 -0.90326 -0.97398 0.283348 1
The hypothesis hereisthatprecipitationbringsdilute water,definitelylowerinsodiumandchloride
(associatedmore withthe base flow),andmore variable inbicarbonate. Hemsandotherothershave
suggestedthathigherbicarbonate contentinsurface runoff isdue to increasedcontactwithair(CO2)
and vegetation. While bicarbonatecontentmayormay notbe higher,calciumandbicarbonate changes
inconcentrationare invariablyrelativelylowerthanthose of sodiumandchloride.
Note that inthe area of charge,sulfate isnotcorrelatedwiththe otherions,asinconcentration,
bicarbonate isnot. The ionnot correlatedmaybe suspected tobe the one that ‘tipsthe balance’and
determineswhatis‘goingon.’ Tosee how sulfate maybe involvedinthe responsetodilution/
concentrationeventsrequiresadigressiononsulfate chemistry.
Sulfate, like bicarbonate butunlike chloride, hasatendencytoform ionpairswithcationssuchas
calcium,magnesiumandsodium.Formationof sulfate ionpairscanbe seenonspeciationgraphssuch
12. as that for BoulderCreek.The’SO4as SO4’,‘Ca as Ca’. and‘Mg as Mg’ percent go downas CaSO4,
MgSO4 andNaSO4 concentrationsgoup.Formationapparentlyincreasedsteadilyforabout8 months.
Growth isgenerallyexponential,though appearinglinearorlogarithmicattimes,andthe orderof
magnitudesisusually CaSO4, MgSO4,NaSO4. CaSO4 andMgSO4 are unchargedwhile NaSO4hasa
minus1 charge so formationinvolves notonlycompetitionforCa,Mg and, to a lesserextent,Nabut
alsoremovescharge fromthe system.
Thoughthe percentage of sulfate assulfate isdecreasing,sulfateconcentrationsactuallyhave tobe
risingbecause that’s whatispushingformationof the ionpairs.Ionpairformationisself-regulatingin
accord withthe law of mass action (sulfate inputonopensystemwith steadystate approximation).
The above graph showssulfate concentrationinbluewith‘sulfate backcalc’(sulfateplussulfate ionpairs
as sulfate) inred.The divergence of redandblue linesshowsthe accelerating growthof ionpair
concentrations. Ionpairformationcontinues aslongas sulfate concentration are risingand,initself,
servestolowersulfate concentration.Thisistermeda‘deceleration’,the ionpairformationconceived
as acting as a break on the rise of SO4 as SO4. SimilardecelerationsoccurforCa and Mg but verylittle if
13. at all for Na. HCO3 ionpairsseemto functionsimilarlybutwithmore variabilityandatlower
magnitudesinmostwaters. The blue square showswhere CaSO4precipitationisexpected.
ReturningtoSaffordwe can see that,in the original Gilamatrix,sulfateandbicarbonate ionpair
formationdrop indilutioneventsandgrow to a peakduringconcentrationevents. The graphsbelow
(same yearsas earliergraphs (pp.9-11)) show % molese withconcentrationinmg/Lof ionpairs(SO4 IP
= SO4 backcalc mg/L– SO4 as SO4 mg/L)
The suppositionhere isthatthe ionpairformationcompetingforcalciumandmagnesiumcombines
withdecreasing(dilute) surface runoff andre-increasingbase flowtoallow sodiumandchloride toonce
againbecome dominant.The endresultismostclearlyseenbyplottingthe majorionconcentrations
and charge againstconductivity. Here the ‘mediatingeffect’of bicarbonate isclearlyseen,thatof sulfate
ismore indirect,throughionpairformation.
Thispicture isthe Gilamatrix at itsmost clearand the patternsnotedabove show the ‘self-regulating’
mechanismsinvolved. Thislevel of orderamongthe majorionsraisesthe question‘how fardowninthe
structure isorder apparent?’
Unfortunately,minorconstituentmetal andnutrientconcentrationsare nothighly correlatedwiththe
majorion patterns at Safford.Metal concentrationsare infactrelatedtoeach other – that is the whole
pointof the USGS programs.But highcorrelationstendtobe betweendifferentcompoundsof the same
metal. Whetherthere are any correlationsorpatternswithmajorions dependsonthe picture we can
14. construct. The furtherwe go downinthe ‘structure,’the lesscomplete ourpicture is,the more the
‘local’ environmentisdeterminedbyeverythingabove it.
Comparingmetalsconcentrationswiththe dominantanioncharge % indifferentmatricesyieldssome
suggestive plots.Here HCO3and SO4 charge percentsat a numberof differentsitesare plottedagainst
arsenicconcentrations. Higherarsenicconcentrationsseemtoclusterincertainportionsof the graphs.
If the appropriate charge%forthe Verde andColoradoare labelled,itisclearthatthe Verde isina high
concentrationclusterwhilethe Coloradoisnot. Doesthisindicate ahigher‘carryingcapacity’for
arsenicinthe Verde as opposedto Colorado?
Probablynot. It couldjustbe coincidental. The Verde ishigherinarsenicdue togeological formations
and there isno obviouscausal connectionwiththe matrix. A streamdoesnothave a choice inaccepting
or rejectingmaterialsinitspath,insteadithastoadjustto them. If there isanythingtothe ‘carrying
capacity’ideaitprobablyliesinspeciation. Thisargumentdoesnotdomuch forarsenic,which
invariablyexistsasAsO4. But itcouldsalvage the theorybypositingthatcertainspeciesmightmigrate
more readilyintothe suspendedsedimentportioninsome matrices.
The major problemfindingpatternsandcorrelationswithminorconstituentmetalsisthattheyhave a
variable ‘presence.’ (Imaginethe charge % graphs above witheverysecondorthirdpointmissing.)
There isa large element of chance inwhetherminormetalswill be presentandinwhatconcentrations.
Base-flowconcentrationscanbe comparedtohighflow butthistellsusnothingaboutrelations.
Returningtothe Gila matrix at Safford,however,one cansee thatmetalsdo seemto respondtomajor
ionpatterns ina verygeneral way. If all bicarbonate andsulfate species are plotted togetheron
separate chartsand theirmovementrelatedwithflow andpH, trace metal bicarbonate andsulfate
compoundsseemtolargely move inoppositedirectiontothose of majorions.
V V
15. The major ioncompounds, ratherflattenedbythe logscale,atthe top of the graph dipdown at the
dilutionevent,while underneathmany of trace metal compounds are trendingup,thoughnotall in
unison. Hydroxidecompounds,which are primarily metalscompounds,follow the upwardmotion of
bicarbonatesandsulfateswhile phosphates,whichare mostlymajorcationcompounds(exception,
iron),seemtobe variable inresponse (indicatingapossiblebridge betweenthe two systems).
There are a couple more interestingpointsaboutthe above graphs. The firstisthatthe large dilution
flowpeakandconductivitydropof 8/16 isaccompaniedbya droppingpH. The secondis thatthe
response of several trace metals occursona small side peak(7/19) to the mainpeak(the upswing side
peak). Eleven dilutioneventsshowedupsidepeaks.(Only 22% of all eventsbut that isheavily
dependenton (chance) spacingof samples).Tenhadmatrix inversions,nineshowedsome metals
response,andfourshowedacorrelatedresponse.
In caseswithresponse atthe side peak, adrop inpH anda switchof OH and CO3 specieswere usually
alsoobserved.Differentmetalsrespondatthe side peakorat the mainpeak (presumablybychance).
Free metal speciationandcharge percent (inblackbelow)oftengoupwitha drop inpH as expected.
16. These pictures suggestthat‘firstflush’maybe amore extendedphenomenonthancommonlythought.
Meteorologists dosometimessay thatthe earlymonsoonseasonmaypresentwithspottyprecipitation.
As isolatedtributariesbegintorun,if theychance to pickup higherconcentrationsof metalsalongthe
way,they‘hit’the mainstreamwiththe full force. Inotherwords,the contrast betweenincomingand
receivingwaterconcentrations islikelytobe greaterthanlaterinthe seasonwhenmore tributariesare
runningandtheirconcentrationstendtocancel eachotherout.
That thishypothetical scenarioismostappropriate forhigherelevationsisbroughtoutbychangesinthe
Gilaas it flows.Howdifferentthe Gilaisat Gillespie thanitisat Saffordcanbe seenbycomparingthe
concentrationandcharge vs conductivityforGillespiewiththose forSafford above.
The plot upto about 1500 uS/cmis exactlythe same asSafford. Athigherconductivity,sulfate becomes
an increasingfactorwhile bicarbonatehaslessof a‘mediating’role thanithasat Safford.Infact, sulfate
increasesandbicarbonate decreasesparticularlyinthe springasthe Gila progresses. (Safford left,
Gillespie right,bicarbonateaxis lowerrightside of diamond increasinggoingdown,spring- yellow)
17. While the same dilution/concentrationresponse evidentatSaffordisstill seenatGillespie,thereare
differences. Concentrationsare even more correlatedthanatSafford butthe correlationof charge
betweenNaandCl has weakenedandthe oppositionwithcalciumandbicarbonateislessclear.
concentration Ca Mg Na Cl SO4 HCO3
Ca 1 0.957677 0.970109 0.970231 0.963923 0.448994
Mg 0.957677 1 0.960178 0.960932 0.950435 0.408477
Na 0.970109 0.960178 1 0.990563 0.983885 0.395387
Cl 0.970231 0.960932 0.990563 1 0.972332 0.389997
SO4 0.963923 0.950435 0.983885 0.972332 1 0.348298
HCO3 0.448994 0.408477 0.395387 0.389997 0.348298 1
molese Ca Mg Na Cl SO4 HCO3
Ca 1 0.057617 -0.94184 -0.84481 -0.25469 0.854752
Mg 0.057617 1 -0.35518 0.017606 -0.07962 0.007393
Na -0.94184 -0.35518 1 0.794772 0.324235 -0.83363
Cl -0.84481 0.017606 0.794772 1 0.079984 -0.92585
SO4 -0.25469 -0.07962 0.324235 0.079984 1 -0.44067
HCO3 0.854752 0.007393 -0.83363 -0.92585 -0.44067 1
There appearsto be lesscontrastbetweenincomingandreceivingwatersatGillespie thanatSafford.
HighTDS groundwaterorag returnsflowingintoagenerallyhigherTDSwaterratherthan a dilute
18. meetingamore concentratedreceivingwater(particularlyinsodiumandchloride).The lackof contrast
makesresponse hardertogauge.
One corollaryof thismay be that so called‘influx’ and‘outflux’situationsare more commonat lower
elevations. Gillespie certainlyhasag andmunicipal returnswhichmaybe of generallyhighTDSwater
and the Gilaflowsundergroundincertainspotswhichmight(somehow) make inflltrationapossibility.
While some ‘influx’and‘outflux’designationmaybe erroneous, asatSafford,the ratios of the different
typesof eventschangesdramaticallyatGillespieandDome where influx andoutflux are 16 and 19-20%
for a combinedtotal of about35-36% of all events(asopposedto14% at Safford).
Under similarcircumstancesasSafford,one ismore likelytosee ‘partial’than‘full’matrix inversions at
Gillespie. The majorionsmerelytake aslightmove toward or awayfrom eachother.These are not,
strictlyspeaking,matrix ‘inversions’buttheydo bearthe same relationtodilution/concentration events
and pointtoward the same mechanismasat Safford.
Note that bicarbonate isstill uncorrelatedforconcentrationandsulfate isstill uncorrelatedforcharge.It
may be that, as the dynamicbetweenna/cl andca/hco3weakens,the rolesof bicarbonate andsulfate
ionpairs in maintainingthe highsodiumchloridematrix maychange butwhethermore orless
importantisnot clear.
Withmajor iondynamicslessclear,itisnot surprisingthatminorconstituentresponseto
dilution/concentrationare mutedand/orconfused. Evenwithfairlylarge dipsinconductivity/peaksin
flowone ismore likelytosee flatlinesoraconfusedjumble.
19. But while responsetodilution/concentrationeventsislessclearthere are a numberof new
relationships emergingatGillespie.pHchangesunaccompaniedby change in flow orconductivity,seem
to be apparentcausesof concentrationchanges more often thanatSafford.There mayalsobe different
responsesinvolvingbicarbonate,iron,andsilicabutthese have notbeenfullyworkedout.
Some responsesseenatGillespie are particularlysuggestive. Incertainyears,the phosphatesoscillate
ina sine pattern. The regularityandtightnessof the responsesuggestssomesortof fine-tuningisgoing
on butno relationtoflow/concentrationorothermetal trendshave beenfound.If fairlyhigh
concentrationsweren’trepresented,one mightsuspectananalytical artifactof some sort.
Thiskindof tightmovementisreminiscentof ironspeciation changes exceptthatthe latteriseasily
explained. Everytime the pHcrossesthe pH = 8 line there isa shiftinspeciationfromFe(OH)4to
Fe(OH)2or vice versadependingonthe direction of change.
20. The significance of these changesishardtoshow but itseems thatiron mayhave a role infine-tuning
charge relationships. Fe(OH)4isminuscharged,while Fe(OH)2ispluschargedandFe(OH)3is
uncharged.Whichspeciespredominatemaynotbe directlyrelatedtoflow/concentrationeventsbut
more to the total charge structure of the incomingflow.
Iron hasseveral strongcorrelationsthatare veryinterestingaswell. Atmostsitesexaminedthere isa
strongcorrelation betweenFe(OH)4- speciationand H3SiO4concentration(>0.9).H3SiO4, witha minus
charge andoftenexistingatintermediateconcentrations,canbe a major charge carrier. Fe(OH)4-
speciation alsohasa pretty faircorrelationwithHCO3speciationwhichmaybe relevanttowhatone
seesat LeesFerry(below)
In fact, the ColoradoatLeesFerry looksverymuch like the Gilabutonlybefore 1964. ColoradoRiver
chemistrychangesin1964-5, presumably due tothe constructionof dams.The major ionconcentrations
become lessvariable and higherbicarbonate concentrationsinthe spring are nolongerevidentonthe
21. PiperPlot.(left:1926-1965, right:1966-2008, spring– green, bicarbonate axisisthe lowerrightside of
the diamond,goingfrom0 (high) to100(low))
After1964 concentrationsgodown andhighseasonal variabilityisreplaced byasine curve with
amplitude of about5-7 years. The graphs below show majorionconcentrationsbefore (left) and
after1964 (right).
A closerexaminationof the post-damsulfateconcentrationsrevealsthatseasonal fluctuationsremain
but as an inner,tightercurve insidethe largersine curve.
22. In the earlierperiod,the relationshipbetweenflow andconcentrationisclear,withhighflows
correlatingwithlowerconductivity. The matrix response tothisscenarioissimilartothatof the Gila,
complete withmatrix inversion, inspite of the factthatthe Coloradoisnot a highsodiumchloride
matrix.
Post1964, the 5-7 yearsine curve correlatesverywell withthe release datafromLake Powell.Lees
Ferrymay indeedhave beenusedasa gaugingstation fordam releases,sincequotedreleaseflows from
GlenCanyonDam are identical withflowsatLeesFerryuntil about1979, afterwardstheydifferslightly.
23. Whetherdamreleasesare havingaconcentratingor a dilutingeffectisnotentirely clear. Itmaydepend
on howreleasesare made,‘overthe top’havingapresumably‘decanting’effect,whilereleasesthatstir
up the bottommightprovide more concentratedwaters. Ingeneral,TDS alongthe Coloradoisrather
steadyat the 5 sitesexaminedatabout550-570 mg/L until one reachesMoreloswhere itjumpsto
about800 mg/L.
Overthe longspan, itwouldappearthat higherflowsare accompaniedbylowerTDS.Lookingat a
smallertime span,though,revealsthatthe relationshipisnotalways thatclear. Similarlywithwhatis
seenat Gillespie,there appeartobe more ‘influx’and‘outflux’scenarios. Infact, before 1964 influx and
outfluxsare 13 and 17% fora total of 30% of total events,after1964 theycomprise more than50% of
eventdesignations(21and30%)
Giventhese considerations,itishardlysurprisingthatLeesFerryafter1964 looksa lotmore like the Gila
at Gillespiethanthe Gilaat Safford. Whateverthe exactflow/concentrationrelationmaybe,the
lesseningcontrastbetweeninflowingandreceivingwaters,seemstooperate similarlywhethercaused
by change inelevationordamconstruction.
These conclusionsare borne outbycorrelations.Before 1964 the dynamicbetweenNaCl &CaHCO3is
clear,afterwards,notsomuch
LEES FERRY
1947 1964
mols
e/molse Ca Mg Na Cl SO4 HCO3
Ca 1 -0.40573 -0.94925 -0.89028 -0.64347 0.850363
Mg -0.40573 1 0.100641 0.189917 -0.04384 -0.04691
Na -0.94925 0.100641 1 0.905448 0.71796 -0.91212
Cl -0.89028 0.189917 0.905448 1 0.488477 -0.79756
SO4 -0.64347 -0.04384 0.71796 0.488477 1 -0.91546
HCO3 0.850363 -0.04691 -0.91212 -0.79756 -0.91546 1
1965 2006
24. mols
e/molse Ca Mg Na Cl SO4 HCO3
Ca 1 -0.14401 -0.71956 -0.52467 -0.41035 0.589472
Mg -0.14401 1 -0.542 -0.37188 -0.28283 0.400297
Na -0.71956 -0.542 1 0.66897 0.613963 -0.80739
Cl -0.52467 -0.37188 0.66897 1 0.267296 -0.74255
SO4 -0.41035 -0.28283 0.613963 0.267296 1 -0.83879
HCO3 0.589472 0.400297 -0.80739 -0.74255 -0.83879 1
Withregulatedflows,the chemistrybecomesverydull(!)
Metals were notanalyzedatLeesFerrybefore 1964, soit isnot possible tocompare before andafter
metals.Iron,however,wasanalyzedand showsamarkedchange inspeciation atLeesFerry around
1964 as well.
The connectionbetweenbicarbonate andironhasbeenstudiedingroundwaterbut whetherthe same
connection existsinsurface waterandwhatitmightmeanare notknown Suspectingthatthe change in
ironspeciation mightbe linkedwith decreased bicarbonate composition inthe spring,ironspeciation
graphs at the Gilaat SaffordandGillespie were comparedbutnochange foundanalogoustothat at
LeesFerry.The correlationbetweenFe(OH)4- speciationandHCO3/CO3speciation,however,is -.54
before 1964, butjumpsto -.94 after at LeesFerry. On the Gila,the correlationis -.5at Saffordand
movesupto -.79 at Gillespie. Whatthe significance isof sucha speciation-speciationconnectionisnot
clearat thispoint.
26. The followinggraphsshowthe flow,conductivityandmassflux relationsandmajorionresponse at
Morelosin1993 to increasedflowfromthe Gila.
The massive dilutioneventwasnotaccompaniedbya verylarge drop inconductivityorTDS. There was
howeveralarge negative massflux (apointtopointconcentration timesvolume calculation).Asthe
nextgraphsshow,there wasa concentrationinversion (sulfate lowerthanbicarbonate whichisnot
usual for the Colorado) butnocharge inversion.
As mightbe expected,whilethe carbonate andsulfate majorioncompoundsdodip,there isnotsvery
convincingcorrelatedupwardmovementamongtrace metal compounds..
Individual metalswere graphedandthe response foundtobe quite variablebothintermsof magnitude
and timingwithmanyshowingnoresponse atall. A few examples of individual metal concentration
responsesover1993:
27. Giventhese results,itishardto see how the initial graph(p.8),made froma randomgroup of metals,
was evenproduced. Attemptswere made toreconstructthatgraph fromthe original concentration
data (thatis, not run throughUSGS software) andthe difficultiesrunintoare interesting. Atfirst,to
make the resultsas close tothe modellingresults,onlydissolvedspecieswereused. Thenonlytotal
specieswere used(there wasnosuspendeddatafor1993, the analyseshavingbeen suspendedearlier).
The difference betweendissolvedandtotal resultsmayhelptoexplain why modelledresultsshow little
correlated metalsresponseandalsosuggeststhat,inthiscase,leavingsolidsformsoutresultsinan
incomplete pictureof whatisgoingon.
But the above graphsstill don’tlooklike the original. Whatwasneededwasscalingthe responsesto
sulfate aswas done inthe original graph. (Correlationis,afterall,inthe eye of the beholder! The 5-7
sine curve seeninthe original doesappearinthe below graphasit isbeingconstructedbutdisappears
when(too) manypointsare added) Here are total anddissolvedspeciesscaledtosulfate, parameters
withno pointsbetween 1/93and 6/93 removed,and the same time frame as the original. And having
arrivedback where we started,havingraisedfarmore questionsthanprovidedanswers ... thisseems
like agood place to end.