1. 1
Distributed Energy Resources –
Future Prospects
In a May 2016 NREL publication called
“Emerging Issues and Challenges in
Integrating Solar with the Distribution
System,” the paper stated “From 2010
through the first half of 2015, the installed
capacity of solar photovoltaics (PV)
connected to the U.S. distribution system
increased sixfold, from approximately 1.8
GW to more than 11 GW. This accounts for
over half of the approximate total U.S. solar
installations of 20 GW. Distributed
generation from PV (DGPV) is expected to
comprise 50%–60% of total U.S. PV
capacity through at least 2020.”
Similarly, small wind installations of 1-100
kW are being installed in record numbers
throughout the USA. In an August 2016
paper written by Pacific Northwest
Laboratory for the DOE, it was stated that
“between 2003 and the end of 2015, over
75,000 wind turbines totaling 934 MW
were deployed in distributed applications
across all 50 states.” With costs of wind
installations falling by 60% over the past 5
years, it is anticipated that small wind
generation will continue to be installed on
A dynamic solution to problems caused by high
penetrations of Distributed Energy Resources (DER)
A white paper by AMSC
Executive Summary
As a result of state and federal incentives, greatly reduced
equipment costs and a global awareness of the impacts of burning
fossil fuels, there has been a large increase in the installation of
Distributed Energy Resources (DER) including photo voltaic (PV) and
small wind generation on the distribution systems of many North
American utilities. As penetrations of DER increase, the problems
caused by DER are also increasing and are in some cases causing
utilities to limit the amount of DER that can be installed on their
distribution grids.
The problems caused by high penetrations of DER have been well
documented previously. They consist of voltage flicker due to rapidly
varying wind speed or cloud cover, and the inability to regulate
steady state voltage due to rapidly changing generation levels and
reverse power flow. These changes in both voltage and generation
also cause increased maintenance requirements for voltage
regulators, transformer load tap chargers and capacitor bank
switching devices.
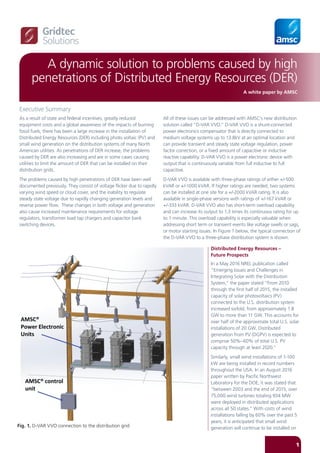
All of these issues can be addressed with AMSC’s new distribution
solution called “D-VAR VVO.” D-VAR VVO is a shunt-connected
power electronics compensator that is directly connected to
medium voltage systems up to 13.8kV at an optimal location and
can provide transient and steady state voltage regulation, power
factor correction, or a fixed amount of capacitive or inductive
reactive capability. D-VAR VVO is a power electronic device with
output that is continuously variable from full inductive to full
capacitive.
D-VAR VVO is available with three-phase ratings of either +/-500
kVAR or +/-1000 kVAR. If higher ratings are needed, two systems
can be installed at one site for a +/-2000 kVAR rating. It is also
available in single-phase versions with ratings of +/-167 kVAR or
+/-333 kVAR. D-VAR VVO also has short-term overload capability
and can increase its output to 1.3 times its continuous rating for up
to 1 minute. This overload capability is especially valuable when
addressing short term or transient events like voltage swells or sags,
or motor starting issues. In Figure 1 below, the typical connection of
the D-VAR VVO to a three-phase distribution system is shown.
®TM
Fig. 1. D-VAR VVO connection to the distribution grid
2. 2
utility distribution systems in ever greater
numbers in the coming years.
Based upon historic trends and future
forecasts, it is clear that there will be
increasing levels of penetration of PV and
small wind turbine generators (DER)
installed on the North America’s distribution
systems. Utilities need to prepare for this
future and develop a better understanding
of the problems associated with DER.
Understanding these unique problems
caused by DER will allow utilities to
investigate new system designs and look at
advanced technology solutions that will
enable greater penetrations of DER on their
systems without jeopardizing the
performance and operation of the
distribution grid.
DER Impact on Power Quality and
Voltage Flicker
The increase in DER penetration on utility
distribution systems is causing several types
of problems for utilities. One key problem is
the inability of conventional voltage
regulation equipment to prevent noticeable
and objectionable changes in voltage due
to rapid changes in DER generation output.
The existing distribution system uses a
combination of transformer load tap
changers at the transmission source, one or
more voltage regulators along the
distribution line and switched capacitor
banks to keep the steady-state voltage
within an acceptable range along the
distribution circuit from the source to the
end use customer. As long as changes in
either customer load or generation occurred
gradually over several minutes, these slow
mechanical devices did a reasonably good
job of keeping the voltage within limits and
preventing voltage flicker. Figure 2 above,
shows a typical 15 kV class distribution
feeder including the common voltage
regulation equipment used by utilities to
control steady-state voltages. Note that the
changes in load that can be compensated
with mechanically-actuated equipment are
approximately 10 minutes or even longer in
the case of switched capacitors. In addition,
there are limits on the number of their daily
operations and on their repeat intervals..
However, unlike the slow changing of
most customer’s loads, DER can change its
output much more rapidly and many more
times per hour and per day. The combined
effect of the speed, magnitude and
frequency of change in DER is more than
the existing distribution system equipment
can keep up with. The results are usually
voltage flicker problems, reduced levels of
power quality and higher maintenance on
existing distribution system equipment.
The speed, magnitude and frequency of
change in DER output are best seen by
looking at an actual example of a PV
generation site located in the upper
Midwest. Figure 3 at right, contains
generation data from a PV site in the
upper Midwest and shows the daily
variation in PV output due to the passing
of clouds. Note that there are in excess of
30 cycles of PV generation changing by
50% or more. Also note the rapid rate of
increase and decrease in PV output as a
result of passing clouds. The 12-30 second
timeframe for 50% PV generation changes
is too fast for mechanical voltage
regulation equipment (transformer LTC,
voltage regulators, and capacitor banks) to
react to and fix it in real time and
therefore, voltage flicker will occur.
To demonstrate the voltage flicker
problem, a typical 13.2 kV distribution
system was modeled using DIgSILENT
software. The three-phase system
consisted of 8 busses, 6 loads, one set of
three-phase voltage regulators, one 400
kW PV generation bus and one D-VAR
VVO bus. The base case flows and
voltages without the D-VAR VVO are
shown in Figure 4 on right.
As seen in Figure 4, the voltages on all
load serving busses from the source to the
end of the feeder are in a very narrow
range of 1.007-1.010 pu. The PV
generation in the base case is 400 kW.
DG
(PV)
DG
(PV)
DG
(PV)
D-VAR
VVO
Step VR
15kV Feeder
Substation
Loads
(customers)
Loads
(customers)
D-VAR VVO Switched caps
Partly Cloudy Days:
“Megawatts a
Minute”
Corrects for load
changes (time)
Daily operations
limit (type)
Reverse power
conditions
> 10 mins. 3-4 cycles
No limit
Robust
> 60 minutes
< 4
Can’t reduce
voltage
< 30
“Sensitive”
Fig. 2 Existing utility voltage regulation tools
3. 3
When the loads and/or generation change
very slowly, the regulators, LTCs and
voltage controlled capacitor banks can do
a reasonable job of maintaining an
acceptable voltage profile from the source
to all loads. However, when things change
rapidly, voltage regulators, transformer
LTCs and switched capacitor banks do not
have the required speed of response, the
repeatability or granularity needed to
maintain voltages in the desired range.
Thus, when a cloud bank comes over the
PV generation array and rapidly decreases
its output from 400 kW to nearly 0 kW in
15-30 seconds, the voltage along the
feeder will drop by 3.8-5.5%. The reason
for the large voltage variation is because
the LTCs, voltage regulators and capacitor
banks are mechanical devices with control
actions of 45-60 seconds or longer. Figure
5 at the bottom, shows the voltages that
result from a 400 kW PV reduction prior to
any corrective LTC, voltage regulator or
capacitor bank operation.
Fig. 3 PV generation variation due to passing clouds
Fig. 4 DIgSILENT load flow base case without D-VAR VVO
Fig. 5 Fast PV generation reduction 400 kW to 0 kW in 15 seconds - No D-VAR VVO
4. 4
Figure 6 above shows the voltage vs. time
plot at three busses before, during and
after the 400 kW PV generation reduction
over 15 seconds. The simulation assumes
no LTC or regulator tap position changes
during the 20 second simulation period
and no D-VAR VVO installed. Because the
LTCs, regulators and capacitor banks are
not fast enough to operate during this
time, voltage flicker will occur because the
voltage change exceeds flicker limits.
D-VAR VVO Dynamic Volt/VAR
Compensator Added to Solve the
Flicker Problem
To prevent voltage flicker, a fast dynamic,
continuously variable device such as D-VAR
VVO is needed. The D-VAR VVO varies its
reactive current output on a sub-cycle basis
to maintain voltage within a narrow range
defined by the operator, owner, etc.
If a +/-1000 kVAR D-VAR VVO is added at
Bus 4, the voltage change is limited to a
narrow range of 0.5-1.3% during the same
PV generation reduction scenario. The
D-VAR VVO limits the voltage change to a
value that does not result in voltage flicker.
Figure 7 below, shows the voltage change
at Bus 7 during a 400 kW PV generation
ramp down over a 1 second period with
and without the D-VAR VVO installed.
Previously the voltage at bus 7 dropped by
5.5%, as seen in Figure 6 above. When
D-VAR VVO was added, the voltage at Bus
7 only dropped by 1.3%. Voltage changes
of this small magnitude are not considered
to cause flicker or impact customer
equipment.
As seen in Figure 7 below, the D-VAR VVO
output at the completion of the 1 second
PV ramp off is 543 kVAR capacitive or just
over half of its continuous output rating.
This indicates that the voltage could be held
within a narrower range if desired by
Fig. 7 Voltage vs. Time plot 400 kW PV reduction in 1 second with D-VAR VVO Installed
Fig. 6 Voltage vs. Time plot 400 kW PV reduction without D-VAR VVO Installed
5. 5
choosing a shallower droop setting instead
of the 1% droop that was used in the
simulation. It also suggests that a +/-500
kVAR D-VAR VVO would achieve nearly the
same results for this particular situation
Off Peak Load issues
As customer load changes on a daily or
hourly basis, the distribution system’s LTCs,
voltage regulators and capacitor banks all
change their tap position or status
according to a preset voltage control
scheme. Load can vary from 30-100% of
peak on a daily basis depending on the type
of load being served and the time of year.
This usually is not a critical issue for utilities
unless the distribution circuit also includes a
large penetration of PV or wind turbine
generation. The issue stems from the
change in direction of the power flow on
certain sections of the distribution circuit.
At light load levels, the DER generation can
be greater than the total load on the circuit
resulting in reverse power flow back to the
transmission source. Reverse power flow
may present problems such as limited stable
tapping range for voltage regulators thus
causing them to regulate improperly.
Installation of the D-VAR VVO Dynamic
Volt/VAR Compensator can prevent these
regulator problems by continuously
regulating the voltage and relieving the
regulator of these responsibilities. .
Increased Equipment
Maintenance Costs
On a typical distribution circuit, the load is
low in early morning and begins to increase
at daybreak. The load typically continues to
grow through midday and then drops after
sunset. Thus, capacitor banks typically turn
on and off once per day while regulators
and LTCs typically ratchet up slowly then
down again slowly late in the day in
response to these predictable load changes.
However, with the introduction of DER on
any distribution circuit, the total load will
vary up and down many times per day.
Figure 3 referenced earlier is a PV site in the
upper Midwest and shows the daily
variation in PV power output due to the
passing of clouds. There are in excess of 30
cycles of PV generation changing by 50% or
more during that day and there is a rapid
rate of increase and decrease in PV output
as a result of the passing clouds. The 12-30
second timeframe for a 50% PV generation
change is too fast for mechanical voltage
regulation schemes to react to and fix in real
time and therefore, flicker will occur.
However, all of these mechanical devices
will still chase the voltage for several
minutes after the change in output has
occurred resulting in tens or hundreds of
additional LTC and regulator tap position
changes per day. Capacitor banks will also
experience additional open/close operations
if they are voltage controlled.
The following simulation shows how the
D-VAR VVO prevents voltage flicker and can
greatly reduce regulator tap changer
operations. If mechanical voltage control
devices are present on feeders with high
DER penetration, the result will be a greatly
increased maintenance requirement plus a
premature need for replacement of
equipment. Figure 8 above, provides a good
example of the increased regulator tap
changing required due to changes in PV
generation level. The figure shows
simulation results for a distribution grid
including 400 kW of PV generation without
D-VAR VVO installed. The figure shows the
resulting voltages and the regulator tap
position that would occur after each cycle of
PV generation output change.
The dynamic simulation takes place over 40
minutes and assumes clouds move in to
cover the PV site in 60 seconds causing the
PV generation to decrease from 400 kW to
0 kW. Similarly, the clouds are assumed to
move away in 60 seconds at the 10 minutes
point which increased PV generation from 0
kW to 400 kW. This sequence repeats twice
in 40 minutes.
The figure shows that when PV generation
changes rapidly, regulators and transformer
LTCs cannot react fast enough to keep
voltage within the desired range. This
causes voltage to fluctuate by 3-5% along
the line and up to 9% near the end of the
line. Clearly, this results in voltage flicker
violations for customers due to the rapid PV
generation changes.
In addition, after the PV generation changes
its output, step voltage regulators react and
change tap position to attempt to correct
the voltage. The dynamic simulation above
assumed a regulator target voltage of
1.000pu and a range of +/-0.015pu (shown
in the orange shaded area). Several
regulator tap position changes within a
40-minute period occur as the PV
generation fluctuates due to cloud
movement. Over the course of a month the
regulator tap counter can register more than
one thousand tap changes.
An excellent solution to avoid this added
maintenance and/or premature equipment
replacement is to install a fast-acting power
electronics voltage control device, such as
the D-VAR VVO. The D-VAR VVO is capable
of varying output between the rated
capacitive and inductive capability
thousands of times a day. Because the
device has no moving parts, this
performance is accomplished without
requiring additional maintenance or
decrease of its useful life. Figure 9 below
shows the same repeated PV ramp-on and
ramp off sequence but with D-VAR VVO
added.
As seen Figure 9 on the following page,,
once D-VAR VVO is added to the simulation,
voltage along the feeder remains within the
orange shaded regulator voltage dead-band
and requires only two regulator tap position
changes over the same 40-minute period.
Thus, there are 10 times fewer regulator tap
position changes when the D-VAR VVO is
operating. D-VAR VVO prevents voltage
flicker and at the same time prevents the
need for voltage regulators to change taps
in response to large or small changes in PV
output. This can save several hundreds of
tap position changes on a monthly basis
thereby reducing regulator maintenance
while increasing the useful live of the
equipment.
Fig. 8 Voltage and Regulator Tap Position during PV generation ramping on and off without
D-VAR VVO