Recommended

Recommended
More Related Content
What's hot
What's hot (20)
Similar to Green Roof Storm Analysis
Similar to Green Roof Storm Analysis (20)
Green Roof Storm Analysis
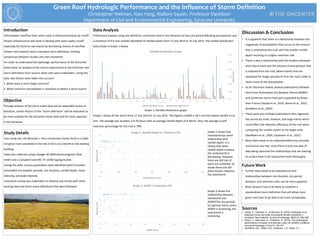
- 1. Green Roof Hydrologic Performance and the Influence of Storm Definition Christopher Weiman, Xiao Yang, Mallory Squier, Professor Davidson Department of Civil and Environmental Engineering, Syracuse University Introduction •Stormwater overflow from urban roofs is influenced heavily by runoff •Green infrastructure will assist in dealing with storm water runoff especially for extreme rain events by decreasing chance of overflow •Green roof research lacks a standard storm definition, limiting comparison between studies and sites elsewhere •In order to understand the hydrologic performance of the OnCenter Green Roof, an analysis of the storms experienced at the OnCenter and storm definitions from various other sites were undertaken. Using this data, two factors were taken into account: 1 .When does a storm begin and end? 2. What minimum precipitation is necessary to define a storm event? Objective Through analysis of the storm event data and an expanded review of literature, certain factors of the “storm definition” will be evaluated to be more suitable for the OnCenter Green Roof and for roofs reported in the literature. Study Details •Our study site, the Nicholas J. Pirro Convention Center Roof is a 5,600 m2 green roof completed in the Fall of 2011 as a retrofit to the existing building. •Data was collected using a Badger M-2000 electromagnetic flow meter and a Campbell Scientific TE 525W tipping bucket. •Using this data, various parameters were identified which included antecedent dry weather periods, rain duration, rainfall depth, mean intensity, and peak intensity. •Literature review was undertaken to observe any trends with other existing sites and storm event definitions that were followed. Data Analysis Preliminary analysis using one definition commonly cited in the literature (6 hour dry period following precipitation and a minimum of 0.6 mm rainfall) identified 79 rainfall events from 17 July 2014 to 15 July 2015. The rainfall distribution data shows in Graph 1 below Graph 1, Rainfall distribution graph Graph 1 shows all the storm from 17 July 2014 to 15 July 2015. The highest rainfall is 58.3 mm the lowest rainfall is 0.6 mm. The average rain duration is 8.76 hours with an average rainfall depth of 8.39mm. Also, the average runoff retention percentage for the roof is 79%. Discussion & Conclusion • It is apparent that there is a relationship between the magnitude of precipitation that occurs to the amount that is retained by the roof, with the smaller rainfall depth resulting in a higher retention rate • There is also a relationship with the duration between each storm event and the amount of precipitation that is retained from the roof, where events that are separated for longer periods of time the roof is able to retain more of the precipitation • As for literature review, several publications followed the 6-hour Antecedent Dry Weather Period (ADWP) and combined storms that were separated by fewer than 6 hours (Voyde et al., 2010, Stovin et al., 2012, VanWoert et al., 2005) • There were also multiple publications that organized the storms by small, medium, and large events which could effect the retention efficiency of the roof when comparing the smaller events to the larger ones (VanWoert et al., 2005, Carpenter et al., 2011) • More data needs to be collected before any concrete conclusions are met, since there is only one year of data being observed the relationships that are starting to surface have to be researched more thoroughly Sources • Voyde, E., Fassman, E., & Simcock, R. (2010). Hydrology of an extensive living roof under sub-tropical climate conditions in Auckland, New Zealand. Journal of Hydrology, 394(3-4), 384-395. • Stovin, V., Vesuviano, G., & Kasmin, H. (2012). The hydrological performance of a green roof test bed under UK climatic conditions. Journal of Hydrology, 414-415, 148-161. • VanWoert, N.D., Rowe, D.B., Andersen, J.A., Rugh, C.L., Future Work • Further data needs to be evaluated so that relationships between rain duration, dry period duration, and retention rates can be more apparent • More research has to be done to establish a standardized storm definition that will allow more green roof sites to be able to be more comparable. -0.2 0 0.2 0.4 0.6 0.8 1 1.2 0.00 10.00 20.00 30.00 40.00 50.00 60.00 Retention(%) Rainfall Depth (mm) Graph 2, Rainfall Depth vs. Retention (%) -0.2 0 0.2 0.4 0.6 0.8 1 1.2 0 50 100 150 200 250 300 350 Retention(%) ADWP (Hour) Graph 3, ADWP vs Retention (%) 0.00 10.00 20.00 30.00 40.00 50.00 60.00 1 5 9 13 17 21 25 29 33 37 41 45 49 53 57 61 65 69 73 77 Depth(mm) Number of rainfall Rainfall Distribution Graph Rainfall depth (mm) Retention depth (mm) Graph 2 shows that retention% has some relationship with rainfall depth. It is clearly that when rainfall depth increase, the rentention% is decreasing. However, there are still lots of point are scattered. Its shows there are still other factors influence the retention% Graph 3 shows the relationship between retention% and ADWP(The dry period). For general trend, when ADWP is increasing, the retention% is increasing.