1. Defining "Maintenance costs"
One universal measurement of maintenance performance, and perhaps the measure that matters
most in the end, is the cost of maintenance. Unfortunately maintenance costs are often used to
compare maintenance performance between companies or between plants within the same
company.
Equally unfortunately, there is no standard for measuring maintenance costs. Each company,
usually each plant within a company and often each department within a plant develop their own
definition of "maintenance costs."
For this reason, maintenance cost comparisons should always be accompanied by a clear definition
of what is included and excluded for each plant included in the comparison.
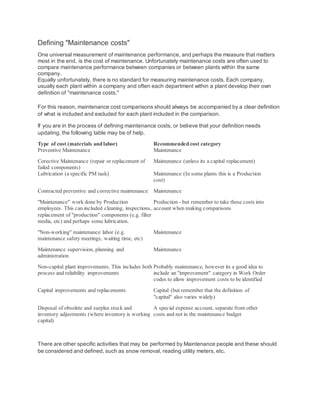
If you are in the process of defining maintenance costs, or believe that your definition needs
updating, the following table may be of help.
Type of cost (materials and labor) Recommended cost category
Preventive Maintenance Maintenance
Corective Maintenance (repair or replacement of
failed components)
Maintenance (unless its a capital replacement)
Lubrication (a specific PM task) Maintenance (In some plants this is a Production
cost)
Contracted preventive and corrective maintenance Maintenance
"Maintenance" work done by Production
employees. This can included cleaning, inspections,
replacement of "production" components (e.g. filter
media, etc) and perhaps some lubrication.
Production - but remember to take these costs into
account when making comparisons
"Non-working" maintenance labor (e.g.
maintenance safety meetings, waiting time, etc)
Maintenance
Maintenance supervision, planning and
administration
Maintenance
Non-capital plant improvements. This includes both
process and reliability improvements
Probably maintenance, however its a good idea to
include an "improvement" category in Work Order
codes to allow improvement costs to be identified
Capital improvements and replacements Capital (but remember that the definition of
"capital" also varies widely)
Disposal of obsolete and surplus stock and
inventory adjustments (where inventory is working
capital)
A special expense account, separate from other
costs and not in the maintenance budget
There are other specific activities that may be performed by Maintenance people and these should
be considered and defined, such as snow removal, reading utility meters, etc.
2. A clear definition is important so that cost trends can be identified, which is the "comparison" that is
of the greatest value. The definition becomes critical if costs are used as part of an incentive, for
example, where maintenance is contracted to an outside company.
Visible and Invisible Maintenance Cost Saving
In my earlier column I wrote about the Fox versus the Hedgehog approach. That column was also
published in an electronic newsletter and included in the weekly poll. The poll results show that only
16.7% of all respondents thought their company was a hedgehog company.
This means that most organizations take a short term approach to cost reduction and savings which
in the long term will be very costly. I frequently see examples on this in organizations I work with.
One common example is that cost reduction initiatives almost entirely focus on visible cost
reductions while waste built into the day to day work system are overlooked or ignored.
Let me give some examples, I hope you do not recognize any of them, but if you do, do not believe
you are alone in doing so.
It is not at all uncommon that operations and maintenance shutdown schedules are wide open until
the morning of the shut down. So the following can be a common phenomenon:
A shutdown of an area is preliminary estimated to require ten hours, if all necessary work is to be
completed. First step to save money is to cut the shutdown to eight hours, so some work must be
postponed, because to bring in more contractors to complete all work will cost too much visible
money. “Perhaps we can run the three rotary steam joints until next shutdown, they do not yet leak.
We know that the carbon rings in these joints only have about 1/8” thickness left but we take the risk”
is one suggestion, so these jobs are cancelled along with some other work deemed as not urgently
needed. During the shut down the operations manager added three jobs that had been forgotten and
was therefore not put on the maintenance schedule before the shut down. This delayed the start up
by three hours. The coupling for one dryer section drive was to be replaced. After pulling the
coupling off the shaft it was discovered that the coupling was not requested from the store and when
it was found it was not prepared to the right shaft diameter, nor did the key way fit. This was one of
the last jobs, so no time was given to prepare coupling properly. The old coupling was put back and
welded together to be fixed right later.
At start up the steam system was started too fast resulting in a lot of water hammer in pipe systems.
A consequence was that two of the three carbon rings in the rotary steam joints cracked and the
joints started to leak. They could be shut off but this would result in a 10% slowdown of production
speed. Also the cost of repairing the joints went up by 10 times because of the damaged seal
surfaces. The coupling lasted through the startup, but was forgotten and three months and three
shutdowns later, the bearings in both motor and gearboxfailed. The welded coupling was too stiff
and also misaligned. This caused six hours of unscheduled lost production and additional
maintenance costs.
3. The root of the above examples of waste is poor disciplines in prioritization of work, lack of closing
time for shut down schedules, too easy to add on a job even during a shut down, lack of planning of
work etc. But it has always been this way in this organization so the waste is known and accepted.
The fix to the problem will take time, because it includes a cultural change. “Right now we have to
save what we can in the short term so we do not have time to deal with this now, and on top of that it
will cost money to improve our work system” is a common saying in this organization.
The time and cost to improve is visible cost, the existing waste is embedded in the work system and
invisible.
So instead of improving long term and saving long term waste, the visible short term cost saving
initiatives takes over. For example: Cancellation of training programs, reduction of number of
planners and supervisors, postponing needed maintenance work, reduction of lubricators and
handing this important task to operators without training etc. It is understandable that costs must be
reduced, this is needed to survive, but the industry can no longer count on the next big upswing to
afford the cost of short term saving initiatives. So in this new market mills must take long term
improvement initiatives. The short term savings will often worsen the situation within a three to five
years perspective. A long term cultural change initiative will improve performance substantially in
three to five years.
Reliability Improvements = Cost Reduction (Part 1)
In the May column, I discussed results that a mill had experienced in the ten years following
implementation of initiatives with a primary focus on cutting costs as quickly and extensively as
possible. In summary, it proved to be a financial disaster.
In this article, I will discuss what happened in another pulp mill during a similar time period.
PRIMARY FOCUS: RELIABILITY. This mill decided to focus primarily on reliability improvements
instead of cost reduction alone. This program included the following activities:
Development of a clearly spoken and well-established partnership between operations,
engineering, and maintenance.
Replacement of a reactive maintenance policy with one that is planned and scheduled.
Formerly, less than 10% of all maintenance work was planned and scheduled; ten years later,
more than 85% of all work was executed after being planned and scheduled.
Implementation of a strong vibration analysis program; prior to the project, the average
vibration level was 0.23 in./sec, but today, it has been decreased to 0.11 in./sec.
Professional training of lubricators; this training resulted in better filtration, including water
removal, better seals, oil testing, and use of fewer types of lubricants. Cost for lubrication was
reduced by 60%.
Dynamic balancing of all rotating equipment above 1,000 rpm before being put into service;
Improvement of many equipment bases by installation of Jack-bolts to facilitate better
alignment precision;
Marking and rotating of electric motors and rolls in store at an interval of twice per month;
Implementation of alignment training, standards, and execution;
4. Analysis and improvement of stores inventory and services; by maintaining a service level of
more than 96% to maintenance, stores value was reduced by more than 30%.
Adherence to preventive maintenance schedules increased more than 90%.
RELIABILITY BRINGS RESULTS. During the first three years of the reliability improvement
program, maintenance costs increased a total of 8% (2.5% to 3.0% per year). During the same
period, reliability - and, consequently, production throughput - increased steadily from 83% to 90%.
After the initial three years, the reliability continued to increase to 92%, resulting in a reduction of
maintenance costs by 40% (Figure 1). Figure 2 shows the financial impacts of the reliability
improvement program.
FIGURE 1. During the first three years, maintenance costs increased 8% and then began to fall, ending w ith a final reduction
of 40%.Reliability and production throughput increased steadily to a total of over 92% (time and quality performance).
FIGURE 2. Short-term increase in maintenance costs of about $3.3 million resulted in savings of $17 million annually. Value
of increased and sold production represented $18 million annually ($ values are per year).
Reliability Improvements=Cost Reduction (Part 2)
5. Tough choices
The figures in this column describe an actual case where a pulp mill decided to do whatever it took
to cut costs—mainly through maintenance cutbacks. The mill belongs to a big corporation and was a
high-cost producer. When the cost saving initiative started, pulp prices were low and profitability was
low, from a short-term perspective, compared with other mills in the corporation. The fast-pace cost
reduction actions included the following:
Operations took over maintenance and only did maintenance work that was judged
necessary.
Planning of work was not done.
Scheduling ceased to exist.
The Preventive Maintenance program was handed over to the operators, without training them
in what to do or how to inspect. The Preventive Maintenance inspectors were laid off.
Shutdown crews were merged with another mill that was a one-hour drive from the mill.
Painting programs were abandoned.
Training of craftspeople stopped, etc.
Figure 1. The first tw o years maintenance costs dropped, then started to increase. Reliability and quality production
throughput also w ent dow n and continued to do so for the six years before reinstatement of basic maintenance processes.
6. Figure 2. Same data as in chart one but in financial terms ($ values are per year). Short- term maintenance savings during
tw o years caused disastrous results after only three years.
NO LONG-TERM ADVANTAGE. In the first years after the cost saving initiative began, maintenance
costs dropped from $35 million/year to $27 million/year, and results were hailed as good. However,
reliability soon started to decline. When the initiative started, reliability was 93%, but bottomed out at
78% six years later, at a time when pulp prices had doubled.
The drop of 15% in reliability, and even more in quality production output, corresponded to a loss of
more than 300,000 tons during some very good years when product could have been sold at top
prices. Financial losses, due to low reliability resulting from the cuts in maintenance spending, were
conservatively estimated to have exceeded $1.2 billion during a three-year period.
TIME TO TURN AROUND. After realizing the catastrophic consequences of its cost saving initiative,
the mill focused on bringing its maintenance up to world-class status. Results have been very
encouraging, and today the mill is a top performer, with reliability now approaching 94%.
Maintenance costs have gone up, but so has quality production throughput. Manufacturing costs per
ton are also lower.
The actions taken to bring maintenance to world-class status included:
Reinstating Preventive Maintenance inspectors and revising the Preventive Maintenance
program;
Bringing maintenance back as a central mill function;
Developing a partnership between maintenance and operations;
Focusing on planning and scheduling;
Developing employee capabilities toward joint performance goals;
Investing capital in new equipment and restoring worn out equipment
7. During the 16th annual Pulp & Paper Reliability and Maintenance Conference in Atlanta, held jointly
with Paper Summit this past March, a similar experience was presented as a case study.
Reliability Improvements Drive Down Maintenance Costs
An organization must focus on sustainable results, not just cutting costs. Three case studies
illustrate.
Results-oriented organizations focus first on the quality and volume of production throughput,
followed closely by the cost to produce the required quality and volume. This approach will improve
reliability performance, which will drive manufacturing costs down.
Most organizations focus more on cutting maintenance costs, and, as a consequence, maintenance
costs go down temporarily, only to increase much more than the initial savings. In addition, reliability
goes down, paving the way for losses that can be substantial. This behavior and results have been
proven many times, especially in economic downturns. The root cause of this phenomenon is often
shortsightedness and what the late quality leader Dr. W. Edwards Deming described as one of the
most serious diseases in American industry: "the mobility of top management."
The three case studies that follow demonstrate what happened in two organizations that focused on
cost reductions and in a third organization that focused on Results Oriented Maintenance.
Case 1: Cost and head count reduction
The accompanying graph shows a 3-year case study in a food processing organization with an
aggressive cost reduction program. A key measure used in maintenance benchmarking exercises
was the number of maintenance crafts people and first line managers such as planners and
supervisors.
The head count reduction was done through attrition and layoffs. The major mistakes by this
organization were:
To cut costs by reducing only the number of employees and not considering reducing the
need for maintenance or improving work processes.
To focus on number of employees, instead of hours of maintenance work, including overtime
and contractor hours.
Case 2: Aggressive cost reduction
The graph for this case shows results at a chemical plant, a high-cost producer in its market, where
management decided to do whatever it took to cut costs, mainly in maintenance. When the cost-
saving initiative started, market prices for the plant’s products were low and profitability in a short-
term perspective was low compared to other plants in the corporation. The fast-paced cost reduction
actions included:
Operations took over maintenance and only did maintenance work that was judged absolutely
necessary.
Planners were laid off and planning of work was discontinued.
Scheduling was discontinued.
Maintenance prevention activities such as shaft alignment were abandoned and lubrication
was handed over to operators without training and implementation of a documented program.
8. The preventive maintenance program was handed over to the operators, without training in
what to do or how to inspect. The preventive maintenance inspectors were laid off.
Shutdown crews were merged with another plant about 1 hr drive from the subject plant.
Painting programs were abandoned.
Training of crafts people was discontinued.
After realizing the catastrophic consequences of what had happened, the mill took initiatives to bring
maintenance to world-class status. Results are very encouraging and the mill is today one of the top
performers. Reliability is approaching 94 percent. Maintenance costs have gone up, so has quality
production throughput, and manufacturing and maintenance costs per ton are lower.
The actions taken to bring maintenance to world-class status included:
Reinstating preventive maintenance inspectors and revising the preventive maintenance
program.
Bringing maintenance back to a central maintenance function.
Developing a partnership between maintenance and operations instead of a customer-
supplier relationship.
Focusing on planning and scheduling and front line implementation of these practices.
Developing employees’ capabilities toward joint goals.
Making capital investments in new equipment and restoration of worn out equipment.
Implementing front line management action indicators.
Case 3: Reliability improvements first, costs second
This plant manufactures the same product as the plant described in the previous case, but it decided
to focus on reliability improvements instead of only cost reduction. This included:
A clearly outspoken and established partnership between operations, engineering, and
maintenance was forged.
A change was made from a reactive to a planned and scheduled maintenance organization.
Less than 10 percent of all maintenance work was planned when the initiative was launched.
Ten years later more than 85 percent of all work is planned and scheduled.
A strong vibration analysis program was implemented. When it started, the average vibration
level was 0.23 in./sec. Today it is down to 0.11 in./sec.
Lubricators were professionally trained. This resulted in better filtration and water removal,
better seals, oil testing, and fewer types of lubricants. Cost for lubrication was reduced by 60
percent.
All rotating equipment above 1000 rpm is balanced dynamically before it is put into service.
Many equipment bases were improved and equipped with jack-bolts to improve alignment
precision.
Electric motors and rolls in storage are marked and rotated twice a month.
9. Alignment training, standards, and execution were implemented.
Stores inventory and services were analyzed and improved. Service level now stands at 96
percent and stores value has been reduced by more than 30 percent.
Adherence to preventive maintenance schedules was increased to over 90 percent.
Reliability pays
Reliability improvements increase production throughput and drive down maintenance costs.
Maintenance cost reduction is a consequence of reliability performance; it is never the other way
around.
Case 1: Moving maintenance resources to operations and cutting craft personnel. The number of crafts people w as
reduced by 14.3 percent the first year. After 1 year, 6 percent w ere hired back. In the same period, contractor spending w ent
up 88 percent. Total maintenance hours including overtime, contractor hours, and in-house hours w ent up 10.5 percent.
Total maintenance costs w ent up 29.2 percent. On top of that, reliability and production throughput decreased 6 percent.
This plant is now investing in hiring and training more maintenance people, implementing lost maintenance practices, and
moving all maintenance resources back to professional maintenance management after initially decentralizing maintenance
to operations.
Case 2: Lingering effect of 2 years of cost cutting. In the first 2 to 3 years maintenance costs dropped from $35 million/yr
to $27 million/yr and results w ere hailed as good. How ever, reliability started to decline. When beginning this initiative,
overall production reliability (OPR)—the product of quality performance, time performance, and speed performance—w as 93
10. percent; it bottomed at 78 percent 6 years after the start of the initiative. At this time the market price for the plant’s products
had doubled. The drop of 15 percent in OPR and quality production output corresponded to a loss of over 300,000 tons
during some very good years w hen product could be sold at top prices. Financial losses because of low OPR resulting from
shortsighted maintenance cost savings are conservatively estimated to exceed $1.2 billion over a 3-yr period.
Case 3: Focus on reliability. During the first 3 years, maintenance costs increased 8 percent (2.5 to 3 percent/yr). During
the same period, reliability as measured by OPR, and consequently also production throughput, increased steadily from a
low of 83 percent to 90 percent. Reliability continued to increase to 92 percent. In financial terms, a short-term increase in
maintenance costs of about $3.3 million resulted in savings of $17 million annually. The value of increased and sold
production represented $18 million annually. Total maintenance costs w ere reduced by 40 percent. Today this plant survives
another economic dow nturn because of the reliability initiative it initiated and implemented.