Otis & ahearn year end 2013 key data points review & perspective
•
2 likes•387 views

Otis & ahearn ye 2013 key data points review & perspective

Recommended
More Related Content
What's hot
What's hot (19)
Viewers also liked
Viewers also liked (13)
Similar to Otis & ahearn year end 2013 key data points review & perspective
Similar to Otis & ahearn year end 2013 key data points review & perspective (20)
Recently uploaded
Recently uploaded (20)
Otis & ahearn year end 2013 key data points review & perspective
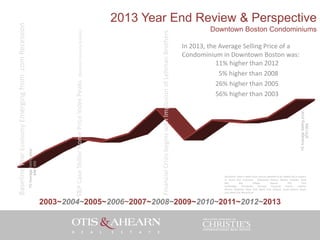
- 1. Downtown Boston Condominiums In 2013, the Average Selling Price of a Condominium in Downtown Boston was: 11% higher than 2012 5% higher than 2008 26% higher than 2005 56% higher than 2003 YE Average Selling price: $751,956 Financial Crisis begins with Implosion of Lehman Brothers (National Housing Bubble) S&P Case Shiller Home Price Index Peaks YE Average Selling price: $481,896 Baseline Year Economy Emerging from .com Recession 2013 Year End Review & Perspective Disclaimer: Data is taken from sources deemed to be reliable but is subject to errors and omissions. Downtown Boston Market includes: Back Bay, Bay Village, Beacon Hill, East Cambridge, Chinatown, Fenway, Financial District, Leather District, Midtown, Navy Yard, North End, Seaport, South Boston, South End, West End, Waterfront. 2003~2004~2005~2006~2007~2008~2009~2010~2011~2012~2013
- 2. Downtown Boston Condominiums In 2013, the Median Selling Price of a Condominium in Downtown Boston was: 10% higher than 2012 17% higher than 2008 18% higher than 2005 46% higher than 2003 YE Median Selling price: $550,900 Financial Crisis begins with Implosion of Lehman Brothers (National Housing Bubble) S&P Case Shiller Home Price Index Peaks YE Median Selling price: $423,000 Baseline Year Economy Emerging from .com Recession 2013 Year End Review & Perspective Disclaimer: Data is taken from sources deemed to be reliable but is subject to errors and omissions. Downtown Boston Market includes: Back Bay, Bay Village, Beacon Hill, East Cambridge, Chinatown, Fenway, Financial District, Leather District, Midtown, Navy Yard, North End, Seaport, South Boston, South End, West End, Waterfront. 2003~2004~2005~2006~2007~2008~2009~2010~2011~2012~2013
- 3. Downtown Boston Condominiums In 2013, the Total Sales Absorption of Condominiums in Downtown Boston was: 18% higher than 2012 28% higher than 2008 15% higher than 2005 65% higher than 2003 YE Total Absorption: $2,864,198,903 Financial Crisis begins with Implosion of Lehman Brothers (National Housing Bubble) S&P Case Shiller Home Price Index Peaks YE Total Absorption: $1,731,452,005 Baseline Year Economy Emerging from .com Recession 2013 Year End Review & Perspective Disclaimer: Data is taken from sources deemed to be reliable but is subject to errors and omissions. Downtown Boston Market includes: Back Bay, Bay Village, Beacon Hill, East Cambridge, Chinatown, Fenway, Financial District, Leather District, Midtown, Navy Yard, North End, Seaport, South Boston, South End, West End, Waterfront. 2003~2004~2005~2006~2007~2008~2009~2010~2011~2012~2013