Chemical Nose Biosensors Cancer Cells and Biomarkers
Chemical Nose Biosensors Cancer Cells and Biomarkers
1. Detection and differentiation of normal, cancerous,
and metastatic cells using nanoparticle-polymer
sensor arrays
Avinash Bajaja
, Oscar R. Mirandaa
, Ik-Bum Kimb
, Ronnie L. Phillipsb
, D. Joseph Jerryc
, Uwe H. F. Bunzb
,
and Vincent M. Rotelloa,1
Departments of aChemistry, and cVeterinary and Animal Science, University of Massachusetts, Amherst, MA 01003; and bSchool of Chemistry and
Biochemistry, Georgia Institute of Technology, 901 Atlantic Drive, Atlanta, GA 30332
Edited by Laura L. Kiessling, University of Wisconsin, Madison, WI, and approved May 20, 2009 (received for review January 28, 2009)
Rapid and effective differentiation between normal and cancer
cells is an important challenge for the diagnosis and treatment of
tumors. Here, we describe an array-based system for identification
of normal and cancer cells based on a ‘‘chemical nose/tongue’’
approach that exploits subtle changes in the physicochemical
nature of different cell surfaces. Their differential interactions with
functionalized nanoparticles are transduced through displacement
of a multivalent polymer fluorophore that is quenched when
bound to the particle and fluorescent after release. Using this
sensing strategy we can rapidly (minutes/seconds) and effectively
distinguish (i) different cell types; (ii) normal, cancerous and met-
astatic human breast cells; and (iii) isogenic normal, cancerous and
metastatic murine epithelial cell lines.
fluorescence ͉ gold nanoparticle ͉ sensor ͉ conjugated polymer
Each cell type has unique molecular signatures that distinguish
between healthy and diseased tissues (1). In the case of
cancers, the distinctions between normal vs. tumor and benign
vs. metastatic cells are often subtle. The identification of cellular
signatures for early cancer cell detection is a major hurdle for
cancer therapy; the earlier these signatures can be established,
the more effectively they can be treated (2). Cancerous cells are
differentiated from noncancerous ones on the basis of intracel-
lular or extracellular (cell surface) biomarkers. Detection meth-
ods based on specific recognition of intracellular biomarkers
(e.g., DNA/RNA/Proteins) require previous knowledge of spe-
cific mutations in DNA/RNA (3) or changes in the regulation of
protein expression inside the cells. Similarly, detection methods
based on specific recognition of extracellular (cell surface)
biomarkers such as histopathology (4), bioimaging (5), antibody
arrays require prior knowledge of biomarkers on cell surfaces.
Observation of overexpressed antigens (6) on tumor cells using
antibody-based platforms have been explored using ELISA (7),
surface plasmon resonance (8, 9), nanoparticles (10–13), micro-
cantilevers (14), carbon nanotubes (15, 16), and expression
microarrays (17). Antibody arrays provide an effective but
complex approach for cancer detection, diagnosis and prognosis
(18), however, there is no single marker or a combination of
biomarkers that has sufficient sensitivity and specificity to
differentiate between normal, cancerous, and metastatic cell
types (19). Here, we describe a detection system that is based on
selective noncovalent interactions between cell surface compo-
nents and nanoparticle-based sensor elements that does not
require any previous knowledge of intracellular or extracellular
biomarkers.
The cell membrane surface consists primarily of a thin layer
of amphipathic phospholipids, carbohydrates and many integral
membrane proteins. The amount and types of which differ
between species and according to function of cells (20, 21). This
results into distinct cell membrane composition in different cell
types. Therefore, one can predict, however, that there will be
physicochemical (i.e., charge, hydrophobicity etc.) differences
between cell types and between healthy and cancerous cells.
Such physicochemical differences could potentially be detected
by an array-based ‘‘chemical nose’’ approach that relies on
selective interactions between multiple reporter elements and
the target cell.
In the chemical nose approach, an array of different sensors
is used where every element in the sensor array responds to a
number of different chemicals or analytes (22). A distinct pattern
of responses produced from a set of sensors in the array provide
a fingerprint that allows classification and identification of the
analyte (23). The collection of sensors should contain chemical
diversity to respond to largest possible cross-section of analytes.
The specific interactions involved between the reporter elements
and the analyte are noncovalent and reversible. This approach
provides an alternative to ‘‘lock–key’’ specific recognition (24)
and has been used to detect metal ions (25), volatile agents (26),
aromatic amines (27), amino acids (28, 29), and carbohydrates
(25). In recent research we have demonstrated that the displace-
ment of fluorescent polymers from differentially functionalized
gold nanoparticles with concomitant restoration of fluorescence
provides an effective array-based method for the identification
of proteins (30). More recently, we have shown that this meth-
odology can be used to differentiate between bacterial species
and even between different strains of the same species (31). We
report here a particle-polymer array that distinguishes between
healthy, cancerous and metastatic human breast cells, and
differentiates isogenic healthy and transformed cells.
Results and Discussion
Our detection system is based on conjugates between 3 struc-
turally related cationic gold nanoparticles (NP1–NP3, Fig. 1A
and Fig. S1) and the poly(para-phenyleneethynylene) (PPE)
polymer PPE-CO2 featuring charge multivalency (32) and mo-
lecular wire properties (33) (Fig. 1A). In these noncovalent
conjugates, the nanoparticle quenches the fluorescence of the
polymer. The interactions between nanoparticles and anionic
polymers are noncovalent, and predominantly electrostatic.
When mammalian cells were incubated with these nanoparticle-
polymer complexes, there is competitive binding between nano-
particle-polymer complexes and cell types (Fig. 1B). Because of
their cationic surface, nanoparticles are expected to interact with
phospholipids, membrane proteins and carbohydrates of the cell
surface through both electrostatic and hydrophobic interactions.
Author contributions: A.B., D.J.J., U.H.F.B., and V.M.R. designed research; A.B. and O.R.M.
performed research; I.-B.K. and R.L.P. contributed new reagents/analytic tools; A.B.,
O.R.M., and V.R. analyzed data; and A.B., O.R.M., D.J.J., U.H.F.B., and V.M.R. wrote the
paper.
The authors declare no conflict of interest.
This article is a PNAS Direct Submission.
1To whom correspondence should be addressed. E-mail: rotello@chem.umass.edu.
This article contains supporting information online at www.pnas.org/cgi/content/full/
0900975106/DCSupplemental.
10912–10916 ͉ PNAS ͉ July 7, 2009 ͉ vol. 106 ͉ no. 27 www.pnas.org͞cgi͞doi͞10.1073͞pnas.0900975106
2. These interactions are responsible for displacement of the
fluorophore polymer from the nanoparticle-polymer complexes
generating a fluorescence response. The nanoparticles are ex-
pected to possess different affinities for dissimilar cell surfaces
depending on cell membrane composition and surface of nano-
particles. Selective displacement of the polymer from the particle
by the cell surface regenerates fluorescence, transducing the
binding event in a ‘‘turn on’’ fashion.
The complex stability constants (KS) and association stoichio-
metries (n) for the nparticle-polymer dyads were obtained
through nonlinear least-squares curve-fitting analysis (34). Com-
plex stabilities vary within 1 order of magnitude (⌬⌬G Ϸ 4.5
kJ⅐molϪ1
), and the binding stoichiometry ranges from 2.5 for
NP2 to 0.9 for NP3 (Fig. S2). After determining the saturation
point for fluorescence quenching (Fig. S3), the appropriate
stoichiometries of particle and polymer were mixed in 5 mM
phosphate buffer (pH ϭ 7.4) to yield nanoparticle-PPECO2
complexes with a final concentration of polymer of 100 nM and
of nanoparticles 10–40 nM. The complexes of PPECO2 and
NP1-3 were then incubated with different cell types to determine
changes in fluorescence intensities. We observed increases and
decreases in fluorescence intensities depending on the cell type
and the nature of nanoparticle-polymer complexes. Increased
fluorescence intensities are due to the displacement of the
PPECO2 polymer from the NP-PPECO2 complexes by cell
surfaces (Fig. 1B), whereas decreases in the fluorescence inten-
sities are due to the quenching of the residual PPECO2 fluores-
cence by the cell surfaces. These differences in the fluorescence
patterns depend on the cell type and are reproducible. We have
performed array-based s sensing using 9 gold nanoparticles that
possess different head groups and interact differently with
polymers (Fig. S3a). We studied their interactions with the
different cell types listed in Table 1, focusing on which particle
set can best differentiate between different particles. (see be-
low). From studies, we have observed the maximum differenti-
ation grouping using 3 nanoparticles NP1-NP3, as established
through jackknifed analysis (Fig. S3b).
Detection of Differences in Cell Types. As an initial test of our
method we used 4 different types of human cancer cells: HeLa
(Cervical), HepG2 (Liver), NT2 (Testis) and MCF-7 (Breast).
Fig. 2A presents the change in the fluorescence response for the
nanoparticle-polymer supramolecular complexes upon addition
of the different cancer cell types. Linear Discriminant Analysis
(LDA) was used to statistically characterize the fluorescence
changes. This analysis reduced the size of the training matrix (3
nanoparticles ϫ 4 cell types ϫ 6 replicates) and transformed
them into canonical factors that are linear combinations of the
response patterns (3 factors ϫ 4 cell types ϫ 6 replicates). The
2 canonical factors contain 96.6% and 3.3% of the variation,
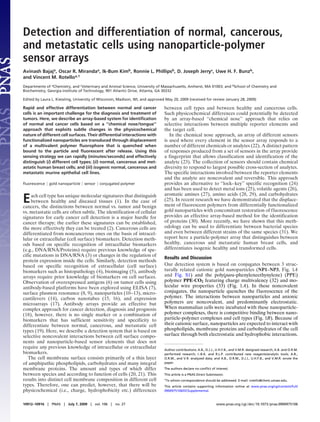
Fig. 1. Molecular structures of nanoparticles and polymers, and schematic of
fluorophore displacement cell detection array. (A) Molecular structures of the
cationic gold nanoparticles (NP1-NP3) and the fluorescent polymer (PPECO2).
(B) Displacement of quenched fluorescent polymer (dark green strips, fluo-
rescence off; light green strips, fluorescence on) by cell (in blue) with concom-
itant restoration of fluorescence.
Table 1. Origin and nature of the normal, cancerous and
metastatic cell lines used in this study.
Cell line Liver HepG2 Cancerous
Human Cervix HeLa Cancerous
Testis NT2 Cancerous
Breast MCF10A Normal immortalized
MCF-7 Cancerous
MDA-MB-231 Metastatic
Mouse BALB/c mice (breast) CDBgeo Normal immortalized
TD Cancerous
V14 Metastatic
Fig. 2. Detection of human cancerous cell lines. (A) Change in fluorescence
intensities (F Ϫ F0) for 4 different cancer cell lines HeLa (Cervical), MCF7
(Breast), HepG2 (Liver) and NT2 (Testes) using nanoparticle-polymer supramo-
lecular complexes. Each value is average of 6 parallel measurements. (B)
Canonical score plot for the two factors of simplified fluorescence response
patterns obtained with NP–PPECO2 assembly arrays against different mam-
malian cell types. The canonical scores were calculated by LDA for the iden-
tification of 4 cell lines.
Bajaj et al. PNAS ͉ July 7, 2009 ͉ vol. 106 ͉ no. 27 ͉ 10913
APPLIEDBIOLOGICAL
SCIENCES
CHEMISTRY
3. respectively as shown in Fig. 2B. In this plot, each point
represents the response pattern for a single cell type to the
NP-PPECO2 sensor array. In the canonical fluorescence re-
sponse patterns, the different cell types are clustered into 4
nonoverlapping groups (95% level confidence ellipses) (Fig. 2B)
with standard deviation of Ͻ5%. These initial results validate
our ability to differentiate cancer cell types phenotypically based
on their surface properties.
Detection of Normal/Cancerous and Metastatic Cells. An important
issue in cancer therapy is assessing whether tissue/cells are
healthy, or either benign or metastatic tumors. We chose 3
different human breast cell lines to test our sensor array in this
application: MCF10A a normal breast cell line, MCF7 a can-
cerous but nonmetastatic cell line, whereas MDA-MB-231 is a
metastatic cancer cell line. The 3 cell lines show differential
fluorescence patterns (Fig. 3A); LDA of their response indicates
a 100% accuracy of detection (Fig. 3B).
Detection of Isogenic Cell Types. The above studies suggest that we
can differentiate normal, cancerous and metastatic cell types
with our sensor array. Each of the 3 cell lines, however, came
from different individuals. To provide a test bed where individ-
ual-to-individual variation is not present, we used 3 isogenic cell
lines, CDBgeo, TD, and V14 cells. Due to their high genetic
similarity, isogenic cells are expected to present a particularly
stringent test for detection assays. Each of these isogenic cells
was developed from BALB/c mice, and therefore possesses the
same genotypic background. CDBgeo cells were prepared by
retroviral infection with a marker gene encoding the fusion of
-galactosidase and neomycin resistance. These cells exhibit
normal outgrowths when transplanted into mammary fat pads
(35). The TD cells were prepared by treating CDBgeo-cells
with 10 ng/mL TGF- for 14 days. Withdrawal for 5 passages
resulted in a persistent epithelial to mesenchymal transforma-
tion: Tumorogenic growth resulted when transplanted. The
V14 cell line was established from a primary mammary tumor
arising in BALB/c-Trp-53ϩ/Ϫ
mice. The cells lack p53 protein
and form aggressive tumors that are locally invasive in mice
(36). Fig. 4A presents the change in fluorescence intensities of
3 isogenic cell types toward nanoparticle-polymer complexes.
The differential response indicates that these supramolecular
complexes can effectively differentiate isogenic cell types.
LDA classifies the cell types into 3 distinct clusters with 2
canonical factors containing 83.0% and 17.0% of the variation, with
100% identification accuracy among these isogenic cell types (Fig.
4B). Taken together, these studies indicate that our method rapidly
and effectively differentiates cell lines based on cell type and disease
state.
The efficacy of our approach indicates that there are distinct
phenotypic differences in the physicochemical properties of
cells. One question that arises is whether there is a response that
is generally indicative of whether a cell is normal or cancerous.
Fig. 3. Detection of normal, cancerous and metastatic human breast cells.
(A) Change in fluorescence intensities (F Ϫ F0) for 3 breast cell lines of different
nature MCF10A (normal), MCF-7 (cancer) and MDA-MB231 (metastatic) using
nanoparticle-polymer supramolecular complexes. Each value is average of 6
parallel measurements. (B) Canonical score plot for the first two factors of
simplified fluorescence response patterns obtained with NP–PPECO2 assembly
arrays against different mammalian cell types.
Fig. 4. Detection of Isogenic cell types. (A) Change in fluorescence intensities
(F Ϫ F0) for 3 cell lines of same genotype CDBgeo, TD cell and V14 using
nanoparticle-polymer supramolecular complexes. Each value is average of 6
parallel measurements. (B) Canonical score plot for the first two factors of
simplified fluorescence response patterns obtained with NP–PPECO2 assembly
arrays against different mammalian cell types.
10914 ͉ www.pnas.org͞cgi͞doi͞10.1073͞pnas.0900975106 Bajaj et al.
4. Metaanalysis of our studies using LDA indicates that normal
epithelial cell lines CDBgeo and MCF10A were overlapping
(Fig. 5a) even though both of these cell lines were isolated from
mouse and human respectively. Likewise the metastatic murine
(V14) and human MDMBA-231 metastatic cell lines were
clustered, indicating a potential correlation between cell surface
properties and disease states of cells.
In summary, we have developed a rapid and effective array-
based approach to differentiate between normal and cancerous
cell lines. Significantly, full differentiation was achieved using
only 3 nanoparticle-polymer dyads, indicating that a simple
sensor array has ample diagnostic capacity when exposed to
mammalian cells. These systems have the potential to help us
understand the physical changes that occur on the surfaces of
cells in various disease states. Taken together, ‘‘nose’’ based
sensor systems are a fundamentally new way of looking into
biodiagnostic, biophysical and surface science processes involv-
ing cell surfaces.
Materials and Methods
Nanoparticles (25, 37, 38) (SI Text, Scheme S1, and Fig. S1) and polymers (39)
were synthesized as reported previously. All of the cells except MCF10A,
CDBgeo, TD and V14 were grown in DMEM media supplemented with 10%
FBS and 1% antibiotics in T75 flasks. NT2 cell line was obtained from R. T.
Zoeller (Department or Biology, University of Massachusetts, Amherst, MA).
CDBgeo, TD and V14 cells were grown in DMEM-F12 media supplemented
with 2% ABS, 25 mM Hepes, 10 g/mL insulin, 5 ng/mL EGF, 15 g/mL
gentamycin. Cells were washed with DPBS buffer, trypsinized with 1ϫ trypsin
and collected in the DMEM media. Fluorescence titration experiments deter-
mined the complexation between nanoparticles and PPECO2. Fluorescence
intensity changes at 465 nm were recorded with an excitation wavelength of
430 nm. Polymer and stoichiometric amounts of NP1–NP3, as determined by
the fluorescence titration study were diluted with phosphate buffer (5 mm,
pH 7.4) to solutions with a final polymer concentration of 100 nM. Each
solution (200 L) was placed into a well on the micro plate. After incubation
for 30 min, the fluorescence intensity at 465 nm was recorded with an
excitation wavelength of 430 nm. Next, 100 L of cell suspension (20,000 cells)
was added to each well. After incubation for another 30 min, the fluorescence
intensity at 465 nm was measured again. The fluorescence intensity before
addition of the cells was subtracted from that obtained after addition of the
cells to record the overall fluorescence response (DI) (Tables S1–S3). This
process was completed for all cell lines to generate 6 replicates of each that
was subjected to a classical linear discriminant analysis (LDA) using SYSTAT
(version 11.0). Each cell line possesses a unique fluorescence response data
with the NP-PPECO2 complex array, because cell interaction with the NP-
PPECO2 complex array depends on the cell surface characteristic. Therefore,
for each cell, we tested its fluorescence responses against 3 NP-PPECO2 adduct
6 times, generating (i) 3 ϫ 6 ϫ 4 matrix for 4 different cancer cell lines HeLa
(Cervical), MCF7 (Breast), HepG2 (Liver) and NT2 (Testes) for Fig. 2, (ii) 3 ϫ 6 ϫ
3 matrix for 3 breast cell lines of different nature MCF10A (normal), MCF-7
(cancer) and MDA-MB231 (metastatic) for Fig. 3, and (iii) 3 ϫ 6 ϫ 3 matrix for
3 cell lines of same genotype CDBgeo, TD cell and V14 for Fig. 4. The raw data
obtained were subjected to Linear Discriminant Analysis (LDA) (40, 41) to
maximize the ratio between-class variance to the within-class variance, thus
differentiate the fluorescence response patterns of the NP-PPECO2 system the
cell targets. This analysis reduced the size of the training matrix and trans-
formed them into canonical factors that are linear combination of the fluo-
rescence response patterns (i) 2 factors ϫ 6 replicates ϫ 4 cell, (ii) 2 factors ϫ
6 replicates ϫ 3 cells, and (iii) 2 factors ϫ 6 replicates ϫ 3 cells, respectively. The
canonical factors contain different percentage of variation and two of them
were plotted in 2D as shown in Figs. 1B and 4B. In a blind experiment, the rates
of fluorescence patterns of new case were first converted to canonical scores
using discriminate functions established on training samples. Then, Mahal-
anobis distances [the distance of a case to the centroid of a group in a
multidimensional space, in the current case it is 2-dimensional (42, 43)] of the
new case to the centroid of respective groups (normal or cancerous or meta-
static cells) of training samples were calculated. The new case was assigned to
the group with shortest Mahalanobis distance. This processing protocol was
performed on the SYSTAT 11 program, allowing the assignment of cells to
specific groups.
ACKNOWLEDGMENTS. We thank Professor R. Thomas Zoeller for providing
the NT2 cell lines. This work was supported by the National Science Foundation
Center for Hierarchical Manufacturing at the University of Massachusetts
Nanoscale Science and Engineering Center and National Science Foundation
Grant DMI-0531171; and National Institutes of Health Grant GM077173; Al-
lergy and Infectious Grant AI073425; Grants R01-CA095164 and R01-
CA105452 (to D.J.J.); and Department of Energy Grant DE-FG02-04ER46141 (to
U.H.F.B., R.L.P., I.-B.K. and V.M.R.).
1. Srinivas PR, Kramer BS, Srivastava S (2001) Trends in biomarker research for cancer
detection. Lancet Oncol 2:698–704.
2. Pantel K, Brakenhoff RH, Brandt B (2008) Detection, clinical relevance and
specific biological properties of disseminating tumour cells. Nat Rev Cancer 8:329–
340.
3. Jen J, Wu L, Sidransky D (2000) An overview on the isolation and analysis of circulating
tumor DNA in plasma and serum. Ann N Y Acad Sci 906:8–12.
4. Skvara H, Teban L, Fiebiger M, Binder M, Kittler H (2005) Limitations of dermoscopy in
the recognition of melanoma. Arch Dermatol 141:155–160.
5. Gao X, Cui Y, Levenson RM, Chung LWK, Nie S (2004) In vivo cancer targeting and
imaging with semiconductor quantum dots. Nat Biotechnol 22:969–976.
6. Borrebaeck C (2006) Antibody microarray-based oncoproteomics. Expert Opin Biol
Ther 6:838.
7. Ward AM, Catto JWF, Hamdy FC (2001) Prostate specific antigen: Biology, biochemistry
and available commercial assays. Ann Clin Biochem 38:633–651.
8. Chou SF, Hsu WL, Hwang JM, Chen CY (2004) Development of an immunosensor for
human ferritin, a nonspecific tumor marker, based on surface plasmon resonance.
Biosens Bioelectron 19:999–1005.
9. Alivisatos P (2004) The use of nanocrystals in biological detection. Nat Biotechnol 22:47–52.
10. Soukka T, et al. (2001) Supersensitive time-resolved immunofluorometric assay of
free prostate-specific antigen with nanoparticle label technology. Clin Chem
47:1269–1278.
Fig.5. Detectionofnormalandcancerouscelllines.(A)Changesinfluorescence
intensities (F Ϫ F0) of noncancerous and cancerous cell types using nanoparticle-
polymer supramolecular complexes. Each value is average of 6 parallel measure-
ments. (B) Canonical score plot for the first two factors of simplified fluorescence
response patterns obtained with NP–PPECO2 assembly arrays against different
normalandcancerouscelltypes.Furtherdifferentiationwasobservedinthethird
dimension, allowing discrimination each of the species.
Bajaj et al. PNAS ͉ July 7, 2009 ͉ vol. 106 ͉ no. 27 ͉ 10915
APPLIEDBIOLOGICAL
SCIENCES
CHEMISTRY
5. 11. Nam JM, Thaxton CS, Mirkin CA (2003) Nanoparticle-based bio-bar codes for the
ultrasensitive detection of proteins. Science 301:1884–1886.
12. Wu G, et al. (2001) Bioassay of prostate-specific antigen (PSA) using microcantilevers.
Nat Biotechnol 19:856–860.
13. Chen RJ, et al. (2003) Noncovalent functionalization of carbon nanotubes for highly
specific electronic biosensors. Proc Natl Acad Sci USA 100:4984–4989.
14. Chen RJ, et al. (2004) An investigation of the mechanisms of electronic sensing of
protein adsorption on carbon nanotube devices. J Am Chem Soc 126:1563–1568.
15. Wang WU, Chen C, Lin KH, Fang Y, Lieber CM (2005) Label-free detection of small-
molecule-protein interactions by using nanowire nanosensors. Proc Natl Acad Sci USA
102:3208–3212.
16. Cui Y, Wei Q, Park H, Lieber CM (2001) Nanowire nanosensors for highly sensitive and
selective detection of biological and chemical species. Science 293:1289–1292.
17. Campagnolo C, et al. (2004) Real-Time, label-free monitoring of tumor antigen and
serum antibody interactions. J Biochem Biophys Methods 61:283–298.
18. Wingren C, Borrebaeck CA (2008) Antibody microarray analysis of directly labelled
complex proteomes. Curr Opin Biotech 18:55–61.
19. Sanchez-Carbayo M (2006) Antibody arrays: Technical considerations and clinical
applications in cancer. Clin Chem 52:1651–1659.
20. Singer SJ, Nicolson GL (1972) The fluid mosaic model of the structure of cell mem-
branes. Science 175:720–731.
21. Alberts B, Johnson A, Lewis J (2002) in Molecular Biology of the Cell (Garland
Publishing, New York) 4th Ed.
22. Lavigne JL, Anslyn EV (2001) Sensing a paradigm shift in the field of molecular
recognition: From selective to differential receptors. Angew Chem Int Ed 40:3118–
3130.
23. Albert KJ, et al. (2000) Cross-reactive chemical sensor arrays. Chem Rev 100:2595–2626.
24. Wright AT, Anslyn EV (2006) Differential receptor arrays and assays for solution-based
molecular recognition. Chem Soc Rev 35:14–28.
25. Lee JW, Lee JS, Chang YT (2006) Colorimetric identification of carbohydrates by a pH
indicator/pH change inducer ensemble. Angew Chem Int Ed 45:6485–6487.
26. Rakow NA, Suslick KS (200) A colorimetric sensor array for odour visualization. Nature
406:710–713.
27. Greene NT, Shimizu KD (2005) Colorimetric molecularly imprinted polymer sensor
array using dye displacement. J Am Chem Soc 127:5695–5700.
28. Folmer-Andersen JF, Kitamura M, Anslyn EV (2006) Pattern-based discrimination of
enantiomeric and structurally similar amino acids: An optical mimic of the mammalian
taste response. J Am Chem Soc 128:5652–5653.
29. Buryak A, Severin K (2005) A chemosensor array for the colorimetric identification of
20 natural amino acids. J Am Chem Soc 127:3700–3701.
30. You CC, et al. (2007) Detection and identification of proteins using nanoparticle-
fluorescent polymer ‘‘chemical nose’’ sensors. Nat Nanotechnol 2:318–323.
31. Phillips RL, Miranda OR, You CC, Rotello VM, Bunz UH (2008) Rapid and efficient
identification of bacteria using gold-nanoparticle-poly(para-phenyleneethynylene)
constructs. Angew Chem Int Ed 47:2590–2594.
32. Kim IB, Erdogan B, Wilson JN, Bunz UHF (2004) Sugar-poly(para-phenylene ethynylene)
conjugates as sensory materials: Efficient quenching by Hg2ϩ and Pb2ϩ. Chem Eur J
10:6247–6254.
33. Zhou Q, Swager TM (1995) Fluorescent chemosensors based on energy migration in
conjugated polymers: The molecular wire approach to increased sensitivity. J Am Chem
Soc 117:12593–12602.
34. Phillips RL, et al. (2009) Gold nanoparticle-PPE constructs as biomolecular material
mimics: Understanding the electrostatic and hydrophobic interactions. Soft Matter
5:607–612.
35. Deugnier MA, et al. (2006) Isolation of mouse mammary epithelial progenitor cells with
basal characteristics from the Comma-Dbeta cell line. Dev Biol 293:414–425.
36. Blackburn AC, et al. (2004) Loss of heterozygosity occurs via mitotic recombination in
Trp53ϩ/Ϫ mice and associates with mammary tumor susceptibility of the BALB/c strain.
Cancer Res 64:5140–5147.
37. Brust M, Walker M, Bethell D, Schiffrin DJ, Whyman R (1994) Synthesis of thiol-
derivatised gold nanoparticles in a two-phase liquid–liquid system. J Chem Soc Chem
Commun 801–802.
38. Hostetler MJ, Templeton AC, Murray RW (1999) Dynamics of place-exchange reactions
on monolayer-protected gold cluster molecules. Langmuir 15:3782–3789.
39. Kim IB, Dunkhorst A, Gilbert J, Bunz (2005) Sensing of lead ions by a carboxylate-
substituted PPE: Multivalency effects. Macromolecules 38:4560–4562.
40. Engelman L (2004) In Systat 11.0, Statistics (SYSTAT Software, Chicago), pp i301–
i358.
41. Jurs PC, Bakken GA, McClelland HE (2000) Computational methods for the analysis of
chemical sensor array data from volatile analytes. Chem Rev 100:2649–2678.
42. Mahalanobis PC (1936) On the generalised distance in statistics. Proc Natl Inst Sci India
2:49–55.
43. Gnanadesikan R, Kettenring JR (1972) Robust estimates, residuals, and outlier detec-
tion with multiresponse data. Biometrics 28:81–124.
10916 ͉ www.pnas.org͞cgi͞doi͞10.1073͞pnas.0900975106 Bajaj et al.
6. Detection and identification of proteins
using nanoparticle–fluorescent polymer
‘chemical nose’ sensors
CHANG-CHENG YOU1
, OSCAR R. MIRANDA1
, BASAR GIDER1
, PARTHA S. GHOSH1
, IK-BUM KIM2
,
BELMA ERDOGAN1, SAI ARCHANA KROVI1, UWE H. F. BUNZ2 AND VINCENT M. ROTELLO1
*
1
Department of Chemistry, University of Massachusetts, 710 North Pleasant Street, Amherst, Massachusetts 01003, USA
2
School of Chemistry and Biochemistry, Georgia Institute of Technology, 770 State Street, Atlanta, Georgia 30332, USA
*e-mail: rotello@chem.umass.edu
Published online: 22 April 2007; doi:10.1038/nnano.2007.99
A sensor array containing six non-covalent gold nanoparticle–fluorescent polymer conjugates has been created to detect, identify
and quantify protein targets. The polymer fluorescence is quenched by gold nanoparticles; the presence of proteins disrupts the
nanoparticle–polymer interaction, producing distinct fluorescence response patterns. These patterns are highly repeatable and
are characteristic for individual proteins at nanomolar concentrations, and can be quantitatively differentiated by linear
discriminant analysis (LDA). Based on a training matrix generated at protein concentrations of an identical ultraviolet
absorbance at 280 nm (A280 5 0.005), LDA, combined with ultraviolet measurements, has been successfully used to identify 52
unknown protein samples (seven different proteins) with an accuracy of 94.2%. This work demonstrates the construction of
novel nanomaterial-based protein detector arrays with potential applications in medical diagnostics.
The presence of certain biomarker proteins and/or irregular protein
concentrations is a sign of cancer and other disease states1,2
.
Sensitive, convenient and precise protein-sensing methods
provide crucial tools for the early diagnosis of diseases and
successful treatment of patients. However, protein detection is a
challenging problem owing to the structural diversity and
complexity of the target analytes. At present, the most extensively
used detection method for proteins is the enzyme-linked
immunosorbent assay (ELISA)3
. In this system, the capture
antibodies immobilized onto surfaces bind the antigen through a
‘lock–key’ approach, and another enzyme-coupled antibody is
combined to react with chromogenic or fluorogenic substrates to
generate detectable signals. Despite its high sensitivity, the
application of this method is restricted because of its high
production cost, instability and challenges regarding quantification.
Although synthetic systems would alleviate some of these concerns,
obtaining high affinity and specificity remains quite challenging.
The ‘chemical nose/tongue’ approach provides an alternative
for the sensing protocols that use exclusive analyte–receptor
binding pairs as its basis4
. In this strategy, a sensor array
featuring selective receptors, as opposed to ‘lock–key’ specific
recognition, is used for analyte detection. Strategically, the array
is able to present chemical diversity to respond differentially to a
variety of analytes. Over the past few years, this approach has
been used to detect a wide range of analytes, including metal
ions5, volatile agents6, aromatic amines7, amino acids8,9 and
carbohydrates10,11
. There have been preliminary studies into the
application of this strategy to protein sensing, including
Hamilton’s porphyrin-based sensors, which are used to identify
four metal- and non-metal-containing proteins12,13
, and Anslyn’s
use of 29 boronic acid-containing oligopeptide functionalized
resin beads to differentiate five proteins and glycoproteins
through an indicator-uptake colorimetric analysis14.
The first key challenge for the development of effective protein
sensors is the creation of materials featuring appropriate surface
areas for binding protein exteriors, coupled with the control of
structure and functionality required for selectivity. Nanoparticles
provide versatile scaffolds for targeting biomacromolecules that
have sizes commensurate with proteins15–17
, a challenging
prospect with small molecule-based systems. Moreover, the self-
assembled monolayer on these systems allows facile tuning of a
range of surface properties in a highly divergent fashion, enabling
diverse receptors to be rapidly and efficiently produced. For
example, charged ligand-protected clusters can effectively
recognize the protein surface through complementary
electrostatic and hydrophobic interactions18–20
.
The second challenge in protein sensing is the transduction
of the binding event. Our strategy for the creation of protein
sensors is to use the particle surface for protein recognition,
with displacement of a fluorophore generating the output.
As depicted in Fig. 1a, the nanoparticles associate with charge-
complementary fluorescent dyes to produce quenched complexes.
The subsequent binding of protein analytes displaces the dyes,
regenerating the fluorescence. By modulating the nanoparticle–
protein and/or nanoparticle–dye association, distinct signal
response patterns can then be used to differentiate the proteins
(Fig. 1b). The fluorescent indicator displacement assay does not
require special instruments, and its sensitivity (due in large part
to the high surface area provided by the nanoparticles) and speed
facilitate protein detection.
ARTICLES
nature nanotechnology | VOL 2 | MAY 2007 | www.nature.com/naturenanotechnology318
7. In the current study, we used six readily fabricated structurally
related cationic gold nanoparticles (NP1–NP6) to create protein
sensors (Fig. 2a). These particles serve as both selective
recognition elements as well as quenchers for the polymer. For
our studies, we chose gold rather than other potential core
materials (such as silver) because of its extraordinary stability,
in particular its resistance to exchange by amines (for
example, lysine residues)21
and strong quenching ability22
.
The nanoparticle end groups carry additional hydrophobic,
aromatic or hydrogen-bonding functionality engineered to tune
nanoparticle–polymer and nanoparticle–protein interactions.
For the fluorescent transduction element we used a highly
fluorescent poly(p-phenyleneethynylene) (PPE)23,24
derivative,
PPE-CO2 (ref. 25), as a fluorescence indicator. Seven proteins
with diverse structural features including molecular weight and
isoelectric point (pI) were used as the target analytes (Fig. 2b).
Using these components, we created a competent sensor array,
rendering distinct fluorescence response fingerprints for
individual proteins. LDA was performed to identify the protein
patterns with a high degree of accuracy.
RESULTS AND DISCUSSION
Fluorescence titration was first conducted to assess the
complexation between anionic PPE-CO2 and cationic gold
nanoparticles NP1–NP6. The intrinsic fluorescence of PPE-CO2
was significantly quenched and slightly blue-shifted on addition
of all nanoparticles (Fig. 3 for NP3; for the other nanoparticles,
see Supplementary Information, Fig. S1). The absorption effect
of gold cores was obtained through control experiments using
neutral particles26
, and the normalized fluorescence intensities of
PPE-CO2 at 465 nm were subsequently plotted versus the ratio of
nanoparticle to polymer. The complex stability constants (KS)
and association stoichiometries (n) were obtained through
nonlinear least-squares curve-fitting analysis (Table 1)19. Complex
stabilities vary within approximately one order of magnitude
(DDG % 6 kJ mol2 1
), and the binding stoichiometry ranges
from 0.8 for NP6 to 2.9 for NP2. These observations indicate
a
b A
1
2
3
4
B C E F GD
Figure 1 Fluorophore displacement protein sensor array. a, Displacement of
quenched fluorescent polymer (dark green strips, fluorescence off; light green
strips, fluorescence on) by protein analyte (in blue) with concomitant restoration
of fluorescence. The particle monolayers feature a hydrophobic core for stability,
an oligo(ethylene glycol) layer for biocompatibility, and surface charged residues
for interaction with proteins. b, Fluorescence pattern generation through
differential release of fluorescent polymers from gold nanoparticles. The wells on
the microplate contain different nanoparticle–polymer conjugates, and the
addition of protein analytes produces a fingerprint for a given protein.
a
b
S O O
N
R9 3
Au
S
O
O N R
9
3
S
O
O
N
R
9
3
CH3NP1: R =
CH2CH3NP2: R =
(CH2)5CH3NP3: R =
CH(CH2)5NP4: R =
CH2C6H5
NP5: R =
(CH2)3OHNP6: R =
BSA
(pI=4.8, 66.3kDa)
β-galactosidase
(pI = 4.6, 540 kDa)
Cytochrome c
(pI=10.7, 12.3kDa)
Lipase
(pI=5.6, 58kDa)
Acid phosphatase
(pI=5.2, 110kDa)
Alkaline phosphatase
(pI=5.7, 140kDa)
Subtilisin A
(pI=9.4, 30.3kDa)
PPE-CO2
O
O–Na+
O
O–Na+
O
O
m
Nanoparticle
Figure 2 Structural features of nanoparticles, polymer transducer and
target analytes. a, Chemical structure of cationic gold nanoparticles (NP1–NP6)
and anionic fluorescent polymer PPE-CO2 (m % 12, where m refers to the
number of repeated units in the polymer). b, Surface structural feature and
relative size of seven proteins and the nanoparticles used in the sensing study.
Colour scheme for the proteins: nonpolar residues (grey), basic residues (blue),
acidic residues (red) and polar residues (green).
ARTICLES
nature nanotechnology | VOL 2 | MAY 2007 | www.nature.com/naturenanotechnology 319
8. that the subtle structural changes of nanoparticle end groups
significantly affect their affinity for the polymer. Significantly, all
particle–polymer conjugates were optically transparent over the
concentration range studied.
Once the different binding characteristics of PPE-CO2 with
NP1–NP6 were established, the particle–polymer conjugates were
used to sense proteins. The proteins were chosen to have a variety
of sizes and charges, with pI of the seven proteins varying from 4.6
to 10.7 and molecular weights ranging from 12.3 to 540 kDa.
Within this set there were several pairs of proteins having
comparable molecular weights and/or pI values, providing a
challenging testbed for protein discrimination. In the initial
sensing study, 200 ml of PPE-CO2 (100 nM) and stoichiometric
nanoparticles NP1–NP6 (the stoichiometric values were taken
from Table 1) were loaded onto 96-well plates for recording the
initial fluorescence intensities at 465 nm. Under these conditions, it
is estimated that .80% of polymer is bound to the nanoparticles,
based on the binding constants listed in Table 1, allowing
fluorescent enhancement through subsequent displacement.
As illustrated in Fig. 4a, addition of aliquots of protein (5 mM)
resulted in a variety of fluorescence responses. By contrast, the
addition of proteins (5 mM) into PPE-CO2 (100 nM) induced
only marginal fluorescence changes (see Supplementary
Information, Fig. S2), confirming the disruption of
nanoparticle–PPE-CO2 interactions by proteins. BSA, b-
galactosidase, acid phosphatase and alkaline phosphatase induced
different levels of fluorescence increase, and cytochrome c, the
only metal-containing protein, further attenuated the
fluorescence of the systems, presumably through an energy or
electron transfer process27
. Lipase and subtilisin A had smaller,
but still significant, fluorescence changes for most nanoparticle–
PPE systems. Notably, each protein possesses a unique response
pattern. Such an outcome is reasonable, because their interaction
with the protein-detecting array is dependent on surface
characteristics such as the distribution of hydrophobic, neutral
and charged amino-acid residues. For each protein, we tested
its fluorescence responses against the six nanoparticle–PPE
assemblies six times, generating a 6 Â 6 Â 7 matrix.
The raw data obtained were subjected to LDA to differentiate
the fluorescence response patterns of the nanoparticle–PPE
a
b
BSA CC β-Gal Lipase PhosA PhosB
–200
0
200
400
600
800
1,000
ΔI(a.u.)
Proteins
NP1
NP2
NP3
NP4
NP5
NP6
SubA
–25 0 25 50
–10
–5
0
5
10
β-Galactosidase
Subtilisin A
Alkaline phosphatase
Acid phosphatase
Lipase
Cytochrome c
BSA
Factor (1), 96.4%
Factor(2),1.9%
Figure 4 Array-based sensing of protein analytes at 5 mM. a, Fluorescence
response (DI ) patterns of the NP–PPE sensor array (NP1–NP6) against various
proteins (CC, cytochrome c; b-Gal, b-galactosidase; PhosA, acid phosphatase;
PhosB, alkaline phosphatase; SubA, subtilisin A). Each value is an average of six
parallel measurements. b, Canonical score plot for the first two factors of
simplified fluorescence response patterns obtained with NP–PPE assembly
arrays against 5 mM proteins. The canonical scores were calculated by LDA for
the identification of seven proteins. The 95% confidence ellipses for the
individual proteins are also shown.
0.0 0.5 1.0 1.5 2.0
0.0
0.2
0.4
0.6
0.8
1.0
445 495 545 595
0.0
0.2
0.4
0.6
0.8
1.0
λ (nm)
I(a.u.)
[NP3]/[PPE-CO2]
I(a.u.)
Figure 3 Fluorescence intensity changes for PPE-CO2 (100 nM) at 465 nm
on addition of cationic NP3. To eliminate the absorption effect of the gold
core, the fluorescence intensity was calibrated in the presence of relevant
concentrations of tetra(ethylene glycol)-functionalized gold nanoparticles, which
do not associate with PPE-CO2. The inset shows the fluorescence spectra and
the images of PPE-CO2 solution before and after addition of NP3. The arrow in
the inset indicates the direction of spectral changes.
Table 1 Binding constants (logKS) and binding stoichiometries (n ) between
polymer PPE-CO2 and various cationic nanoparticles (NP1–NP6) as determined
from fluorescence titration.
Nanoparticle KS (108
M21
) 2DG (kJ mol21
) n
NP1 3.0 48.4 2.0
NP2 2.1 47.5 2.9
NP3 1.7 47.0 1.5
NP4 21.0 53.2 1.8
NP5 3.6 48.8 2.4
NP6 25.0 53.6 0.8
ARTICLES
nature nanotechnology | VOL 2 | MAY 2007 | www.nature.com/naturenanotechnology320
9. systems against the different protein targets28
. LDA is used in
statistics to recognize the linear combination of features that
differentiate two or more classes of object or event. It can
maximize the ratio of between-class variance to the within-class
variance in any particular data set, thereby enabling maximal
separability. This analysis reduced the size of the training matrix (6
nanoparticles  7 proteins  6 replicates) and transformed them
into canonical factors that are linear combinations of the
response patterns (5 factors  7 proteins  6 replicates). The five
canonical factors contain 96.4%, 1.9%, 0.8%, 0.6% and 0.3% of
the variation, respectively. The first two factors were visualized in
a two-dimensional plot as presented in Fig. 4b. In this plot, each
point represents the response pattern for a single protein to the
nanoparticle–PPE sensor array.
The canonical fluorescence response patterns of 5 mM proteins
against the nanoparticle–PPE sensor array are clustered to seven
distinct groups according to the protein analyte, with no overlap
between the 95% confidence ellipses. This result demonstrates
that LDA allows the discrimination of very subtle differences in
protein structure. Moreover, LDA provides in-depth quantitative
analysis of the fluorescence responses of protein analytes. The
assignment of the individual case was based on its Mahalanobis
distances to the centroid of each group in a multidimensional
space, as the closer a case is to the centroid of one group,
the more likely it is to be classified as belonging to that group.
The 42 training cases (7 proteins  6 replicates) can be totally
correctly assigned to their respective groups using LDA, giving
100% accuracy. Furthermore, another 56 protein samples were
prepared randomly and used as unknowns in a blind experiment,
where the individual performing the analysis did not know the
identity of the solutions. During LDA analysis, the new cases
were classified to the groups generated through the training
matrix according to their Mahalanobis distances. Of 56 cases, 54
were correctly classified, affording an identification accuracy of
96.4%. This result confirms not only the reproducibility of our
fluorescence patterns, but also the feasibility of practical
application of such a nanoparticle-conjugated polymer sensor
array in detection and identification of proteins.
Real-world applications, however, require identification of
proteins at varying concentrations. Varying protein
concentrations would be expected to lead to the drastic alteration
of fluorescence response patterns for the proteins, making
identification of proteins with both unknown identity and
concentration challenging. To enable the detection of unknown
proteins, we have designed a protocol combining LDA and
ultraviolet (UV) measurements. In this approach, a set of
fluorescence response patterns were generated at analyte protein
concentrations that generated a standard UV absorption value at
280 nm (A280 ¼ 0.005), the lowest concentration for which the
proteins could be substantially differentiated using the given
sensor array followed by LDA. Therefore, this concentration
could also be treated as the detection limit of this assay, with
molar concentrations ranging from 4 nM for b-galactosidase to
215 nM for cytochrome c (see Fig. 5 for other proteins). In our
unknown identification protocol, the A280 value of the protein
was determined, and an aliquot subsequently diluted to A280 ¼
0.005 for recording the fluorescence response pattern against the
NP–PPE sensing array. Once the identity of the protein was
established by LDA, its initial concentration could be determined
from the initial A280 value and corresponding molar extinction
coefficient (1280) according to the Beer–Lambert law.
The fluorescence response patterns where the protein
concentration is A280 ¼ 0.005 are distinctly different from those
generated from 5 mM of proteins, but retain a high degree of
reproducibility (Fig. 5a; see also Supplementary Information,
Table S2). As before, LDA accurately differentiates the protein
patterns. As shown in Fig. 5b, the canonical fluorescence
response patterns display excellent separation, except for a minor
overlap between lipase and subtilisin A. According to the Jack-
knifed classification matrix (the classification matrix with cross-
validation) in the LDA results, only one subtilisin A sample is
misclassified, affording a classification accuracy of 97.6%
(41/42). As a control, analogous analyses were performed using
polymer ([PPE-CO2] ¼ 100 nM) in the absence of nanoparticles.
These studies show that the polymer itself can only substantially
differentiate cytochrome c (ref. 27), the metalloprotein, from the
other proteins (see Supplementary Information, Fig. S3). For the
other six proteins, only 50% classification accuracy is obtained
on the basis of six replicates of measurement, only modestly
higher than the statistical possibility (that is, 17%). A further
a
b
–20 –10 0 10 20
Factor (1), 81.5%
–15
–5
5
15
Factor(2),17.0%
β-Galactosidase
BSA
Acid phosphatase
Alkaline phosphatase
Cytochrome c
Subtilisin A
Lipase
BSA CC β-Gal Lipase PhosA PhosB SubA
–200
–150
–100
–50
0
50
100
150
Proteins
ΔI(a.u.)
NP1
NP2
NP3
NP4
NP5
NP6
Figure 5 Array-based sensing of protein analytes with identical absorbance
at 280 nm. a, Fluorescence response (DI ) patterns of the NP–PPE sensor array.
b, Canonical score plot for the first two factors of simplified fluorescence
response patterns obtained with NP–PPE assembly arrays against proteins with
identical absorption values of A ¼ 0.005 at 280 nm. The canonical scores were
calculated by LDA for the identification of seven proteins, with 95% confidence
ellipses for the individual proteins shown. [BSA] ¼ 110 nM; [cytochrome c] ¼
215 nM; [b-galactosidase] ¼ 4 nM; [lipase] ¼ 90 nM; [acid phosphatase] ¼
20 nM; [alkaline phosphatase] ¼ 80 nM; [Subtilisin A] ¼ 190 nM.
ARTICLES
nature nanotechnology | VOL 2 | MAY 2007 | www.nature.com/naturenanotechnology 321
10. in-depth examination on the classification accuracy of the polymer
in the absence and presence of individual nanoparticles revealed
that the particle–polymer conjugates generally afforded better
differentiation abilities than the polymer alone (see
Supplementary Information, Tables S3 and S4), demonstrating
the role of the nanoparticle in providing the differentiation
between proteins required for effective sensing.
A series of unknown protein solutions were subsequently used
for quantitative detection. To facilitate solution preparation and
UV measurement, the unknown proteins were prepared at
varying concentrations (between 120 nM and 50 mM). In
principle, lower concentrations can also be used because the
detection limit of this method is nanomolar. The unknown
protein solutions were submitted to the testing procedures,
including determination of A280, dilution of solution to A280 ¼
0.005, fluorescence response recording against the sensor array,
and LDA. Of the 52 unknown protein samples, only three
samples were incorrectly identified, affording an identification
accuracy of 94.2% (see Supplementary Information, Table S5, for
original data). In addition, the protein concentration was
assessed generally within +5% once it was identified (see
Supplementary Information, Table S5). This result
unambiguously manifests that our sensor array holds substantial
promise for both the identification and quantification of
protein analytes.
In conclusion, we have demonstrated that the assemblies of
gold nanoparticles with fluorescent PPE polymer provide
efficient sensors of proteins, achieving both the detection and
identification of analytes. This strategy exploits the size and
tunability of the nanoparticle surface to provide selective
interactions with proteins, and the efficient quenching of
fluorophores by the metallic core to impart efficient transduction
of the binding event. Through application of LDA, we are able to
use these fluorescence changes to identify and quantify proteins
in a rapid, efficient and general fashion. The robust
characteristics of the nanoparticle and polymer components,
coupled with diversity of surface functionality that can be readily
obtained using nanoparticles, make this array approach a
promising technique for biomedical diagnostics.
METHODS
Carboxylate-substituted PPE (PPE-CO2) was synthesized according to a known
procedure25
. The weight- and number-averaged molecular weights of the
polymer are 6,600 and 3,500, respectively. The polydispersity index and degree of
polymerization of the conjugated polymer are 1.88 and 12, respectively. Thiol
ligands bearing ammonium end groups were synthesized through the reaction of
1,1,1-triphenyl-14,17,20,23-tetraoxa-2- thiapentacosan-25-yl
methanesulphonate with corresponding substituted N,N-dimethylamines
followed by deprotection in the presence of trifluoroacetic acid and
triisopropylsilane. Subsequent place-exchange reaction with pentanethiol-coated
gold nanoparticles (d % 2 nm)29 resulted in cationic gold nanoparticles NP1–
NP6 in high yields. 1
H NMR spectroscopic investigation revealed that the place-
exchange reaction proceeds almost quantitatively and the coverage of cationic
ligands on the nanoparticles is near unity. Bovine serum albumin, cytochrome c
(from horse heart), b-galactosidase (from E. coli), lipase (from Candida rugosa),
acid phosphatase (from potato), alkaline phosphatase (from bovine intestinal
mucosa) and subtilisin A (from Bacillus licheniformis) were purchased from
Sigma-Aldrich and used as received. Phosphate buffered saline (PBS, pH 7.4,
Â1) was purchased from Invitrogen and used as the solvent throughout the
fluorescence assays.
In the fluorescence titration study, fluorescence spectra were measured in a
conventional quartz cuvette (10 Â 10 Â 40 mm) on a Shimadzu RF-5301 PC
spectrofluorophotometer at room temperature ($25 8C). During the titration,
2 mL of PPE-CO2 (100 nM) was placed in the cuvette and the initial emission
spectrum was recorded with excitation at 430 nm. Aliquots of a solution of PPE-
CO2 (100 nM) and nanoparticles were subsequently added to the solution in the
cuvette. After each addition, a fluorescence spectrum was recorded. The
normalized fluorescence intensities calibrated by respective controls
(tetra(ethylene glycol)-functionalized neutral nanoparticle with the same core)
at 465 nm were plotted against the molar ratio of nanoparticle to PPE-CO2.
Nonlinear least-squares curve-fitting analysis was conducted to estimate the
complex stability as well as the association stoichiometry using a calculation
model in which the nanoparticle is assumed to possess n equivalent and
independent binding sites19
.
In the protein sensing study, fluorescent polymer PPE-CO2 and
stoichiometric nanoparticles NP1–NP6 (determined by fluorescence titration;
Table 1) were placed into six separate glass vials and diluted with PBS buffer to
afford mixture solutions where the final concentration of PPE-CO2 was 100 nM.
Then, each solution (200 ml) was respectively loaded into a well on a 96-well
plate (300 ml Whatman Glass Bottom microplate) and the fluorescence intensity
value at 465 nm was recorded on a Molecular Devices SpectraMax M5 micro
plate reader with excitation at 430 nm. Subsequently, 10 ml of protein stock
solution (105 mM) was added to each well (final concentration 5 mM), and the
fluorescence intensity values at 465 nm were recorded again. The difference
between two reads before and after addition of proteins was treated as the
fluorescence response. This process was repeated for seven protein targets to
generate six replicates of each. Thus, the seven proteins were tested against the
six-nanoparticle array (NP1–NP6) six times, to give a 6 Â 6 Â 7 training data
matrix. The raw data matrix was processed using classical LDA in SYSTAT
(version 11.0). Similar procedures were also performed to identify 56 randomly
selected protein samples.
In the studies featuring unknown analyte protein concentrations, the sensor
array was tested against seven proteins (A280 ¼ 0.005) six times to generate the
training data matrix. Fifty-two unknown protein solutions were subjected
successively to UVabsorption measurement at 280 nm, dilution to A280 ¼ 0.005,
fluorescence response pattern recording against the sensor array, and LDA. After
the protein identity was recognized by LDA, the initial protein concentration, c,
was deduced from the A280 value and corresponding molar extinction coefficient
(1280) on the basis of the Beer–Lambert law (c ¼ A280/(1280l)). In the
experimental setup, the protein samples were randomly selected from the seven
protein species and the solution preparation, data collection and LDA analysis
were performed by different persons.
Received 16 January 2007; accepted 14 March 2007; published 22 April 2007.
References
1. Daniels, M. J., Wang, Y., Lee, M.-Y. & Venkitaraman, A. R. Abnormal cytokinesis in cells deficient in
the breast cancer susceptibility protein BRCA2. Science 306, 876–879 (2004).
2. Ross, J. S. & Fletcher, J. A. The HER-2/neu oncogene in breast cancer: prognostic factor, predictive
factor, and target for therapy. Stem Cells 16, 413–428 (1998).
3. Haab, B. B. Applications of antibody array platforms. Curr. Opin. Biotechnol. 17, 415–421 (2006).
4. Albert, K. J. et al. Cross-reactive chemical sensor arrays. Chem. Rev. 100, 2595–2626 (2000).
5. Lee, J. W., Lee, J. S., Kang, M., Su, A. I. & Chang, Y. T. Visual artifical tongue for quantitative metal-
cation analysis by an off-the-shelf dye array. Chem. Eur. J. 12, 5691–5696 (2006).
6. Rakow, N. A. & Suslick, K. S. A colorimetric sensor array for odour visualization. Nature 406,
710–713 (2000).
7. Greene, N. T. & Shimizu, K. D. Colorimetric molecularly imprinted polymer sensor array using dye
displacement. J. Am. Chem. Soc. 127, 5695–5700 (2005).
8. Folmer-Andersen, J. F., Kitamura M. & Anslyn E. V. Pattern-based discrimination of enantiomeric
and structurally similar amino acids: an optical mimic of the mammalian taste response. J. Am.
Chem. Soc. 128, 5652–5653 (2006).
9. Buryak, A. & Severin, K. A chemosensor array for the colorimetric identification of 20 natural amino
acids. J. Am. Chem. Soc. 127, 3700–3701 (2005).
10. Wright, A. T. & Anslyn, E. V. Differential receptors arrays and assays for solution-based molecular
recognition. Chem. Soc. Rev. 35, 14–28 (2006)
11. Lee, J. W., Lee, J.-S. & Chang, Y.-T. Colorimetric identification of carbohydrates by a pH
indicator/pH change inducer ensemble. Angew. Chem. Int. Edn 45, 6485–6487 (2006).
12. Baldini, L., Wilson, A. J., Hong, J. & Hamilton, A. D. Pattern-based detection of different proteins
using an array of fluorescent protein surface receptors. J. Am. Chem. Soc. 126, 5656–5657 (2004).
13. Zhou, H., Baldini, L., Hong, J., Wilson, A. J. & Hamilton, A. D. Pattern recognition of proteins based
on an array of functionalized porphyrins. J. Am. Chem. Soc. 128, 2421–2425 (2006).
14. Wright, A. T. et al. Differential receptors create patterns that distinguish various proteins. Angew.
Chem. Int. Edn 44, 6375–6378 (2005).
15. You, C.-C., Verma, A. & Rotello, V. M. Engineering the nanoparticle–biomacromolecule interface.
Soft Matter 2, 190–204 (2006).
16. Rosi, N. L. & Mirkin C. A. Nanostructures in biodiagnostics. Chem. Rev. 105, 1547–1562 (2005).
17. Katz, E. & Willner I. Integrated nanoparticle–biomolecule hybrid systems: synthesis, properties, and
applications. Angew. Chem. Int. Edn 43, 6042–6108 (2004)
18. Fischer, N. O., McIntosh, C. M., Simard, J. M. & Rotello V. M. Inhibition of chymotrypsin through
surface binding using nanoparticle-based receptors. Proc. Natl Acad. Sci. USA 99, 5018–5023 (2002)
19. You, C.-C., De, M., Han, G. & Rotello V. M. Tunable inhibition and denaturation of a-chymotrypsin
with amino acid-functionalized gold nanoparticles. J. Am. Chem. Soc. 127, 12873–12881 (2005).
20. Bayraktar, H., Ghosh, P. S., Rotello, V. M. & Knapp, M. J. Disruption of protein–protein
interactions using nanoparticles: inhibition of cytochrome c peroxidase. Chem. Commun.
1390–1392 (2006).
ARTICLES
nature nanotechnology | VOL 2 | MAY 2007 | www.nature.com/naturenanotechnology322
11. 21. Nath, S. et al. Is gold really softer than silver? HSAB principle revisited. J. Nanoparticle Res. 8,
111–116 (2006).
22. Fan, C. et al. Beyond superquenching: hyper-efficient energy transfer from conjugated polymers to
gold nanoparticles. Proc. Natl Acad. Sci. USA 100, 6297–6301 (2003).
23. Bunz, U. H. F. Synthesis and structure of PAEs. Adv. Polym. Sci. 177, 1–52 (2005).
24. Zheng, J. & Swager, T. M. Poly(arylene ethynylene)s in chemosensing and biosensing. Adv. Polym.
Sci. 177, 151–179 (2005).
25. Kim, I.-B., Dunkhorst, A., Gilbert, J. & Bunz, U. H. F. Sensing of lead ions by a carboxylate-
substituted PPE: multivalency effects. Macromolecules 38, 4560–4562 (2005).
26. Aguila, A. & Murray, R. W. Monolayer-protected clusters with fluorescent dansyl ligands. Langmuir
16, 5949–5954 (2000).
27. Sandanaraj, B. S., Demont, R., Aathimanikandan, S. V., Savariar, E. N. & Thayumanavan, S. Selective
sensing of metalloproteins from nonselective binding using a fluorogenic amphiphilic polymer.
J. Am. Chem. Soc. 128, 10686–10687 (2006).
28. Jurs, P. C., Bakken, G. A. & McClelland, H. E. Computational methods for the analysis of chemical
sensor array data from volatile analytes. Chem. Rev. 100, 2649–2678 (2000).
29. Brust, M., Walker, M., Bethell, D., Schiffrin, D. J. & Whyman, R. Synthesis of thiol-derivatised
gold nanoparticles in a two-phase liquid-liquid system. J. Chem. Soc., Chem. Commun.
801–802 (1994).
Acknowledgements
This work was supported by the National Science Foundation (NSF) Center for Hierarchical
Manufacturing at the University of Massachusetts (NSEC, DMI-0531171), the NSF (VR, CHE-0518487),
and the NIH (GM077173). U.B. and I.B.K. thank the Department of Energy for generous financial
support (DE-FG02-04ER46141).
Correspondence and requests for materials should be addressed to V.M.R.
Supplementary information accompanies this paper on www.nature.com/naturenanotechnology.
Competing financial interests
The authors declare no competing financial interests.
Reprints and permission information is available online at http://npg.nature.com/reprintsandpermissions/
ARTICLES
nature nanotechnology | VOL 2 | MAY 2007 | www.nature.com/naturenanotechnology 323