SlideShare a Scribd company logo
1 of 26
Download to read offline
1
The Influence of Human Physical Activity and
Contaminated Clothing Type on Particle Resuspension
A. McDonagha,*
and M. A. Byrnea
a
School of Physics and C-CAPS, The Ryan Institute,
National University of Ireland Galway (NUIG), Ireland.
*Corresponding author details:
Name: Dr Ann McDonagh
Postal address: Pathogen Control Engineering (PaCE) Institute, School of Civil Engineering,
University of Leeds, Leeds LS2 9JT, United Kingdom.
Telephone: +44 (0) 113 343 1957
Fax: +44 (0) 113 343 2265
Email: mcdonagh.ann@gmail.com; A.McDonagh@leeds.ac.uk
2
Abstract
A study was conducted to experimentally quantify the influence of three variables on the level
of resuspension of hazardous aerosol particles from clothing. Variables investigated include
physical activity level (two levels, low and high), surface type (four different clothing material
types), and time i.e. the rate at which particles resuspend. A mixture of three monodisperse
tracer-labelled powders, with median diameters of 3, 5, and 10 microns, was used to
“contaminate” the samples, and the resuspended particles were analysed in real-time using an
Aerodynamic Particle Sizer (APS), and also by Neutron Activation Analysis (NAA).
The overall finding was that physical activity resulted in up to 67 % of the contamination
deposited on clothing being resuspended back into the air. A detailed examination of the
influence of physical activity level on resuspension, from NAA, revealed that the average
resuspended fraction (RF) of particles at low physical activity was 28 ± 8 %, and at high
physical activity was 30 ±7 %, while the APS data revealed a tenfold increase in the
cumulative mass of airborne particles during high physical activity in comparison to that
during low physical activity. The results also suggest that it is not the contaminated clothing's
fibre type which influences particle resuspension, but the material's weave pattern (and hence
the material's surface texture). Investigation of the time variation in resuspended particle
concentrations indicated that the data were separable into two distinct regimes: the first
(occurring within the first 1.5 minutes) having a high, positive rate of change of airborne
particle concentration relative to the second regime. The second regime revealed a slower rate
of change of particle concentration and remained relatively unchanged for the remainder of
each resuspension event.
Keywords
Resuspension; Human physical activity; Clothing; Hazardous aerosol particles;
Contamination; Shedding.
3
1. Introduction
Following an accidental or deliberate release of hazardous materials, such as radioactive
(e.g. Fukushima) or infectious species (e.g. H1N1 virus) to the atmosphere, there is a risk of
exposure of large population groups and individual persons who reside both indoors and
outdoors. In preparing for this scenario, accurate estimates of whole body exposure arising
from all exposure pathways are necessary in order to design effective countermeasures.
Current dosimetric models, for example, that of Andersson et al. (2004), focus on aerosol
inhaled while initially airborne, with some reference to particles deposited on the human
body, but secondary exposure and inhalation is not considered. One secondary exposure
pathway that merits investigation, and for which no comprehensive experimental data are
available, is re-exposure to aerosol contaminant that was formerly deposited on clothing and
other indoor surfaces. This is especially important in the case where a person might be
unwittingly contaminated and might spread this contamination to others via the process of
resuspension. These exposure pathways may also have significance for airborne pollutants
that are nonradioactive, e.g. infectious aerosol that becomes re-entrained from disturbance of
hospital bedding, etc.
Numerically, resuspension rates are low relative to deposition rates (e.g. Thatcher and
Layton, 1995) but the concentration of resuspended contaminated particles can significantly
influence a persons‟ exposure. The size distribution of resuspended particles is different from
the size distribution of depositing particles, with larger particles being more readily
resuspended (Andersson et al., 2004, Ferro et al., 2004).
A wide range of contaminated surfaces have been investigated in the context of particle
resuspension due to human physical activity, but resuspension studies focus on quantifying the
level of resuspension from flooring surfaces (Ferro et al, 2004, Long et al, 2000, Abt et al,
4
2000); contamination on, and its removal from, clothing surfaces has received little attention,
apart from a few studies in the medical devices and cleanroom industry (Cohen and Positao,
1986; Bohne and Cohen, 1985). The removal of particles from human skin has been
investigated; Hession et al (2006) studied the effect of human body hair on particle fall-off and
concluded that hairy skin retained particles for longer periods. To supplement the existing
knowledge base, the aim of the present study is to quantify the level of resuspension of
hazardous particles directly from clothing surfaces worn by a physically active human, who is
engaging in various levels of typical daily physical activity. Earlier studies have generally
determined particle resuspension rates and factors based on changes in the total airborne
particulate concentrations, which is not chemically specific and so could not directly isolate the
resuspended particles from others that were airborne. While the current study also uses this
accepted experimental method, an additional and more comprehensive method, using Neutron
Activation Analysis (NAA), will be used to calculate the fraction of originally deposited
particles which resuspended, directly from the clothing surface.
2. Materials and Methods
A summary of the experimental strategy for studying particle resuspension from clothing
surfaces is as follows: the material surfaces to be „contaminated‟ were first exposed to aerosol
particles in the form of tracer labelled silica powder. They were subsequently attached to a
volunteer who engaged in a predefined physical activity for a specified length of time.
Samples of the material were analysed both before and after the resuspension process to
determine the proportion of the original deposited mass which became resuspended. The air
in the resuspension chamber was continuously monitored to determine the size spectrum of
resuspended particles in the air.
5
2.1 Aerosol Particles
The particles used throughout these experiments were monodisperse silica particles (Alltech)
labelled with a rare earth metal tracer. Three particle sizes, with manufacturer specified mean
diameters of 3 µm, 5µm and 10 µm, were chosen for their similarity to that of the refractory
group of radioactive aerosols released into the atmosphere following a nuclear explosion and
also to that of some biological species e.g. anthrax. It is important to note that although the
particles were monodisperse, each batch of particles will have a size distribution about their
mean diameter. The three sizes were labelled with Europium (EuCl3), Dysprosium (DyCl3)
and Indium (InCl3) respectively following the method described by Jayasekera et al. (1989).
For Dysprosium, the average labelling yield was 5.20 mg of Dy on 1 g of labelled silica. To
reduce the number of experimental replications that needed to be carried out and also the cost
of analysis, the three particle sizes were mixed together for deposition onto the surfaces for
all experiments.
2.2 Aerosol Deposition
All clothing samples to be used in the resuspension experiments were first contaminated with
the silica particles in a 2.25 m3
aluminium deposition chamber. Inside the chamber a small 2W
fan was mounted 0.2 m from the chamber ceiling (chamber height = 1.5 m), centrally aligned
and orientated vertically downwards, to simulate real room mixing conditions. An Aerodynamic
Particle Sizer (APS) was operational during the deposition events.
The particles were injected into the chamber using a dry powder particle generator (Palas
RBG-1000) located on the roof of the chamber. In all cases, the aerosol was passed through a
tube containing an array of 12 x 33 KBq Am241 radioactive sources; using the calculations
6
of Cooper and Reist (1973) it was estimated that, for the aerosol flow rate used, the ratio of
the residence time of the aerosol in the tube and the characteristic source strength used was
greater than unity, so that aerosol charge equilibrium would be reached.
Before commencing the „contamination‟ of fabric samples, the floor of the deposition chamber
was analysed for any variations in the spatial uniformity of particle deposition; a variation of
only 9 % was observed over a central floor area of 43 x 76 cm.
2.3 Clothing Surfaces
As the human body is typically covered with some degree of clothing, four common clothing
materials were chosen for the experiments: cotton, polyester, fleece and denim. The chosen
materials consisted of natural and synthetic fibres with smooth and rough surface textures.
The natural fibre used was a 100 % cotton material. It had the same tight weave pattern as the
100 % polyester material which is a synthetic fibre, as observed by electron microscopy.
Fleece is also made from 100 % polyester but has a much rougher surface texture resulting
from the disordered nature of the weave. A denim material was chosen due to its popularity
as a clothing textile and the particular denim used in this work consisted of 65 % cotton, 32
% polyester and 3 % spandex. As these materials were composed of different fibres and
colours, they were pre-tested by Neutron Activation Analysis (NAA) to ensure they did not
contain elements that would interfere with the analysis of the tracer particles to be deposited
onto them.
7
Figure 1. Specific locations of contaminated samples on volunteer
Large samples of each material type were contaminated for each experimental run. This was to
ensure there would be a sufficient level of contaminant available on the volunteer during the
resuspension process, to be resuspended and thus captured by the aerosol sampling equipment.
Contaminated material samples were placed onto the volunteers‟ legs, arms and chest, as can be
seen in figure 1. The leg pieces were 25 x 40 cm and were wrapped around each lower leg, thus
covering almost all of the lower legs (front and back) between the knee and ankle. The chest
piece was 20 x 20 cm and the arm pieces were 15 x 30 cm, one each on the outer arm between
the shoulder and elbow. The clothing samples had safety pins attached to their corners before
contamination. This was to facilitate quick and easy attachment of the contaminated samples to
the volunteer (by an assistant), with a minimum of disturbance to the samples themselves. Each
of the large clothing samples also had two smaller pieces of the same material (ranging from 1
x 4 cm to 2 x 5 cm, depending on the material type) pinned onto them before contamination.
These were both analysed by NAA, one before and one after the resuspension process, for
reasons which will be discussed in section 2.5. The size of the NAA capsules restricted the
8
size of material sample which could be analysed.
2.4 Aerosol Resuspension
After contamination, the clothing samples were placed into individual, sealed and labelled
plastic containers and transported to the vicinity of the resuspension chamber, a purpose-built
15 m3
plywood test room. Inside the chamber were two APS‟s, one at ankle height (15 cm
from the floor) and the other at waist height (90 cm from the floor). In the centre of the
chamber floor was a grounded metal plate upon which the volunteer stood while performing
the experiment. This was to ensure that any static charge generated by the movement of the
volunteers‟ feet, would not influence the behaviour of the resuspended particles. Also, the
smooth surface texture of the metal made it easier to ensure complete decontamination
between experiments.
Directly outside the chamber, the volunteer dressed in a clean room suit (Macrobond hooded
coverall from Caulfield Industrial), booties (Polylatex shoecover 4 g from Caulfield
Industrial), gloves (powder free purple nitrile) and a mask (8835 FFP3D disposable mask
from Anderco Safety). The cleanroom suit was chosen for its nonlinting and anti-static
properties, so that it can be assumed that any airborne particles detected by the APS‟s were as
a result of particles resuspending from the contaminated material and not from the
volunteer‟s personal clothing. An assistant then carefully removed one of the four types of
„contaminated‟ clothing samples from their boxes and pinned them to the volunteer‟s clean
room suit. The placing of clothing samples over the clean room suit will generate an effect
similar to that of a person wearing multiple layers of clothing (denim jeans over underwear,
jumper over t-shirt etc.).
9
When fully attired and with samples attached, the volunteer entered the resuspension chamber
and participated in one of two pre-defined physical activity patterns: low physical activity –
walking at a pre-defined rate for 20 minutes, or high physical activity – Irish dancing to a Reel
(Wikipedia, accessed Nov 2011) with added swinging of the arms for 10 minutes (chosen to
facilitate the accurate reproduction of movement in each repeated experiment). The duration
of the resuspension event for high physical activity was half that for low physical activity as
the level of physical exertion required was not possible to keep constant over a longer period
of time. The volunteer then exited the chamber and the assistant removed the clothing
samples and placed them back into their individual boxes. The resuspension chamber and all
equipment were thoroughly cleaned between experiments by washing with water and using
alcohol wipes. Additionally, a multi-functional air purifier (model XJ-3000C by Heaven
Fresh) with a HEPA filter, carbon filter, ioniser and sanitiser was operational between
experiments, to ensure the air was completely devoid of any tracer particles.
2.5 Analysis
The primary aerosol measuring instrument used in this study was the Aerodynamic Particle
Sizer (APS) [Model 3321 by Trust Science Innovation (TSI)]. The APS sizes airborne
particles in the range of 0.5 to 20 µm in aerodynamic diameter. Throughout these
experiments, the concentration and size distribution of the airborne particles in both the
deposition and resuspension chambers were continuously measured in real time using the
APS‟s. The second analysis technique employed was Neutron Activation Analysis (NAA).
The surfaces contaminated with labelled silica were analysed by NAA at the Reactor Institute
in the Delft University of Technology, the Netherlands. NAA allows discrete sampling of
elements as it disregards the chemical form of a sample, and focuses solely on its nucleus.
10
0
2
4
6
Mass
Concentration
(M)
[µg/m3]
Time [hh:mm:ss]
The three rare earth metal labels used in these experiments have a half-life of 9.3 h, 2.3 h and
54 min for Eu, In and Dy respectively and they decay as follows: 151
Eu (+ neutron) = 152m
Eu
(- γ) = 152
Gd, 164
Dy (+ neutron) = 165
Dy (- γ) = 165
Ho, 115
In (+ neutron) = 116m
In (- γ) = 116
Sn.
The third analysis technique used was Scanning Electron Microscopy (SEM).
3. Results and Discussion
3.1 Airborne mass concentration variation with time, during resuspension
Figure 2. Mass concentration of airborne particles during resuspension due to (a) low
physical activity and (b) high physical activity, as a function of time
Figure 2 indicates the change in particle mass concentration with time (as detected by an APS
in the resuspension chamber) before, during and after a person wearing contaminated
0
10
20
30
00:00:00 00:07:12 00:14:24 00:21:36 00:28:48 00:36:00 00:43:12
(a) Low Physical Activity
(b) High Physical Activity
11
clothing is engaging in (a) low physical activity and (b) high physical activity. Each data
point represents the cumulative sum of the airborne mass concentration over all particle sizes,
at a particular second and the trendline indicates the one minute average. The vertical dashed
lines indicate the instances when the contaminated person entered and exited the resuspension
chamber i.e. the start and end of the resuspension event. During low physical activity, the
contaminated person was physically active within the resuspension chamber for 20 minutes
and for 10 minutes during high physical activity.
It is clear from figure 2(a), that there is an immediate and steady increase in airborne particle
concentration from the moment the person enters the chamber. The averaged cumulative
concentration reaches a peak of 2.26 µg m-3
just 1.5 minutes after the resuspension event
begins. The particle concentration then rapidly decreases to 1.81 µg m-3
in a further 30
seconds. After that point (2 minutes into the resuspension event) the airborne particle
concentration slowly decreases. A linear trendline (best fit to data) plotted to the airborne
particle concentration readings for the last 18 minutes of the resuspension event indicates a
decreasing slope: i.e. a decrease in the rate of change in airborne particle concentration of -
0.026 ± 0.002 µg m-3
min-1
.
The pattern shown in figure 2(b) is similar to figure 2(a): there is an immediate and steady
increase in airborne particle concentration from the moment the person enters the chamber.
However, the difference in pattern for figure 2(b) is that the airborne particle concentration
now continually increases throughout the entire 10 minutes of the resuspension event. The
peak averaged concentration of approximately 23.2 µg m-3
occurs at the end of the
resuspension event, just as the contaminated volunteer exits the chamber.
The rate of change of airborne particle concentration during resuspension for both physical
activity levels can be split into two separate regimes, the first occurring during the initial 1.5
12
minutes, and the second over the remainder of the resuspension event. For the first regime -
during the first 1.5 minutes of the resuspension event - both physical activity levels result in an
increase in airborne particle concentration but high physical activity results in a rate of
increase four times that corresponding to low physical activity, i.e. 4.5 ± 0.5 µg m-3
min-1
and
1.1 ± 0.2 µg m-3
min-1
, respectively.
For the second regime – during the remaining period of each resuspension event – the change
in airborne particle concentration shows an opposing trend for low compared to high physical
activity levels. During low physical activity, the particle concentration decreases at a
comparatively slow rate of - 0.026 ± 0.002 µg m-3
min-1
, while it increases and at a more
rapid rate of 1.00 ± 0.03 µg m-3
min-1
during high physical activity.
Wu et al. (1992) noted a very similar pattern in resuspension with time when examining the
resuspension of uranine particles, polymer microspheres, lycopodium spores and Johnson grass
pollen from glass, plexiglass and white oak leaves at windspeeds of 4 to 8 ms-1
. They
concluded that the resuspension rates varied over time, defined by two separate regimes. The
first regime occurred in the first minute of resuspension and was characterised by higher
resuspension rates (0.17 s-1
). After the first minute, particles which are easily resuspended had
been removed, leaving only particles with much smaller resuspension rates (0.029 s-1
) for the
second regime. The noting of two resuspension regimes is identical to this current study and
also the time frame for the first regime is similar, with Wu et al. (1992) noting 1 minute and
this study observing 1.5 minutes. However the slower resuspension rate during the second
regime as determined by Wu et al. (1992) is comparable only to the decrease in the rate of
change of airborne particle concentration detected in this study at low physical activity. High
physical activity resulted in an increase in the rate of change of airborne concentration during
the duration of the second regime (albeit at a slower rate in comparison to the first regime).
13
Hession et al. (2006) compared the clearance of fluorescent 3 and 10 µm particles from skin
during two different activity levels: low activity where the volunteer remained seated indoors,
and high activity where the volunteer engaged in vigorous outdoor walking in dry, breezy
conditions. The rates of clearance of particles from the skin with time during low activity was
shown to follow an exponential pattern, however a very different clearance pattern was
displayed during high activity. Based on figure 3.3 in Hession et al. (2006), during high
activity, the mass of particles remaining on the volunteer‟s skin reduced by approximately 88
% in the first 30 minutes and then remained approximately constant for the remaining 170
minutes. This again displays a two regime removal of particles from a surface with time and
also exhibits a difference in the particle clearance pattern between two different physical
activity levels. This will be elaborated upon in the section 3.2.
3.2 Resuspension with varied physical activity level
The purpose of this section is to examine the resuspended fraction (RF) data for each particle
size, at low and high physical activity levels. The RF is calculated by measuring the difference
in mass concentration of particles deposited on the material sample before and remaining on the
material sample after the period of resuspension, as a percentage of the mass concentration
deposited on the material sample before resuspension. The data is averaged over all
contaminated material types. Low physical activity consisted of walking for 20 minutes. High
physical activity was representative of running and simulated by modified Irish dancing to a
Reel for 10 minutes, as described in section 2.4.
The NAA data indicates that the fraction of particles which are resuspended from the clothing
of a person engaged in low physical activity ranges from 8 to 52 %, with an average RF
14
across all sized particles of 28 ± 8 %. During high physical activity, between 3 and 67 % of
particles formerly deposited on various clothing types was found to resuspend, with an
average RF value across all particle sizes of 30 ± 7 %. A two-tailed paired T-test shows that
the difference between the average resuspended fraction (averaged over all particle sizes and
material types) at low and high physical activity level is not statistically significant.
Figure 3 shows the average size distribution of particles in the air surrounding a contaminated
person engaging in either low (blue diamonds) or high (red circles) physical activity, as
measured by an APS at waist height. The mass distribution is calculated by averaging the
total concentration per second in each size range, over the entire physical activity (i.e.
resuspension) duration: 20 minutes for low and 10 minutes for high physical activity. This is
calculated for each repeated experiment and for each material type (i.e. 16 individual
experiments) and an overall average is obtained for each physical activity level.
Figure 3. Size distributions of particles during low and high physical activity
The sum of the mass concentration of airborne particles over all particle sizes during low
physical activity is 1.72 µg m-3
and during high physical activity is 16.93 µg m-3
. This is
0
0.2
0.4
0.6
0.8
1
1.2
1.4
1.6
0 5 10 15 20 25
Mass
Distribution
(dM/dlogDp)
[µg/m3]
Aerodynamic Diameter (Dp) [µm]
High Physical Activity
Low Physical Activity
15
almost a tenfold increase in the cumulative mass of airborne particles during high physical
activity in comparison to that during low physical activity. This difference is statistically
significant, with a p-value of 0.000001 based on a two tailed, paired student t-test. Therefore,
within the range of particle sizes measured, and between these two physical activity levels,
there is a significant difference in the mass of airborne particles resuspended from a
contaminated persons‟ clothing. However, this conclusion is drawn from the APS data and
appears to contradict the results from the NAA data. This apparent contradiction is due to the
capturing of different features of the resuspension process by the two different analytical
techniques, as discussed below.
The APS data shows the airborne mass concentration as a function of particle size and thus
measures all particles that are airborne, regardless of their origin. NAA data are used to
determine the resuspended fraction (RF), which is calculated by measuring the difference in
mass concentration of particles deposited on the material sample before and remaining on the
material sample after the period of resuspension, as a percentage of the mass concentration
deposited on the material sample before resuspension. Hence the concentration of particles
remaining on a sample after resuspension is the key variable in determining the resuspended
fraction from that sample. However, this value may be higher than expected due to an
unquantified number of particles remaining on that sample after the resuspension event,
caused mainly by three processes which are described below.
The first contributor to a higher than expected mass concentration of particles remaining on
the material sample after the resuspension event is impaction of resuspended particles back
onto the material sample. During resuspension, the volunteer wearing the contaminated
clothing is moving vigorously on a fixed position on the floor for a period of time. Thus some
particles which are initially resuspended may be re-deposited onto the clothing sample due to
16
impaction, as the body part is moved through the „cloud‟ of resuspended particles. The
movement of a body part through a particle-laden airstream which results in impaction, is
analogous to the process of particle impaction when a moving particle-laden airstream
encounters a stationary object – this process has been well described (e.g. Golovin and
Putnam, 1962, Hinds, 1999, Lange, 1995, and Ranz and Wong, 1952).
The second contributor is enhanced deposition due to both increased air velocities around the
moving person and the rate of displacements of the body parts (and hence the material
samples) themselves. Wu et al. (1992) concluded that, once particles are resuspended from
their residing surface, their trajectories depend on the characteristics of the turbulent air flow
and not on the initial velocity of the particle. The resuspended particles in this study will have
a high velocity due to the increased air velocity caused by the physical movement of the
contaminated volunteer. Rim and Novoselac (2009) examined the influence of localised arm
movement on air velocities using a mechanical manikin sitting on a chair and the hands were
subjected to large and small motion. The large motion was a periodic rotation of the entire
arms back and forth by ± 30º (represents active hand movement e.g. filing), the small motion
was a periodic up and down rotation of the elbow by ± 10º (represents limited hand
movements e.g. typing). They concluded that physical activity of the manikin does
significantly affect the air velocity at 20 cm above the floor but does not largely affect the
air velocity above the head and also that large motion has a greater affect than does small
motion. Bjorn and Nielsen (2002) also investigated the influence of the physical activity of a
manikin in a room and found that a larger degree of air mixing occurred in the room with the
moving manikin than with a stationary one. The volunteer in the current experiments is
moving at a fast pace, for example, during high physical activity (modified Irish dancing)
the volunteer jumps from one leg to the other at an average rate of 55 jumps per minute
which corresponds to a rate of leg displacement of approximately 0.75 m s-1
and a rate of
17
arm displacement of approximately 0.5 m s-1
. This movement will undoubtedly increase the
air movement around the active contaminated person and thus increase the resuspended
particles‟ velocity which will lead to enhanced deposition back onto the contaminated
material as the material is repeatedly moved through the „cloud‟ of resuspended particles.
The third contributor is the penetration of resuspended particles deep into the weave of the
material. Because of the particles‟ increased velocities when they redeposit, they will have an
increased kinetic energy and hence may penetrate deeper into the weave pattern of the
material. These particles will therefore be more difficult to re-resuspend. This point will be
elaborated in section 3.3.
As a consequence of the above three events occurring during resuspension, the mass of
particles calculated to be on the clothing sample after the period of resuspension may be
higher than would be the case if all particles which initially resuspended were removed and
not available to re-deposit. Therefore a lower RF than is actually the case is calculated but it
should be noted that this RF is representative of a real-life scenario where impaction and
secondary resuspension would be continuously occurring.
The rate of recapture is difficult to quantify, as it is dependent on a number of variables
including: air velocity, target velocity, particle size and Stokes number, the boundary layer
thickness and Reynolds number. The impact efficiency onto a cylinder for particles with very
small Stokes numbers (as is the case here) is difficult to assess as these particles are
extremely sensitive to the boundary layer very close to the cylinder (Haugen and Kragset,
2010). According to figure 3 of Wessel and Righi (1988), for a eynolds number of zero (in
this experiment, e . around the arm) and a Stokes number of 1.5, the target efficiency
will be 50 %. The APS data indicates a 10 fold increase in the mass of airborne particles but
only a two fold increase in the number of airborne particles, during low and high physical
18
activity. Hence, a greater proportion of the smaller particles are being recaptured by the
clothing, particularly at higher physical activity levels. This is due to the smaller particles
being more likely to remain in the air streams created by the moving body part and thus being
intercepted by the body part moving back through the same air location. The bigger particles
will leave the air streams and move away from the body part, and are more likely to be
captured by the APS or deposit to the floor etc. This is confirmed by the NAA data, where the
RF increases with increasing particle size at both physical activity levels but to a greater
extent at high physical activity (this will be discussed in greater detail in a succeeding journal
article).
3.3 Resuspension with varied contaminated clothing material type
Four different material types were investigated – cotton, polyester, fleece and denim. Each
material type was contaminated and worn by a volunteer engaging in physical activity. The
concentration of particles resuspended from each material type was investigated, with each
material type experiment repeated four times and an average distribution calculated. This was
possible as the consistency between data derived from repeated experiments using any one
material type was high (all p values ≥ .17, i.e. no significant difference).
Figure 4 shows the average mass distribution of airborne particles as a function of particle
size, for each material type. The average mass distribution is averaged over the entire
resuspension process (10 mins at high physical activity) and over all four repeated
experiments of each material type. The size distribution curve for particles resuspended from
fleece is represented with blue diamonds, polyester with red squares, denim with green
triangles and cotton with yellow circles.
19
Figure 4. Size distribution curve of particles resuspended from all four material types,
during high physical activity
From figure 4 it can be seen that the size distribution curve for particles resuspended from fleece
corresponds to a higher mass concentration than that for the three other material types. The
cumulative mass concentration of particles of all sizes resuspended from fleece is 26.28 µg m-3
,
from cotton is 15.13 µg m-3
, from polyester is 13.47 µg m-3
and from denim is 12.84 µg m-3
.
Analysing the distributions using a student t-test (two tailed, two samples of equal variance)
identifies fleece as being significantly different from the distributions of all other material types,
with p = 0.02, 0.01 and 0.04 between fleece and polyester, denim and cotton, respectively.
However, the distributions of polyester, denim and cotton are not significantly different from
each other.
The above finding is confirmed using the data analysed by NAA for the same set of data
(figure 4). The average RF for fleece is 41 ± 10 %, for polyester is 31 ± 7 %, for denim is 28
± 4 % and for cotton is 25 ± 5 %. Using the same statistical test as was used for the APS data,
the resuspended fraction of original contaminant from fleece and fleece alone is significantly
0
0.5
1
1.5
2
2.5
0 5 10 15 20 25
Mass
Distribution
(dM/dlogDp)
[µg/m3]
Aerodynamic Diameter (Dp) [µm]
Fleece
Polyester
Denim
Cotton
20
different from that of each of the three other contaminated material types, with p = 0.03,
0.005 and 0.001 between fleece and polyester, denim and cotton, respectively.
The above finding may be explained by considering the varied surface texture of the material
types. The synthetic fleece used in these experiments is made from 100 % polyester as is the
polyester material. However the weave pattern is very different for both material types, as
confirmed using SEM imagery (figure 5). The polyester material has a very uniform and tight
weave pattern (which, as an aside, is found to be very similar to the weave pattern for
membrane collection filters, described by Bénesse et al., 2006) while the fleece is more
irregular and loose.
Figure 5. SEM images showing the weave pattern of: (a) polyester (b) fleece (c) cotton and
(d) denim. Each image is taken at 80 or 90 times magnification and the scale at the bottom
right corner is 500 µm.
Although the majority of deposited particles reside in a monolayer on the surface layer of
(a) (b)
(c) (d)
21
the material (as verified using SEM imagery of contaminated surfaces), some particles
deposited onto the polyester surface penetrate into the crevices between weave strands and
could potentially be trapped there (due to the tightness of the weave) and thus be harder to
resuspend. An example of particles deposited deep into the weave can be seen in figure 6.
This could account for the degree of resuspension of particles from polyester, cotton and
denim (all with the same weave pattern) to be lower than that from fleece.
Figure 6. SEM image of particles deposited deep into the weave (circled areas) of
contaminated polyester
The APS results in figure 4 and the succeeding discussion of the related NAA data, also
indicate that the fibre used to make the cloth or material does not significantly affect
resuspension, as the polyester and cotton materials used in these experiments were found
statistically to have the same level of resuspension from them. While they are made from
different fibres - polyester is synthetic and cotton is natural - they both have the same weave
22
pattern. This indicates that it is the surface texture roughness and not material type, which is
the more important factor in relation to the resuspension of hazardous aerosol particles from
clothing surfaces.
Previous findings indicate that increasing surface texture roughness results in lower amounts
of particle resuspension, for example, Wu et al. (1992), Braun et al. (2002), Hession et al.
(2006) and Andersson et al. (2004), and this appears to contradict the findings in the present
work. However, the apparent discrepancy can be explained by considering the relative
significance of macroscopic and microscopic features of the fabric. Macroscopically, fleece
would have a rougher surface texture than polyester and should therefore demonstrate a lower
resuspended fraction which it does not. However, microscopically, the polyester material has a
rougher surface texture than the fleece material, due to their respective weave patterns. If one
considers that penetration and settling of particles deep into the weave of the clothing fabric
(which is occurring in the current experiments due to the increased air velocities around the
volunteer from of their physical movement and also due to impaction of airborne particles
back onto the clothing samples), then the significance of the microscopic features of the
fabric can be realised.
One parameter which may have an influence on particle behavior but which was not
investigated in these experiments is static charge. The electrostatic forces associated with
surface residing particles, can both aid and hinder particle resuspension and are dependent on
a number of factors including the composition of the material subjected to friction, the
amount of friction or surface agitation, and the relative humidity of the ambient air.
23
4. Conclusions
The influence of human physical activity level on particle resuspension from clothing was
examined using two analysis techniques: Neutron Activation Analysis (NAA) and
Aerodynamic Particle Sizing (APS). The NAA data showed that the average resuspended
fraction (RF) of particles at low physical activity was 28 ± 8 %, and at high physical activity
was 30 ± 7 %, a statistically insignificant difference. In contrast, the APS data revealed a
statistically significant tenfold increase in the cumulative mass of airborne particles during
high physical activity in comparison with that during low physical activity. While both
techniques indicate an increase in resuspension with increasing physical activity level, the
difference in terms of statistical significance is attributed to the two analysis techniques
capturing different aspects of the resuspension process, as discussed in section 3.2.
In respect to the influence of the contaminated surface type on particle resuspension, the
results obtained indicate that it is not the contaminated clothing‟s fibre type which influences
particle resuspension, but the material‟s weave pattern (and hence the material‟s surface
texture). Fleece was found to exhibit the highest levels of particle resuspension (cotton,
denim and polyester showed no significant difference), as particles did not become trapped
deep within the weave pattern of the material and were thus relatively easily released from
the non-uniform weave, when the material was subjected to agitation.
An investigation of the change in airborne mass concentrations with time, due to the
resuspension of particles from contaminated clothing, revealed that the data was separable
into two distinct regimes: the first having a high, positive rate of change of airborne particle
concentration relative to the second regime, and occurring within the first 1.5 minutes of the
beginning of the resuspension event. The second regime revealed a slower rate of change of
particle concentration and remained relatively unchanged for the remainder of each
24
resuspension event.
In conclusion, based on the variables investigated in this study, the conditions for which the
highest fraction of initially deposited particles became resuspended were during the wearing
of contaminated clothing of fleece material by a person engaged in a high level of physical
activity, and during the first 1.5 minutes of that activity. The finding that physical activity can
cause up to 67 % of contamination formerly deposited on clothing to be resuspended back
into the air implies that the transport process of resuspension is of considerable importance
for accurate determination of human exposure risks.
5. Acknowledgements
This work has been sponsored by the Radiological Protection Institute of Ireland (RPII) and
supported by the European Commission under the 7th
Framework Programme through the
'Research Infrastructures' action of the 'Capacities' Programme, Contract No: CP-CSA_INFRA-
2008-1.1.1 Number 226507-NMI3. Support was also received from The Aerosol Society in the
form of a research scholarship: The C.N. Davies award.
25
6. References
Abt, E., Suh, H. H., Catalano, P. and Koutrakis, P., 2000. Relative Contribution of Outdoor
and Indoor Particle Sources to Indoor Concentrations. Environ. Sci. Technol. 34, 3579-
3587.
Andersson, K. G., Roed, J., Byrne, M. A., Hession, H., Clark, P., Elahi, E., et al., April 2004.
Airborne contamination in the indoor environment and its implications for dose. Riso
National Laboratory, Roskilde. Riso-R-1462(EN). Contract No.: FIKR-CT-2000-
00043. ISSN: 0106-2840. ISBN: 87-550-3318-0 (internet).
Bénesse, M., Coq, L. L. and Solliec, C., 2006. Collection efficiency of a woven filter made of
multifiber yarn: Experimental characterization during loading and clean filter modeling
based on a two-tier single fiber approach. J. Aerosol Sci. 37, 974-989.
Bohne, J.E. and Cohen, B.S., 1995. Aerosol Resuspension from Fabric: Implications for
Personal Monitoring in the Beryllium Industry. A.I.H.A. J. (Fairfax, Va). 46, 73-79.
Braun, W. X , Cicciarelli, B. A., Davidson, D. L., Hart, E. H., Luedtke, A., McIntosh, K., and
Peoples, P. R., 2002. Indoor pollutant measurement and modeling, comparing impact of
surface characteristic. Proceedings of Indoor Air 2002, the 9th International Conference
on Indoor Air Quality and Climate, Monterey, CA. 885–890.
Cohen, B. S. and Positano, R., 1986. Resuspension of Dust From Work Clothing as a Source
of Inhalation Exposure. A.I.H.A. J. (Fairfax, Va). 47, 255-258.
Cooper, D.W. and Reist, P.C., 1973. Neutralizing charged aerosols with radioactive sources.
J. Colloid Interface. Sci. 45, 17-26.
Ferro, A. R., Kopperud, R. J. and Hildemann, L. M., 2004. Source Strengths for Indoor
Human Activities that Resuspend Particulate Matter. Environ. Sci. Technol. 38, 1759-
1764.
Golovin, M. N., and Putnam, A. A., 1962. Inertial Impaction on Single Elements. Ind. Eng.
Chem. Res. 1, 264-273.
Haugen, N. E. L. and Kragset, S., 2010. Particle impaction on a cylinder in a crossflow as
function of Stokes and Reynolds numbers. J. Fluid Mech. 661, 239-261.
Hession, H., Byrne, M., Cleary, S., Andersson, K. G. and Roed, J., 2006. Measurement of
contaminant removal from skin using a portable fluorescence scanning system. J.
Environ. Radioact. 85, 196-204.
Hinds, W. C., 1999. Aerosol Technology: Properties, behaviour, and measurement of
airborne particles, second ed. A Wiley-Interscience Publication. ISBN 0-471-19410-7.
Jayasekera, P. N., Watterson, J. D., Bell, J. N., Goddard, A. J. H., Minski, M. J., Apsimon, H.
M., and Taylor-Russell, A. J., 1989. Aerosols containing activatable tracers for wind
tunnel studies. Proceedings of the 2nd Annual Conference of the Aerosol Society. 107–
26
112.
Lange, C., 1995. Indoor deposition and the protective effect of houses against airborne
pollution [Ph.D. thesis]. Technical University of Denmark, DTU. Riss-R- 78O(en).
ISBN 87-550-2024-0.
Long, C. M., Suh, H. H. and Koutrakis, P., 2000. Characterization of indoor particle sources
using continuous mass and size monitors. J. Air Waste Manage. Assoc. 50, 1236-1250.
Ranz, W. E. and Wong, J. B., 1952. Impaction of Dust and Smoke Particles on Surface and
Body Collectors. Ind. Eng. Chem. 44, 1371-1381.
Rim, D. and Novoselac, A., 2009. Transport of particulate and gaseous pollutants in the
vicinity of a human body. Build. Environ. 44, 1840-1849.
Thatcher, T. L. and Layton, D. W., 1995. Deposition, resuspension, and penetration of
particles within a residence. Atmos. Environ. 29, 1487-1497.
Wessel, R.A. and Righi, J., 1988. Generalized Correlations for Inertial Impaction of Particles
on a Circular Cylinder. Aerosol Sci. Technol. 9, 29-60.
Wikipedia, http://en.wikipedia.org/wiki/Reel (dance), accessed Nov 19th
, 2011.
Wu, Y.-L., Davidson, C. I. and Russell, A. G., 1992. Controlled Wind Tunnel Experiments
for Particle Bounceoff and Resuspension. Aerosol Sci. Technol. 17, 245-262.

More Related Content

What's hot

Effect of Stone Crusher on Ambient Air Quality
Effect of Stone Crusher on Ambient Air QualityEffect of Stone Crusher on Ambient Air Quality
Effect of Stone Crusher on Ambient Air QualityIRJET Journal
 
An overview on_biofiltration_modeling
An overview on_biofiltration_modelingAn overview on_biofiltration_modeling
An overview on_biofiltration_modelingAvi Kumar
 
Assessment of Natural Radioactivity in Soil and Water Samples from Aden Gover...
Assessment of Natural Radioactivity in Soil and Water Samples from Aden Gover...Assessment of Natural Radioactivity in Soil and Water Samples from Aden Gover...
Assessment of Natural Radioactivity in Soil and Water Samples from Aden Gover...paperpublications3
 
CHARACTERIZATION OF SOIL AND LEAF ISOPRENE-DEGRADING COMMUNITIES AND THEIR CO...
CHARACTERIZATION OF SOIL AND LEAF ISOPRENE-DEGRADING COMMUNITIES AND THEIR CO...CHARACTERIZATION OF SOIL AND LEAF ISOPRENE-DEGRADING COMMUNITIES AND THEIR CO...
CHARACTERIZATION OF SOIL AND LEAF ISOPRENE-DEGRADING COMMUNITIES AND THEIR CO...Panteliana Ioannou
 
Water Absorption, Thickness Swelling and Rheological Properties of Agro Fiber...
Water Absorption, Thickness Swelling and Rheological Properties of Agro Fiber...Water Absorption, Thickness Swelling and Rheological Properties of Agro Fiber...
Water Absorption, Thickness Swelling and Rheological Properties of Agro Fiber...iosrjce
 
NO EROSION CRITERION FOR GRANULAR FILTERS BASED ON CONSTRICTION SIZE – AN EXP...
NO EROSION CRITERION FOR GRANULAR FILTERS BASED ON CONSTRICTION SIZE – AN EXP...NO EROSION CRITERION FOR GRANULAR FILTERS BASED ON CONSTRICTION SIZE – AN EXP...
NO EROSION CRITERION FOR GRANULAR FILTERS BASED ON CONSTRICTION SIZE – AN EXP...IAEME Publication
 
Deposition of carbon nanotubes in commonly used sample filter media
Deposition of carbon nanotubes in commonly used sample filter mediaDeposition of carbon nanotubes in commonly used sample filter media
Deposition of carbon nanotubes in commonly used sample filter mediaGJESM Publication
 
Gaurav_et_al-2012-Journal_of_Applied_Polymer_Science
Gaurav_et_al-2012-Journal_of_Applied_Polymer_ScienceGaurav_et_al-2012-Journal_of_Applied_Polymer_Science
Gaurav_et_al-2012-Journal_of_Applied_Polymer_ScienceAashish Gaurav
 
Treatment of Domestic Wastewater Using Chemical Coagulation Followed by Geote...
Treatment of Domestic Wastewater Using Chemical Coagulation Followed by Geote...Treatment of Domestic Wastewater Using Chemical Coagulation Followed by Geote...
Treatment of Domestic Wastewater Using Chemical Coagulation Followed by Geote...paperpublications3
 
Poster marta michalska sionkowska
Poster marta michalska sionkowskaPoster marta michalska sionkowska
Poster marta michalska sionkowskaKazimierz Murzyn
 
Physical and mechanical properties of concrete incorporating industrial and a...
Physical and mechanical properties of concrete incorporating industrial and a...Physical and mechanical properties of concrete incorporating industrial and a...
Physical and mechanical properties of concrete incorporating industrial and a...eSAT Journals
 
Silica Nanoparticles
Silica Nanoparticles Silica Nanoparticles
Silica Nanoparticles PankajGujjar
 
AN EXPERIMENTAL STUDY ON EFFECT OF REINFORCEMENT IN POLYMER AND FIBER FORMS O...
AN EXPERIMENTAL STUDY ON EFFECT OF REINFORCEMENT IN POLYMER AND FIBER FORMS O...AN EXPERIMENTAL STUDY ON EFFECT OF REINFORCEMENT IN POLYMER AND FIBER FORMS O...
AN EXPERIMENTAL STUDY ON EFFECT OF REINFORCEMENT IN POLYMER AND FIBER FORMS O...IAEME Publication
 

What's hot (18)

Peter Budd (University of Manchester) - Novel Membranes for Carbon Capture - ...
Peter Budd (University of Manchester) - Novel Membranes for Carbon Capture - ...Peter Budd (University of Manchester) - Novel Membranes for Carbon Capture - ...
Peter Budd (University of Manchester) - Novel Membranes for Carbon Capture - ...
 
Effect of Stone Crusher on Ambient Air Quality
Effect of Stone Crusher on Ambient Air QualityEffect of Stone Crusher on Ambient Air Quality
Effect of Stone Crusher on Ambient Air Quality
 
An overview on_biofiltration_modeling
An overview on_biofiltration_modelingAn overview on_biofiltration_modeling
An overview on_biofiltration_modeling
 
Assessment of Natural Radioactivity in Soil and Water Samples from Aden Gover...
Assessment of Natural Radioactivity in Soil and Water Samples from Aden Gover...Assessment of Natural Radioactivity in Soil and Water Samples from Aden Gover...
Assessment of Natural Radioactivity in Soil and Water Samples from Aden Gover...
 
CHARACTERIZATION OF SOIL AND LEAF ISOPRENE-DEGRADING COMMUNITIES AND THEIR CO...
CHARACTERIZATION OF SOIL AND LEAF ISOPRENE-DEGRADING COMMUNITIES AND THEIR CO...CHARACTERIZATION OF SOIL AND LEAF ISOPRENE-DEGRADING COMMUNITIES AND THEIR CO...
CHARACTERIZATION OF SOIL AND LEAF ISOPRENE-DEGRADING COMMUNITIES AND THEIR CO...
 
Peter Budd (University of Manchester) - Organic Mixed Matrix Membrane Technol...
Peter Budd (University of Manchester) - Organic Mixed Matrix Membrane Technol...Peter Budd (University of Manchester) - Organic Mixed Matrix Membrane Technol...
Peter Budd (University of Manchester) - Organic Mixed Matrix Membrane Technol...
 
Water Absorption, Thickness Swelling and Rheological Properties of Agro Fiber...
Water Absorption, Thickness Swelling and Rheological Properties of Agro Fiber...Water Absorption, Thickness Swelling and Rheological Properties of Agro Fiber...
Water Absorption, Thickness Swelling and Rheological Properties of Agro Fiber...
 
20120140505003 2-3
20120140505003 2-320120140505003 2-3
20120140505003 2-3
 
20120140505003 2
20120140505003 220120140505003 2
20120140505003 2
 
NO EROSION CRITERION FOR GRANULAR FILTERS BASED ON CONSTRICTION SIZE – AN EXP...
NO EROSION CRITERION FOR GRANULAR FILTERS BASED ON CONSTRICTION SIZE – AN EXP...NO EROSION CRITERION FOR GRANULAR FILTERS BASED ON CONSTRICTION SIZE – AN EXP...
NO EROSION CRITERION FOR GRANULAR FILTERS BASED ON CONSTRICTION SIZE – AN EXP...
 
Deposition of carbon nanotubes in commonly used sample filter media
Deposition of carbon nanotubes in commonly used sample filter mediaDeposition of carbon nanotubes in commonly used sample filter media
Deposition of carbon nanotubes in commonly used sample filter media
 
Gaurav_et_al-2012-Journal_of_Applied_Polymer_Science
Gaurav_et_al-2012-Journal_of_Applied_Polymer_ScienceGaurav_et_al-2012-Journal_of_Applied_Polymer_Science
Gaurav_et_al-2012-Journal_of_Applied_Polymer_Science
 
Treatment of Domestic Wastewater Using Chemical Coagulation Followed by Geote...
Treatment of Domestic Wastewater Using Chemical Coagulation Followed by Geote...Treatment of Domestic Wastewater Using Chemical Coagulation Followed by Geote...
Treatment of Domestic Wastewater Using Chemical Coagulation Followed by Geote...
 
Poster marta michalska sionkowska
Poster marta michalska sionkowskaPoster marta michalska sionkowska
Poster marta michalska sionkowska
 
Physical and mechanical properties of concrete incorporating industrial and a...
Physical and mechanical properties of concrete incorporating industrial and a...Physical and mechanical properties of concrete incorporating industrial and a...
Physical and mechanical properties of concrete incorporating industrial and a...
 
Silica Nanoparticles
Silica Nanoparticles Silica Nanoparticles
Silica Nanoparticles
 
Aijrfans14 256
Aijrfans14 256Aijrfans14 256
Aijrfans14 256
 
AN EXPERIMENTAL STUDY ON EFFECT OF REINFORCEMENT IN POLYMER AND FIBER FORMS O...
AN EXPERIMENTAL STUDY ON EFFECT OF REINFORCEMENT IN POLYMER AND FIBER FORMS O...AN EXPERIMENTAL STUDY ON EFFECT OF REINFORCEMENT IN POLYMER AND FIBER FORMS O...
AN EXPERIMENTAL STUDY ON EFFECT OF REINFORCEMENT IN POLYMER AND FIBER FORMS O...
 

Similar to The influence of human physical activity and contaminated clothing type on particle resuspension

Design and Materials Selection: analysis of similar sanitary pads for daily use
Design and Materials Selection: analysis of similar sanitary pads for daily useDesign and Materials Selection: analysis of similar sanitary pads for daily use
Design and Materials Selection: analysis of similar sanitary pads for daily useIJERA Editor
 
Brown et al. Particle and Fibre Toxicology 2013, 1012http.docx
Brown et al. Particle and Fibre Toxicology 2013, 1012http.docxBrown et al. Particle and Fibre Toxicology 2013, 1012http.docx
Brown et al. Particle and Fibre Toxicology 2013, 1012http.docxjasoninnes20
 
Computational Model for Deposition, Clearance and Dosimetry of Inhaled Aeroso...
Computational Model for Deposition, Clearance and Dosimetry of Inhaled Aeroso...Computational Model for Deposition, Clearance and Dosimetry of Inhaled Aeroso...
Computational Model for Deposition, Clearance and Dosimetry of Inhaled Aeroso...Hussain Majid
 
White Paper - Air Filtration And Cleanliness
White Paper - Air Filtration And CleanlinessWhite Paper - Air Filtration And Cleanliness
White Paper - Air Filtration And Cleanlinessscottheinze
 
Ding & Riediker 2015
Ding & Riediker 2015Ding & Riediker 2015
Ding & Riediker 2015Yaobo Ding
 
Ding & Riediker 2015
Ding & Riediker 2015Ding & Riediker 2015
Ding & Riediker 2015Yaobo Ding
 
Application of Plasma finishing on Cotton Fabric
Application of Plasma finishing on Cotton FabricApplication of Plasma finishing on Cotton Fabric
Application of Plasma finishing on Cotton FabricIJERA Editor
 
AATCC 2016 Insecticide Sampling Poster
AATCC 2016 Insecticide Sampling PosterAATCC 2016 Insecticide Sampling Poster
AATCC 2016 Insecticide Sampling PosterChandler Probert
 
Dermal exposure measurement and modelling
Dermal exposure measurement and modellingDermal exposure measurement and modelling
Dermal exposure measurement and modellingRetired
 
Global warming essay sample
Global warming essay sampleGlobal warming essay sample
Global warming essay sampleMarie Fincher
 
Ding et al. 2015 AST
Ding et al. 2015 ASTDing et al. 2015 AST
Ding et al. 2015 ASTYaobo Ding
 
Electrospn 23 duzyer-full
Electrospn 23 duzyer-fullElectrospn 23 duzyer-full
Electrospn 23 duzyer-fullmiroli
 
Respiratory deposition modelling
Respiratory deposition modellingRespiratory deposition modelling
Respiratory deposition modellingHussain Majid
 
Dermal exposure science: it’s not skin-deep
Dermal exposure science: it’s not skin-deep Dermal exposure science: it’s not skin-deep
Dermal exposure science: it’s not skin-deep Retired
 
The Vertical Distribution of Bouyant Plastics at Sea
The Vertical Distribution of Bouyant Plastics at SeaThe Vertical Distribution of Bouyant Plastics at Sea
The Vertical Distribution of Bouyant Plastics at SeaKimberly Noble
 
Model for Analysis of Biaxial and Triaxial Stresses by X-ray Diffraction Assu...
Model for Analysis of Biaxial and Triaxial Stresses by X-ray Diffraction Assu...Model for Analysis of Biaxial and Triaxial Stresses by X-ray Diffraction Assu...
Model for Analysis of Biaxial and Triaxial Stresses by X-ray Diffraction Assu...Miltão Ribeiro
 
Fine Particulates In The Ambient Air Of Shillong
Fine Particulates In The Ambient Air Of Shillong Fine Particulates In The Ambient Air Of Shillong
Fine Particulates In The Ambient Air Of Shillong ECRD IN
 

Similar to The influence of human physical activity and contaminated clothing type on particle resuspension (20)

Design and Materials Selection: analysis of similar sanitary pads for daily use
Design and Materials Selection: analysis of similar sanitary pads for daily useDesign and Materials Selection: analysis of similar sanitary pads for daily use
Design and Materials Selection: analysis of similar sanitary pads for daily use
 
Brown et al. Particle and Fibre Toxicology 2013, 1012http.docx
Brown et al. Particle and Fibre Toxicology 2013, 1012http.docxBrown et al. Particle and Fibre Toxicology 2013, 1012http.docx
Brown et al. Particle and Fibre Toxicology 2013, 1012http.docx
 
Computational Model for Deposition, Clearance and Dosimetry of Inhaled Aeroso...
Computational Model for Deposition, Clearance and Dosimetry of Inhaled Aeroso...Computational Model for Deposition, Clearance and Dosimetry of Inhaled Aeroso...
Computational Model for Deposition, Clearance and Dosimetry of Inhaled Aeroso...
 
White Paper - Air Filtration And Cleanliness
White Paper - Air Filtration And CleanlinessWhite Paper - Air Filtration And Cleanliness
White Paper - Air Filtration And Cleanliness
 
Ding & Riediker 2015
Ding & Riediker 2015Ding & Riediker 2015
Ding & Riediker 2015
 
Ding & Riediker 2015
Ding & Riediker 2015Ding & Riediker 2015
Ding & Riediker 2015
 
Application of Plasma finishing on Cotton Fabric
Application of Plasma finishing on Cotton FabricApplication of Plasma finishing on Cotton Fabric
Application of Plasma finishing on Cotton Fabric
 
AATCC 2016 Insecticide Sampling Poster
AATCC 2016 Insecticide Sampling PosterAATCC 2016 Insecticide Sampling Poster
AATCC 2016 Insecticide Sampling Poster
 
Dermal exposure measurement and modelling
Dermal exposure measurement and modellingDermal exposure measurement and modelling
Dermal exposure measurement and modelling
 
Global warming essay sample
Global warming essay sampleGlobal warming essay sample
Global warming essay sample
 
Ding et al. 2015 AST
Ding et al. 2015 ASTDing et al. 2015 AST
Ding et al. 2015 AST
 
Electrospn 23 duzyer-full
Electrospn 23 duzyer-fullElectrospn 23 duzyer-full
Electrospn 23 duzyer-full
 
Aaaa morawska et al 2008
Aaaa morawska et al 2008Aaaa morawska et al 2008
Aaaa morawska et al 2008
 
Respiratory deposition modelling
Respiratory deposition modellingRespiratory deposition modelling
Respiratory deposition modelling
 
Dermal exposure science: it’s not skin-deep
Dermal exposure science: it’s not skin-deep Dermal exposure science: it’s not skin-deep
Dermal exposure science: it’s not skin-deep
 
The Vertical Distribution of Bouyant Plastics at Sea
The Vertical Distribution of Bouyant Plastics at SeaThe Vertical Distribution of Bouyant Plastics at Sea
The Vertical Distribution of Bouyant Plastics at Sea
 
Model for Analysis of Biaxial and Triaxial Stresses by X-ray Diffraction Assu...
Model for Analysis of Biaxial and Triaxial Stresses by X-ray Diffraction Assu...Model for Analysis of Biaxial and Triaxial Stresses by X-ray Diffraction Assu...
Model for Analysis of Biaxial and Triaxial Stresses by X-ray Diffraction Assu...
 
Fine Particulates In The Ambient Air Of Shillong
Fine Particulates In The Ambient Air Of Shillong Fine Particulates In The Ambient Air Of Shillong
Fine Particulates In The Ambient Air Of Shillong
 
Pdf 1 1111111
Pdf 1 1111111Pdf 1 1111111
Pdf 1 1111111
 
srep06325
srep06325srep06325
srep06325
 

Recently uploaded

VIP Call Girls Ramanthapur ( Hyderabad ) Phone 8250192130 | ₹5k To 25k With R...
VIP Call Girls Ramanthapur ( Hyderabad ) Phone 8250192130 | ₹5k To 25k With R...VIP Call Girls Ramanthapur ( Hyderabad ) Phone 8250192130 | ₹5k To 25k With R...
VIP Call Girls Ramanthapur ( Hyderabad ) Phone 8250192130 | ₹5k To 25k With R...Suhani Kapoor
 
VIP Call Girls Service Chaitanyapuri Hyderabad Call +91-8250192130
VIP Call Girls Service Chaitanyapuri Hyderabad Call +91-8250192130VIP Call Girls Service Chaitanyapuri Hyderabad Call +91-8250192130
VIP Call Girls Service Chaitanyapuri Hyderabad Call +91-8250192130Suhani Kapoor
 
VIP Call Girls Service Bandlaguda Hyderabad Call +91-8250192130
VIP Call Girls Service Bandlaguda Hyderabad Call +91-8250192130VIP Call Girls Service Bandlaguda Hyderabad Call +91-8250192130
VIP Call Girls Service Bandlaguda Hyderabad Call +91-8250192130Suhani Kapoor
 
VIP Call Girls Saharanpur Aaradhya 8250192130 Independent Escort Service Saha...
VIP Call Girls Saharanpur Aaradhya 8250192130 Independent Escort Service Saha...VIP Call Girls Saharanpur Aaradhya 8250192130 Independent Escort Service Saha...
VIP Call Girls Saharanpur Aaradhya 8250192130 Independent Escort Service Saha...Suhani Kapoor
 
Call Girls In Faridabad(Ballabgarh) Book ☎ 8168257667, @4999
Call Girls In Faridabad(Ballabgarh) Book ☎ 8168257667, @4999Call Girls In Faridabad(Ballabgarh) Book ☎ 8168257667, @4999
Call Girls In Faridabad(Ballabgarh) Book ☎ 8168257667, @4999Tina Ji
 
(ZARA) Call Girls Talegaon Dabhade ( 7001035870 ) HI-Fi Pune Escorts Service
(ZARA) Call Girls Talegaon Dabhade ( 7001035870 ) HI-Fi Pune Escorts Service(ZARA) Call Girls Talegaon Dabhade ( 7001035870 ) HI-Fi Pune Escorts Service
(ZARA) Call Girls Talegaon Dabhade ( 7001035870 ) HI-Fi Pune Escorts Serviceranjana rawat
 
(ANIKA) Call Girls Wagholi ( 7001035870 ) HI-Fi Pune Escorts Service
(ANIKA) Call Girls Wagholi ( 7001035870 ) HI-Fi Pune Escorts Service(ANIKA) Call Girls Wagholi ( 7001035870 ) HI-Fi Pune Escorts Service
(ANIKA) Call Girls Wagholi ( 7001035870 ) HI-Fi Pune Escorts Serviceranjana rawat
 
BOOK Call Girls in (Dwarka) CALL | 8377087607 Delhi Escorts Services
BOOK Call Girls in (Dwarka) CALL | 8377087607 Delhi Escorts ServicesBOOK Call Girls in (Dwarka) CALL | 8377087607 Delhi Escorts Services
BOOK Call Girls in (Dwarka) CALL | 8377087607 Delhi Escorts Servicesdollysharma2066
 
(RIYA) Kalyani Nagar Call Girls Just Call 7001035870 [ Cash on Delivery ] Pun...
(RIYA) Kalyani Nagar Call Girls Just Call 7001035870 [ Cash on Delivery ] Pun...(RIYA) Kalyani Nagar Call Girls Just Call 7001035870 [ Cash on Delivery ] Pun...
(RIYA) Kalyani Nagar Call Girls Just Call 7001035870 [ Cash on Delivery ] Pun...ranjana rawat
 
VIP Kolkata Call Girl Kalighat 👉 8250192130 Available With Room
VIP Kolkata Call Girl Kalighat 👉 8250192130  Available With RoomVIP Kolkata Call Girl Kalighat 👉 8250192130  Available With Room
VIP Kolkata Call Girl Kalighat 👉 8250192130 Available With Roomdivyansh0kumar0
 
Low Rate Call Girls Bikaner Anika 8250192130 Independent Escort Service Bikaner
Low Rate Call Girls Bikaner Anika 8250192130 Independent Escort Service BikanerLow Rate Call Girls Bikaner Anika 8250192130 Independent Escort Service Bikaner
Low Rate Call Girls Bikaner Anika 8250192130 Independent Escort Service BikanerSuhani Kapoor
 
Call Girl Nagpur Roshni Call 7001035870 Meet With Nagpur Escorts
Call Girl Nagpur Roshni Call 7001035870 Meet With Nagpur EscortsCall Girl Nagpur Roshni Call 7001035870 Meet With Nagpur Escorts
Call Girl Nagpur Roshni Call 7001035870 Meet With Nagpur EscortsCall Girls in Nagpur High Profile
 
Sustainable Clothing Strategies and Challenges
Sustainable Clothing Strategies and ChallengesSustainable Clothing Strategies and Challenges
Sustainable Clothing Strategies and ChallengesDr. Salem Baidas
 
(ANAYA) Call Girls Hadapsar ( 7001035870 ) HI-Fi Pune Escorts Service
(ANAYA) Call Girls Hadapsar ( 7001035870 ) HI-Fi Pune Escorts Service(ANAYA) Call Girls Hadapsar ( 7001035870 ) HI-Fi Pune Escorts Service
(ANAYA) Call Girls Hadapsar ( 7001035870 ) HI-Fi Pune Escorts Serviceranjana rawat
 

Recently uploaded (20)

VIP Call Girls Ramanthapur ( Hyderabad ) Phone 8250192130 | ₹5k To 25k With R...
VIP Call Girls Ramanthapur ( Hyderabad ) Phone 8250192130 | ₹5k To 25k With R...VIP Call Girls Ramanthapur ( Hyderabad ) Phone 8250192130 | ₹5k To 25k With R...
VIP Call Girls Ramanthapur ( Hyderabad ) Phone 8250192130 | ₹5k To 25k With R...
 
VIP Call Girls Service Chaitanyapuri Hyderabad Call +91-8250192130
VIP Call Girls Service Chaitanyapuri Hyderabad Call +91-8250192130VIP Call Girls Service Chaitanyapuri Hyderabad Call +91-8250192130
VIP Call Girls Service Chaitanyapuri Hyderabad Call +91-8250192130
 
VIP Call Girls Service Bandlaguda Hyderabad Call +91-8250192130
VIP Call Girls Service Bandlaguda Hyderabad Call +91-8250192130VIP Call Girls Service Bandlaguda Hyderabad Call +91-8250192130
VIP Call Girls Service Bandlaguda Hyderabad Call +91-8250192130
 
VIP Call Girls Saharanpur Aaradhya 8250192130 Independent Escort Service Saha...
VIP Call Girls Saharanpur Aaradhya 8250192130 Independent Escort Service Saha...VIP Call Girls Saharanpur Aaradhya 8250192130 Independent Escort Service Saha...
VIP Call Girls Saharanpur Aaradhya 8250192130 Independent Escort Service Saha...
 
Call Girls In Faridabad(Ballabgarh) Book ☎ 8168257667, @4999
Call Girls In Faridabad(Ballabgarh) Book ☎ 8168257667, @4999Call Girls In Faridabad(Ballabgarh) Book ☎ 8168257667, @4999
Call Girls In Faridabad(Ballabgarh) Book ☎ 8168257667, @4999
 
(ZARA) Call Girls Talegaon Dabhade ( 7001035870 ) HI-Fi Pune Escorts Service
(ZARA) Call Girls Talegaon Dabhade ( 7001035870 ) HI-Fi Pune Escorts Service(ZARA) Call Girls Talegaon Dabhade ( 7001035870 ) HI-Fi Pune Escorts Service
(ZARA) Call Girls Talegaon Dabhade ( 7001035870 ) HI-Fi Pune Escorts Service
 
E Waste Management
E Waste ManagementE Waste Management
E Waste Management
 
9953056974 ,Low Rate Call Girls In Adarsh Nagar Delhi 24hrs Available
9953056974 ,Low Rate Call Girls In Adarsh Nagar  Delhi 24hrs Available9953056974 ,Low Rate Call Girls In Adarsh Nagar  Delhi 24hrs Available
9953056974 ,Low Rate Call Girls In Adarsh Nagar Delhi 24hrs Available
 
(ANIKA) Call Girls Wagholi ( 7001035870 ) HI-Fi Pune Escorts Service
(ANIKA) Call Girls Wagholi ( 7001035870 ) HI-Fi Pune Escorts Service(ANIKA) Call Girls Wagholi ( 7001035870 ) HI-Fi Pune Escorts Service
(ANIKA) Call Girls Wagholi ( 7001035870 ) HI-Fi Pune Escorts Service
 
BOOK Call Girls in (Dwarka) CALL | 8377087607 Delhi Escorts Services
BOOK Call Girls in (Dwarka) CALL | 8377087607 Delhi Escorts ServicesBOOK Call Girls in (Dwarka) CALL | 8377087607 Delhi Escorts Services
BOOK Call Girls in (Dwarka) CALL | 8377087607 Delhi Escorts Services
 
(RIYA) Kalyani Nagar Call Girls Just Call 7001035870 [ Cash on Delivery ] Pun...
(RIYA) Kalyani Nagar Call Girls Just Call 7001035870 [ Cash on Delivery ] Pun...(RIYA) Kalyani Nagar Call Girls Just Call 7001035870 [ Cash on Delivery ] Pun...
(RIYA) Kalyani Nagar Call Girls Just Call 7001035870 [ Cash on Delivery ] Pun...
 
Call Girls In Pratap Nagar꧁❤ 🔝 9953056974🔝❤꧂ Escort ServiCe
Call Girls In Pratap Nagar꧁❤ 🔝 9953056974🔝❤꧂ Escort ServiCeCall Girls In Pratap Nagar꧁❤ 🔝 9953056974🔝❤꧂ Escort ServiCe
Call Girls In Pratap Nagar꧁❤ 🔝 9953056974🔝❤꧂ Escort ServiCe
 
VIP Kolkata Call Girl Kalighat 👉 8250192130 Available With Room
VIP Kolkata Call Girl Kalighat 👉 8250192130  Available With RoomVIP Kolkata Call Girl Kalighat 👉 8250192130  Available With Room
VIP Kolkata Call Girl Kalighat 👉 8250192130 Available With Room
 
Low Rate Call Girls Bikaner Anika 8250192130 Independent Escort Service Bikaner
Low Rate Call Girls Bikaner Anika 8250192130 Independent Escort Service BikanerLow Rate Call Girls Bikaner Anika 8250192130 Independent Escort Service Bikaner
Low Rate Call Girls Bikaner Anika 8250192130 Independent Escort Service Bikaner
 
Call Girls In { Delhi } South Extension Whatsup 9873940964 Enjoy Unlimited Pl...
Call Girls In { Delhi } South Extension Whatsup 9873940964 Enjoy Unlimited Pl...Call Girls In { Delhi } South Extension Whatsup 9873940964 Enjoy Unlimited Pl...
Call Girls In { Delhi } South Extension Whatsup 9873940964 Enjoy Unlimited Pl...
 
Call Girl Nagpur Roshni Call 7001035870 Meet With Nagpur Escorts
Call Girl Nagpur Roshni Call 7001035870 Meet With Nagpur EscortsCall Girl Nagpur Roshni Call 7001035870 Meet With Nagpur Escorts
Call Girl Nagpur Roshni Call 7001035870 Meet With Nagpur Escorts
 
Sustainable Clothing Strategies and Challenges
Sustainable Clothing Strategies and ChallengesSustainable Clothing Strategies and Challenges
Sustainable Clothing Strategies and Challenges
 
Green Banking
Green Banking Green Banking
Green Banking
 
Call Girls In R.K. Puram 9953056974 Escorts ServiCe In Delhi Ncr
Call Girls In R.K. Puram 9953056974 Escorts ServiCe In Delhi NcrCall Girls In R.K. Puram 9953056974 Escorts ServiCe In Delhi Ncr
Call Girls In R.K. Puram 9953056974 Escorts ServiCe In Delhi Ncr
 
(ANAYA) Call Girls Hadapsar ( 7001035870 ) HI-Fi Pune Escorts Service
(ANAYA) Call Girls Hadapsar ( 7001035870 ) HI-Fi Pune Escorts Service(ANAYA) Call Girls Hadapsar ( 7001035870 ) HI-Fi Pune Escorts Service
(ANAYA) Call Girls Hadapsar ( 7001035870 ) HI-Fi Pune Escorts Service
 

The influence of human physical activity and contaminated clothing type on particle resuspension

  • 1. 1 The Influence of Human Physical Activity and Contaminated Clothing Type on Particle Resuspension A. McDonagha,* and M. A. Byrnea a School of Physics and C-CAPS, The Ryan Institute, National University of Ireland Galway (NUIG), Ireland. *Corresponding author details: Name: Dr Ann McDonagh Postal address: Pathogen Control Engineering (PaCE) Institute, School of Civil Engineering, University of Leeds, Leeds LS2 9JT, United Kingdom. Telephone: +44 (0) 113 343 1957 Fax: +44 (0) 113 343 2265 Email: mcdonagh.ann@gmail.com; A.McDonagh@leeds.ac.uk
  • 2. 2 Abstract A study was conducted to experimentally quantify the influence of three variables on the level of resuspension of hazardous aerosol particles from clothing. Variables investigated include physical activity level (two levels, low and high), surface type (four different clothing material types), and time i.e. the rate at which particles resuspend. A mixture of three monodisperse tracer-labelled powders, with median diameters of 3, 5, and 10 microns, was used to “contaminate” the samples, and the resuspended particles were analysed in real-time using an Aerodynamic Particle Sizer (APS), and also by Neutron Activation Analysis (NAA). The overall finding was that physical activity resulted in up to 67 % of the contamination deposited on clothing being resuspended back into the air. A detailed examination of the influence of physical activity level on resuspension, from NAA, revealed that the average resuspended fraction (RF) of particles at low physical activity was 28 ± 8 %, and at high physical activity was 30 ±7 %, while the APS data revealed a tenfold increase in the cumulative mass of airborne particles during high physical activity in comparison to that during low physical activity. The results also suggest that it is not the contaminated clothing's fibre type which influences particle resuspension, but the material's weave pattern (and hence the material's surface texture). Investigation of the time variation in resuspended particle concentrations indicated that the data were separable into two distinct regimes: the first (occurring within the first 1.5 minutes) having a high, positive rate of change of airborne particle concentration relative to the second regime. The second regime revealed a slower rate of change of particle concentration and remained relatively unchanged for the remainder of each resuspension event. Keywords Resuspension; Human physical activity; Clothing; Hazardous aerosol particles; Contamination; Shedding.
  • 3. 3 1. Introduction Following an accidental or deliberate release of hazardous materials, such as radioactive (e.g. Fukushima) or infectious species (e.g. H1N1 virus) to the atmosphere, there is a risk of exposure of large population groups and individual persons who reside both indoors and outdoors. In preparing for this scenario, accurate estimates of whole body exposure arising from all exposure pathways are necessary in order to design effective countermeasures. Current dosimetric models, for example, that of Andersson et al. (2004), focus on aerosol inhaled while initially airborne, with some reference to particles deposited on the human body, but secondary exposure and inhalation is not considered. One secondary exposure pathway that merits investigation, and for which no comprehensive experimental data are available, is re-exposure to aerosol contaminant that was formerly deposited on clothing and other indoor surfaces. This is especially important in the case where a person might be unwittingly contaminated and might spread this contamination to others via the process of resuspension. These exposure pathways may also have significance for airborne pollutants that are nonradioactive, e.g. infectious aerosol that becomes re-entrained from disturbance of hospital bedding, etc. Numerically, resuspension rates are low relative to deposition rates (e.g. Thatcher and Layton, 1995) but the concentration of resuspended contaminated particles can significantly influence a persons‟ exposure. The size distribution of resuspended particles is different from the size distribution of depositing particles, with larger particles being more readily resuspended (Andersson et al., 2004, Ferro et al., 2004). A wide range of contaminated surfaces have been investigated in the context of particle resuspension due to human physical activity, but resuspension studies focus on quantifying the level of resuspension from flooring surfaces (Ferro et al, 2004, Long et al, 2000, Abt et al,
  • 4. 4 2000); contamination on, and its removal from, clothing surfaces has received little attention, apart from a few studies in the medical devices and cleanroom industry (Cohen and Positao, 1986; Bohne and Cohen, 1985). The removal of particles from human skin has been investigated; Hession et al (2006) studied the effect of human body hair on particle fall-off and concluded that hairy skin retained particles for longer periods. To supplement the existing knowledge base, the aim of the present study is to quantify the level of resuspension of hazardous particles directly from clothing surfaces worn by a physically active human, who is engaging in various levels of typical daily physical activity. Earlier studies have generally determined particle resuspension rates and factors based on changes in the total airborne particulate concentrations, which is not chemically specific and so could not directly isolate the resuspended particles from others that were airborne. While the current study also uses this accepted experimental method, an additional and more comprehensive method, using Neutron Activation Analysis (NAA), will be used to calculate the fraction of originally deposited particles which resuspended, directly from the clothing surface. 2. Materials and Methods A summary of the experimental strategy for studying particle resuspension from clothing surfaces is as follows: the material surfaces to be „contaminated‟ were first exposed to aerosol particles in the form of tracer labelled silica powder. They were subsequently attached to a volunteer who engaged in a predefined physical activity for a specified length of time. Samples of the material were analysed both before and after the resuspension process to determine the proportion of the original deposited mass which became resuspended. The air in the resuspension chamber was continuously monitored to determine the size spectrum of resuspended particles in the air.
  • 5. 5 2.1 Aerosol Particles The particles used throughout these experiments were monodisperse silica particles (Alltech) labelled with a rare earth metal tracer. Three particle sizes, with manufacturer specified mean diameters of 3 µm, 5µm and 10 µm, were chosen for their similarity to that of the refractory group of radioactive aerosols released into the atmosphere following a nuclear explosion and also to that of some biological species e.g. anthrax. It is important to note that although the particles were monodisperse, each batch of particles will have a size distribution about their mean diameter. The three sizes were labelled with Europium (EuCl3), Dysprosium (DyCl3) and Indium (InCl3) respectively following the method described by Jayasekera et al. (1989). For Dysprosium, the average labelling yield was 5.20 mg of Dy on 1 g of labelled silica. To reduce the number of experimental replications that needed to be carried out and also the cost of analysis, the three particle sizes were mixed together for deposition onto the surfaces for all experiments. 2.2 Aerosol Deposition All clothing samples to be used in the resuspension experiments were first contaminated with the silica particles in a 2.25 m3 aluminium deposition chamber. Inside the chamber a small 2W fan was mounted 0.2 m from the chamber ceiling (chamber height = 1.5 m), centrally aligned and orientated vertically downwards, to simulate real room mixing conditions. An Aerodynamic Particle Sizer (APS) was operational during the deposition events. The particles were injected into the chamber using a dry powder particle generator (Palas RBG-1000) located on the roof of the chamber. In all cases, the aerosol was passed through a tube containing an array of 12 x 33 KBq Am241 radioactive sources; using the calculations
  • 6. 6 of Cooper and Reist (1973) it was estimated that, for the aerosol flow rate used, the ratio of the residence time of the aerosol in the tube and the characteristic source strength used was greater than unity, so that aerosol charge equilibrium would be reached. Before commencing the „contamination‟ of fabric samples, the floor of the deposition chamber was analysed for any variations in the spatial uniformity of particle deposition; a variation of only 9 % was observed over a central floor area of 43 x 76 cm. 2.3 Clothing Surfaces As the human body is typically covered with some degree of clothing, four common clothing materials were chosen for the experiments: cotton, polyester, fleece and denim. The chosen materials consisted of natural and synthetic fibres with smooth and rough surface textures. The natural fibre used was a 100 % cotton material. It had the same tight weave pattern as the 100 % polyester material which is a synthetic fibre, as observed by electron microscopy. Fleece is also made from 100 % polyester but has a much rougher surface texture resulting from the disordered nature of the weave. A denim material was chosen due to its popularity as a clothing textile and the particular denim used in this work consisted of 65 % cotton, 32 % polyester and 3 % spandex. As these materials were composed of different fibres and colours, they were pre-tested by Neutron Activation Analysis (NAA) to ensure they did not contain elements that would interfere with the analysis of the tracer particles to be deposited onto them.
  • 7. 7 Figure 1. Specific locations of contaminated samples on volunteer Large samples of each material type were contaminated for each experimental run. This was to ensure there would be a sufficient level of contaminant available on the volunteer during the resuspension process, to be resuspended and thus captured by the aerosol sampling equipment. Contaminated material samples were placed onto the volunteers‟ legs, arms and chest, as can be seen in figure 1. The leg pieces were 25 x 40 cm and were wrapped around each lower leg, thus covering almost all of the lower legs (front and back) between the knee and ankle. The chest piece was 20 x 20 cm and the arm pieces were 15 x 30 cm, one each on the outer arm between the shoulder and elbow. The clothing samples had safety pins attached to their corners before contamination. This was to facilitate quick and easy attachment of the contaminated samples to the volunteer (by an assistant), with a minimum of disturbance to the samples themselves. Each of the large clothing samples also had two smaller pieces of the same material (ranging from 1 x 4 cm to 2 x 5 cm, depending on the material type) pinned onto them before contamination. These were both analysed by NAA, one before and one after the resuspension process, for reasons which will be discussed in section 2.5. The size of the NAA capsules restricted the
  • 8. 8 size of material sample which could be analysed. 2.4 Aerosol Resuspension After contamination, the clothing samples were placed into individual, sealed and labelled plastic containers and transported to the vicinity of the resuspension chamber, a purpose-built 15 m3 plywood test room. Inside the chamber were two APS‟s, one at ankle height (15 cm from the floor) and the other at waist height (90 cm from the floor). In the centre of the chamber floor was a grounded metal plate upon which the volunteer stood while performing the experiment. This was to ensure that any static charge generated by the movement of the volunteers‟ feet, would not influence the behaviour of the resuspended particles. Also, the smooth surface texture of the metal made it easier to ensure complete decontamination between experiments. Directly outside the chamber, the volunteer dressed in a clean room suit (Macrobond hooded coverall from Caulfield Industrial), booties (Polylatex shoecover 4 g from Caulfield Industrial), gloves (powder free purple nitrile) and a mask (8835 FFP3D disposable mask from Anderco Safety). The cleanroom suit was chosen for its nonlinting and anti-static properties, so that it can be assumed that any airborne particles detected by the APS‟s were as a result of particles resuspending from the contaminated material and not from the volunteer‟s personal clothing. An assistant then carefully removed one of the four types of „contaminated‟ clothing samples from their boxes and pinned them to the volunteer‟s clean room suit. The placing of clothing samples over the clean room suit will generate an effect similar to that of a person wearing multiple layers of clothing (denim jeans over underwear, jumper over t-shirt etc.).
  • 9. 9 When fully attired and with samples attached, the volunteer entered the resuspension chamber and participated in one of two pre-defined physical activity patterns: low physical activity – walking at a pre-defined rate for 20 minutes, or high physical activity – Irish dancing to a Reel (Wikipedia, accessed Nov 2011) with added swinging of the arms for 10 minutes (chosen to facilitate the accurate reproduction of movement in each repeated experiment). The duration of the resuspension event for high physical activity was half that for low physical activity as the level of physical exertion required was not possible to keep constant over a longer period of time. The volunteer then exited the chamber and the assistant removed the clothing samples and placed them back into their individual boxes. The resuspension chamber and all equipment were thoroughly cleaned between experiments by washing with water and using alcohol wipes. Additionally, a multi-functional air purifier (model XJ-3000C by Heaven Fresh) with a HEPA filter, carbon filter, ioniser and sanitiser was operational between experiments, to ensure the air was completely devoid of any tracer particles. 2.5 Analysis The primary aerosol measuring instrument used in this study was the Aerodynamic Particle Sizer (APS) [Model 3321 by Trust Science Innovation (TSI)]. The APS sizes airborne particles in the range of 0.5 to 20 µm in aerodynamic diameter. Throughout these experiments, the concentration and size distribution of the airborne particles in both the deposition and resuspension chambers were continuously measured in real time using the APS‟s. The second analysis technique employed was Neutron Activation Analysis (NAA). The surfaces contaminated with labelled silica were analysed by NAA at the Reactor Institute in the Delft University of Technology, the Netherlands. NAA allows discrete sampling of elements as it disregards the chemical form of a sample, and focuses solely on its nucleus.
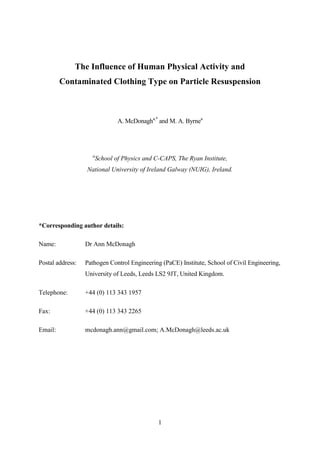
  • 10. 10 0 2 4 6 Mass Concentration (M) [µg/m3] Time [hh:mm:ss] The three rare earth metal labels used in these experiments have a half-life of 9.3 h, 2.3 h and 54 min for Eu, In and Dy respectively and they decay as follows: 151 Eu (+ neutron) = 152m Eu (- γ) = 152 Gd, 164 Dy (+ neutron) = 165 Dy (- γ) = 165 Ho, 115 In (+ neutron) = 116m In (- γ) = 116 Sn. The third analysis technique used was Scanning Electron Microscopy (SEM). 3. Results and Discussion 3.1 Airborne mass concentration variation with time, during resuspension Figure 2. Mass concentration of airborne particles during resuspension due to (a) low physical activity and (b) high physical activity, as a function of time Figure 2 indicates the change in particle mass concentration with time (as detected by an APS in the resuspension chamber) before, during and after a person wearing contaminated 0 10 20 30 00:00:00 00:07:12 00:14:24 00:21:36 00:28:48 00:36:00 00:43:12 (a) Low Physical Activity (b) High Physical Activity
  • 11. 11 clothing is engaging in (a) low physical activity and (b) high physical activity. Each data point represents the cumulative sum of the airborne mass concentration over all particle sizes, at a particular second and the trendline indicates the one minute average. The vertical dashed lines indicate the instances when the contaminated person entered and exited the resuspension chamber i.e. the start and end of the resuspension event. During low physical activity, the contaminated person was physically active within the resuspension chamber for 20 minutes and for 10 minutes during high physical activity. It is clear from figure 2(a), that there is an immediate and steady increase in airborne particle concentration from the moment the person enters the chamber. The averaged cumulative concentration reaches a peak of 2.26 µg m-3 just 1.5 minutes after the resuspension event begins. The particle concentration then rapidly decreases to 1.81 µg m-3 in a further 30 seconds. After that point (2 minutes into the resuspension event) the airborne particle concentration slowly decreases. A linear trendline (best fit to data) plotted to the airborne particle concentration readings for the last 18 minutes of the resuspension event indicates a decreasing slope: i.e. a decrease in the rate of change in airborne particle concentration of - 0.026 ± 0.002 µg m-3 min-1 . The pattern shown in figure 2(b) is similar to figure 2(a): there is an immediate and steady increase in airborne particle concentration from the moment the person enters the chamber. However, the difference in pattern for figure 2(b) is that the airborne particle concentration now continually increases throughout the entire 10 minutes of the resuspension event. The peak averaged concentration of approximately 23.2 µg m-3 occurs at the end of the resuspension event, just as the contaminated volunteer exits the chamber. The rate of change of airborne particle concentration during resuspension for both physical activity levels can be split into two separate regimes, the first occurring during the initial 1.5
  • 12. 12 minutes, and the second over the remainder of the resuspension event. For the first regime - during the first 1.5 minutes of the resuspension event - both physical activity levels result in an increase in airborne particle concentration but high physical activity results in a rate of increase four times that corresponding to low physical activity, i.e. 4.5 ± 0.5 µg m-3 min-1 and 1.1 ± 0.2 µg m-3 min-1 , respectively. For the second regime – during the remaining period of each resuspension event – the change in airborne particle concentration shows an opposing trend for low compared to high physical activity levels. During low physical activity, the particle concentration decreases at a comparatively slow rate of - 0.026 ± 0.002 µg m-3 min-1 , while it increases and at a more rapid rate of 1.00 ± 0.03 µg m-3 min-1 during high physical activity. Wu et al. (1992) noted a very similar pattern in resuspension with time when examining the resuspension of uranine particles, polymer microspheres, lycopodium spores and Johnson grass pollen from glass, plexiglass and white oak leaves at windspeeds of 4 to 8 ms-1 . They concluded that the resuspension rates varied over time, defined by two separate regimes. The first regime occurred in the first minute of resuspension and was characterised by higher resuspension rates (0.17 s-1 ). After the first minute, particles which are easily resuspended had been removed, leaving only particles with much smaller resuspension rates (0.029 s-1 ) for the second regime. The noting of two resuspension regimes is identical to this current study and also the time frame for the first regime is similar, with Wu et al. (1992) noting 1 minute and this study observing 1.5 minutes. However the slower resuspension rate during the second regime as determined by Wu et al. (1992) is comparable only to the decrease in the rate of change of airborne particle concentration detected in this study at low physical activity. High physical activity resulted in an increase in the rate of change of airborne concentration during the duration of the second regime (albeit at a slower rate in comparison to the first regime).
  • 13. 13 Hession et al. (2006) compared the clearance of fluorescent 3 and 10 µm particles from skin during two different activity levels: low activity where the volunteer remained seated indoors, and high activity where the volunteer engaged in vigorous outdoor walking in dry, breezy conditions. The rates of clearance of particles from the skin with time during low activity was shown to follow an exponential pattern, however a very different clearance pattern was displayed during high activity. Based on figure 3.3 in Hession et al. (2006), during high activity, the mass of particles remaining on the volunteer‟s skin reduced by approximately 88 % in the first 30 minutes and then remained approximately constant for the remaining 170 minutes. This again displays a two regime removal of particles from a surface with time and also exhibits a difference in the particle clearance pattern between two different physical activity levels. This will be elaborated upon in the section 3.2. 3.2 Resuspension with varied physical activity level The purpose of this section is to examine the resuspended fraction (RF) data for each particle size, at low and high physical activity levels. The RF is calculated by measuring the difference in mass concentration of particles deposited on the material sample before and remaining on the material sample after the period of resuspension, as a percentage of the mass concentration deposited on the material sample before resuspension. The data is averaged over all contaminated material types. Low physical activity consisted of walking for 20 minutes. High physical activity was representative of running and simulated by modified Irish dancing to a Reel for 10 minutes, as described in section 2.4. The NAA data indicates that the fraction of particles which are resuspended from the clothing of a person engaged in low physical activity ranges from 8 to 52 %, with an average RF
  • 14. 14 across all sized particles of 28 ± 8 %. During high physical activity, between 3 and 67 % of particles formerly deposited on various clothing types was found to resuspend, with an average RF value across all particle sizes of 30 ± 7 %. A two-tailed paired T-test shows that the difference between the average resuspended fraction (averaged over all particle sizes and material types) at low and high physical activity level is not statistically significant. Figure 3 shows the average size distribution of particles in the air surrounding a contaminated person engaging in either low (blue diamonds) or high (red circles) physical activity, as measured by an APS at waist height. The mass distribution is calculated by averaging the total concentration per second in each size range, over the entire physical activity (i.e. resuspension) duration: 20 minutes for low and 10 minutes for high physical activity. This is calculated for each repeated experiment and for each material type (i.e. 16 individual experiments) and an overall average is obtained for each physical activity level. Figure 3. Size distributions of particles during low and high physical activity The sum of the mass concentration of airborne particles over all particle sizes during low physical activity is 1.72 µg m-3 and during high physical activity is 16.93 µg m-3 . This is 0 0.2 0.4 0.6 0.8 1 1.2 1.4 1.6 0 5 10 15 20 25 Mass Distribution (dM/dlogDp) [µg/m3] Aerodynamic Diameter (Dp) [µm] High Physical Activity Low Physical Activity
  • 15. 15 almost a tenfold increase in the cumulative mass of airborne particles during high physical activity in comparison to that during low physical activity. This difference is statistically significant, with a p-value of 0.000001 based on a two tailed, paired student t-test. Therefore, within the range of particle sizes measured, and between these two physical activity levels, there is a significant difference in the mass of airborne particles resuspended from a contaminated persons‟ clothing. However, this conclusion is drawn from the APS data and appears to contradict the results from the NAA data. This apparent contradiction is due to the capturing of different features of the resuspension process by the two different analytical techniques, as discussed below. The APS data shows the airborne mass concentration as a function of particle size and thus measures all particles that are airborne, regardless of their origin. NAA data are used to determine the resuspended fraction (RF), which is calculated by measuring the difference in mass concentration of particles deposited on the material sample before and remaining on the material sample after the period of resuspension, as a percentage of the mass concentration deposited on the material sample before resuspension. Hence the concentration of particles remaining on a sample after resuspension is the key variable in determining the resuspended fraction from that sample. However, this value may be higher than expected due to an unquantified number of particles remaining on that sample after the resuspension event, caused mainly by three processes which are described below. The first contributor to a higher than expected mass concentration of particles remaining on the material sample after the resuspension event is impaction of resuspended particles back onto the material sample. During resuspension, the volunteer wearing the contaminated clothing is moving vigorously on a fixed position on the floor for a period of time. Thus some particles which are initially resuspended may be re-deposited onto the clothing sample due to
  • 16. 16 impaction, as the body part is moved through the „cloud‟ of resuspended particles. The movement of a body part through a particle-laden airstream which results in impaction, is analogous to the process of particle impaction when a moving particle-laden airstream encounters a stationary object – this process has been well described (e.g. Golovin and Putnam, 1962, Hinds, 1999, Lange, 1995, and Ranz and Wong, 1952). The second contributor is enhanced deposition due to both increased air velocities around the moving person and the rate of displacements of the body parts (and hence the material samples) themselves. Wu et al. (1992) concluded that, once particles are resuspended from their residing surface, their trajectories depend on the characteristics of the turbulent air flow and not on the initial velocity of the particle. The resuspended particles in this study will have a high velocity due to the increased air velocity caused by the physical movement of the contaminated volunteer. Rim and Novoselac (2009) examined the influence of localised arm movement on air velocities using a mechanical manikin sitting on a chair and the hands were subjected to large and small motion. The large motion was a periodic rotation of the entire arms back and forth by ± 30º (represents active hand movement e.g. filing), the small motion was a periodic up and down rotation of the elbow by ± 10º (represents limited hand movements e.g. typing). They concluded that physical activity of the manikin does significantly affect the air velocity at 20 cm above the floor but does not largely affect the air velocity above the head and also that large motion has a greater affect than does small motion. Bjorn and Nielsen (2002) also investigated the influence of the physical activity of a manikin in a room and found that a larger degree of air mixing occurred in the room with the moving manikin than with a stationary one. The volunteer in the current experiments is moving at a fast pace, for example, during high physical activity (modified Irish dancing) the volunteer jumps from one leg to the other at an average rate of 55 jumps per minute which corresponds to a rate of leg displacement of approximately 0.75 m s-1 and a rate of
  • 17. 17 arm displacement of approximately 0.5 m s-1 . This movement will undoubtedly increase the air movement around the active contaminated person and thus increase the resuspended particles‟ velocity which will lead to enhanced deposition back onto the contaminated material as the material is repeatedly moved through the „cloud‟ of resuspended particles. The third contributor is the penetration of resuspended particles deep into the weave of the material. Because of the particles‟ increased velocities when they redeposit, they will have an increased kinetic energy and hence may penetrate deeper into the weave pattern of the material. These particles will therefore be more difficult to re-resuspend. This point will be elaborated in section 3.3. As a consequence of the above three events occurring during resuspension, the mass of particles calculated to be on the clothing sample after the period of resuspension may be higher than would be the case if all particles which initially resuspended were removed and not available to re-deposit. Therefore a lower RF than is actually the case is calculated but it should be noted that this RF is representative of a real-life scenario where impaction and secondary resuspension would be continuously occurring. The rate of recapture is difficult to quantify, as it is dependent on a number of variables including: air velocity, target velocity, particle size and Stokes number, the boundary layer thickness and Reynolds number. The impact efficiency onto a cylinder for particles with very small Stokes numbers (as is the case here) is difficult to assess as these particles are extremely sensitive to the boundary layer very close to the cylinder (Haugen and Kragset, 2010). According to figure 3 of Wessel and Righi (1988), for a eynolds number of zero (in this experiment, e . around the arm) and a Stokes number of 1.5, the target efficiency will be 50 %. The APS data indicates a 10 fold increase in the mass of airborne particles but only a two fold increase in the number of airborne particles, during low and high physical
  • 18. 18 activity. Hence, a greater proportion of the smaller particles are being recaptured by the clothing, particularly at higher physical activity levels. This is due to the smaller particles being more likely to remain in the air streams created by the moving body part and thus being intercepted by the body part moving back through the same air location. The bigger particles will leave the air streams and move away from the body part, and are more likely to be captured by the APS or deposit to the floor etc. This is confirmed by the NAA data, where the RF increases with increasing particle size at both physical activity levels but to a greater extent at high physical activity (this will be discussed in greater detail in a succeeding journal article). 3.3 Resuspension with varied contaminated clothing material type Four different material types were investigated – cotton, polyester, fleece and denim. Each material type was contaminated and worn by a volunteer engaging in physical activity. The concentration of particles resuspended from each material type was investigated, with each material type experiment repeated four times and an average distribution calculated. This was possible as the consistency between data derived from repeated experiments using any one material type was high (all p values ≥ .17, i.e. no significant difference). Figure 4 shows the average mass distribution of airborne particles as a function of particle size, for each material type. The average mass distribution is averaged over the entire resuspension process (10 mins at high physical activity) and over all four repeated experiments of each material type. The size distribution curve for particles resuspended from fleece is represented with blue diamonds, polyester with red squares, denim with green triangles and cotton with yellow circles.
  • 19. 19 Figure 4. Size distribution curve of particles resuspended from all four material types, during high physical activity From figure 4 it can be seen that the size distribution curve for particles resuspended from fleece corresponds to a higher mass concentration than that for the three other material types. The cumulative mass concentration of particles of all sizes resuspended from fleece is 26.28 µg m-3 , from cotton is 15.13 µg m-3 , from polyester is 13.47 µg m-3 and from denim is 12.84 µg m-3 . Analysing the distributions using a student t-test (two tailed, two samples of equal variance) identifies fleece as being significantly different from the distributions of all other material types, with p = 0.02, 0.01 and 0.04 between fleece and polyester, denim and cotton, respectively. However, the distributions of polyester, denim and cotton are not significantly different from each other. The above finding is confirmed using the data analysed by NAA for the same set of data (figure 4). The average RF for fleece is 41 ± 10 %, for polyester is 31 ± 7 %, for denim is 28 ± 4 % and for cotton is 25 ± 5 %. Using the same statistical test as was used for the APS data, the resuspended fraction of original contaminant from fleece and fleece alone is significantly 0 0.5 1 1.5 2 2.5 0 5 10 15 20 25 Mass Distribution (dM/dlogDp) [µg/m3] Aerodynamic Diameter (Dp) [µm] Fleece Polyester Denim Cotton
  • 20. 20 different from that of each of the three other contaminated material types, with p = 0.03, 0.005 and 0.001 between fleece and polyester, denim and cotton, respectively. The above finding may be explained by considering the varied surface texture of the material types. The synthetic fleece used in these experiments is made from 100 % polyester as is the polyester material. However the weave pattern is very different for both material types, as confirmed using SEM imagery (figure 5). The polyester material has a very uniform and tight weave pattern (which, as an aside, is found to be very similar to the weave pattern for membrane collection filters, described by Bénesse et al., 2006) while the fleece is more irregular and loose. Figure 5. SEM images showing the weave pattern of: (a) polyester (b) fleece (c) cotton and (d) denim. Each image is taken at 80 or 90 times magnification and the scale at the bottom right corner is 500 µm. Although the majority of deposited particles reside in a monolayer on the surface layer of (a) (b) (c) (d)
  • 21. 21 the material (as verified using SEM imagery of contaminated surfaces), some particles deposited onto the polyester surface penetrate into the crevices between weave strands and could potentially be trapped there (due to the tightness of the weave) and thus be harder to resuspend. An example of particles deposited deep into the weave can be seen in figure 6. This could account for the degree of resuspension of particles from polyester, cotton and denim (all with the same weave pattern) to be lower than that from fleece. Figure 6. SEM image of particles deposited deep into the weave (circled areas) of contaminated polyester The APS results in figure 4 and the succeeding discussion of the related NAA data, also indicate that the fibre used to make the cloth or material does not significantly affect resuspension, as the polyester and cotton materials used in these experiments were found statistically to have the same level of resuspension from them. While they are made from different fibres - polyester is synthetic and cotton is natural - they both have the same weave
  • 22. 22 pattern. This indicates that it is the surface texture roughness and not material type, which is the more important factor in relation to the resuspension of hazardous aerosol particles from clothing surfaces. Previous findings indicate that increasing surface texture roughness results in lower amounts of particle resuspension, for example, Wu et al. (1992), Braun et al. (2002), Hession et al. (2006) and Andersson et al. (2004), and this appears to contradict the findings in the present work. However, the apparent discrepancy can be explained by considering the relative significance of macroscopic and microscopic features of the fabric. Macroscopically, fleece would have a rougher surface texture than polyester and should therefore demonstrate a lower resuspended fraction which it does not. However, microscopically, the polyester material has a rougher surface texture than the fleece material, due to their respective weave patterns. If one considers that penetration and settling of particles deep into the weave of the clothing fabric (which is occurring in the current experiments due to the increased air velocities around the volunteer from of their physical movement and also due to impaction of airborne particles back onto the clothing samples), then the significance of the microscopic features of the fabric can be realised. One parameter which may have an influence on particle behavior but which was not investigated in these experiments is static charge. The electrostatic forces associated with surface residing particles, can both aid and hinder particle resuspension and are dependent on a number of factors including the composition of the material subjected to friction, the amount of friction or surface agitation, and the relative humidity of the ambient air.
  • 23. 23 4. Conclusions The influence of human physical activity level on particle resuspension from clothing was examined using two analysis techniques: Neutron Activation Analysis (NAA) and Aerodynamic Particle Sizing (APS). The NAA data showed that the average resuspended fraction (RF) of particles at low physical activity was 28 ± 8 %, and at high physical activity was 30 ± 7 %, a statistically insignificant difference. In contrast, the APS data revealed a statistically significant tenfold increase in the cumulative mass of airborne particles during high physical activity in comparison with that during low physical activity. While both techniques indicate an increase in resuspension with increasing physical activity level, the difference in terms of statistical significance is attributed to the two analysis techniques capturing different aspects of the resuspension process, as discussed in section 3.2. In respect to the influence of the contaminated surface type on particle resuspension, the results obtained indicate that it is not the contaminated clothing‟s fibre type which influences particle resuspension, but the material‟s weave pattern (and hence the material‟s surface texture). Fleece was found to exhibit the highest levels of particle resuspension (cotton, denim and polyester showed no significant difference), as particles did not become trapped deep within the weave pattern of the material and were thus relatively easily released from the non-uniform weave, when the material was subjected to agitation. An investigation of the change in airborne mass concentrations with time, due to the resuspension of particles from contaminated clothing, revealed that the data was separable into two distinct regimes: the first having a high, positive rate of change of airborne particle concentration relative to the second regime, and occurring within the first 1.5 minutes of the beginning of the resuspension event. The second regime revealed a slower rate of change of particle concentration and remained relatively unchanged for the remainder of each
  • 24. 24 resuspension event. In conclusion, based on the variables investigated in this study, the conditions for which the highest fraction of initially deposited particles became resuspended were during the wearing of contaminated clothing of fleece material by a person engaged in a high level of physical activity, and during the first 1.5 minutes of that activity. The finding that physical activity can cause up to 67 % of contamination formerly deposited on clothing to be resuspended back into the air implies that the transport process of resuspension is of considerable importance for accurate determination of human exposure risks. 5. Acknowledgements This work has been sponsored by the Radiological Protection Institute of Ireland (RPII) and supported by the European Commission under the 7th Framework Programme through the 'Research Infrastructures' action of the 'Capacities' Programme, Contract No: CP-CSA_INFRA- 2008-1.1.1 Number 226507-NMI3. Support was also received from The Aerosol Society in the form of a research scholarship: The C.N. Davies award.
  • 25. 25 6. References Abt, E., Suh, H. H., Catalano, P. and Koutrakis, P., 2000. Relative Contribution of Outdoor and Indoor Particle Sources to Indoor Concentrations. Environ. Sci. Technol. 34, 3579- 3587. Andersson, K. G., Roed, J., Byrne, M. A., Hession, H., Clark, P., Elahi, E., et al., April 2004. Airborne contamination in the indoor environment and its implications for dose. Riso National Laboratory, Roskilde. Riso-R-1462(EN). Contract No.: FIKR-CT-2000- 00043. ISSN: 0106-2840. ISBN: 87-550-3318-0 (internet). Bénesse, M., Coq, L. L. and Solliec, C., 2006. Collection efficiency of a woven filter made of multifiber yarn: Experimental characterization during loading and clean filter modeling based on a two-tier single fiber approach. J. Aerosol Sci. 37, 974-989. Bohne, J.E. and Cohen, B.S., 1995. Aerosol Resuspension from Fabric: Implications for Personal Monitoring in the Beryllium Industry. A.I.H.A. J. (Fairfax, Va). 46, 73-79. Braun, W. X , Cicciarelli, B. A., Davidson, D. L., Hart, E. H., Luedtke, A., McIntosh, K., and Peoples, P. R., 2002. Indoor pollutant measurement and modeling, comparing impact of surface characteristic. Proceedings of Indoor Air 2002, the 9th International Conference on Indoor Air Quality and Climate, Monterey, CA. 885–890. Cohen, B. S. and Positano, R., 1986. Resuspension of Dust From Work Clothing as a Source of Inhalation Exposure. A.I.H.A. J. (Fairfax, Va). 47, 255-258. Cooper, D.W. and Reist, P.C., 1973. Neutralizing charged aerosols with radioactive sources. J. Colloid Interface. Sci. 45, 17-26. Ferro, A. R., Kopperud, R. J. and Hildemann, L. M., 2004. Source Strengths for Indoor Human Activities that Resuspend Particulate Matter. Environ. Sci. Technol. 38, 1759- 1764. Golovin, M. N., and Putnam, A. A., 1962. Inertial Impaction on Single Elements. Ind. Eng. Chem. Res. 1, 264-273. Haugen, N. E. L. and Kragset, S., 2010. Particle impaction on a cylinder in a crossflow as function of Stokes and Reynolds numbers. J. Fluid Mech. 661, 239-261. Hession, H., Byrne, M., Cleary, S., Andersson, K. G. and Roed, J., 2006. Measurement of contaminant removal from skin using a portable fluorescence scanning system. J. Environ. Radioact. 85, 196-204. Hinds, W. C., 1999. Aerosol Technology: Properties, behaviour, and measurement of airborne particles, second ed. A Wiley-Interscience Publication. ISBN 0-471-19410-7. Jayasekera, P. N., Watterson, J. D., Bell, J. N., Goddard, A. J. H., Minski, M. J., Apsimon, H. M., and Taylor-Russell, A. J., 1989. Aerosols containing activatable tracers for wind tunnel studies. Proceedings of the 2nd Annual Conference of the Aerosol Society. 107–
  • 26. 26 112. Lange, C., 1995. Indoor deposition and the protective effect of houses against airborne pollution [Ph.D. thesis]. Technical University of Denmark, DTU. Riss-R- 78O(en). ISBN 87-550-2024-0. Long, C. M., Suh, H. H. and Koutrakis, P., 2000. Characterization of indoor particle sources using continuous mass and size monitors. J. Air Waste Manage. Assoc. 50, 1236-1250. Ranz, W. E. and Wong, J. B., 1952. Impaction of Dust and Smoke Particles on Surface and Body Collectors. Ind. Eng. Chem. 44, 1371-1381. Rim, D. and Novoselac, A., 2009. Transport of particulate and gaseous pollutants in the vicinity of a human body. Build. Environ. 44, 1840-1849. Thatcher, T. L. and Layton, D. W., 1995. Deposition, resuspension, and penetration of particles within a residence. Atmos. Environ. 29, 1487-1497. Wessel, R.A. and Righi, J., 1988. Generalized Correlations for Inertial Impaction of Particles on a Circular Cylinder. Aerosol Sci. Technol. 9, 29-60. Wikipedia, http://en.wikipedia.org/wiki/Reel (dance), accessed Nov 19th , 2011. Wu, Y.-L., Davidson, C. I. and Russell, A. G., 1992. Controlled Wind Tunnel Experiments for Particle Bounceoff and Resuspension. Aerosol Sci. Technol. 17, 245-262.