More Related Content
Similar to The interaction of QDs with RAW264.7 cells_ nanoparticle quantification, uptake kinetics and immune responses study
Similar to The interaction of QDs with RAW264.7 cells_ nanoparticle quantification, uptake kinetics and immune responses study (20)
The interaction of QDs with RAW264.7 cells_ nanoparticle quantification, uptake kinetics and immune responses study
- 1. The interaction of QDs with RAW264.7 cells:
nanoparticle quantification, uptake kinetics and
immune responses study†
O. Gladkovskaya,ab
V. A. Gerard,c
M. Nosov,d
Y. K. Gun'ko,ce
G. M. O'Connora
and Y. Rochev*bf
Fluorescent semiconductor nanocrystals called quantum dots (QDs) have been proposed as a prominent bio-
imaging tool due to their exceptional optical properties. Typically the core size is not greater than 10 nm, thus
QDs don't obey models successfully developed and proved on practice for large particles (40–200 nm). This
makes it difficult to predict the behaviour of such small yet reactive species in physiological media. Despite the
benefits provided by QDs, the challenge of quantifying altered intracellular components remains
complicated, and is not clearly investigated, due to interaction of nanoparticles with different cellular
compartments. The goal of this work is to investigate uptake kinetics of small green-emitting TGA-capped
CdTe QDs with diameter as small as 2.1 nm and to quantify their accumulation inside the cells over the
time by flow cytometry. The effect on RAW264.7 monocyte–macrophage cell function and viability also
was studied, as monocytes play an important role in innate immunity. The optimal parameters (QD
concentration, exposure time, cell activation status) were found; the tested nanoparticles are proven to be
applied in short-term assays due to their quick ingestion and accumulation.
1. Introduction
Nano-sized particles of well-known bulk materials (such as silica,
carbon, titanium dioxide, etc.) have enabled many unique possi-
bilities in different technologies and disrupted existing technolo-
gies. Engineered nanoparticles are poised to make key impacts in
many biological and medical applications, like controllable drug
delivery and release systems,1–4
gene diagnostics, and bio-
imaging.5
The question of how these developments can be applied
safely in humans remains open. Fluorescent nanocrystals made of
semiconductor compounds are called Quantum Dots (QDs). These
nanomaterials were rst synthesized and named by M. Reed in
1985.6
Since that time various uses of QDs have been developed
including their applications in photonics, energy harvesting and
bio-imaging. Unlike organic uorochromes, the optical properties
of QDs include large Stokes shi, broad absorption and narrow
emission, bright uorescence and high resistance to photo-
bleaching. The set of unique size-tuneable optical characteristics,
ease of manufacturing, surface modication and bioconjugation
made them eligible alternates for organic dyes as uorescent
agents.7
However, the discovery of new molecular uorescent
tags and their alternates is under extensive research. For
example, steady uorescent response with good Stokes shi and
target mRNA binding has been achieved bio-constructs with
perylene-20
-amino-LNA as uorescence reporter.8
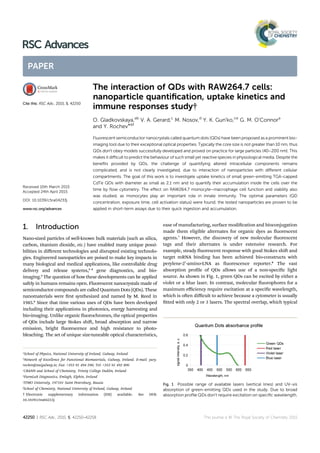
The vast
absorption prole of QDs allows use of a non-specic light
source. As shown in Fig. 1, green QDs can be excited by either a
violet or a blue laser. In contrast, molecular uorophores for a
maximum efficiency require excitation at a specic wavelength,
which is oen difficult to achieve because a cytometer is usually
tted with only 2 or 3 lasers. The spectral overlap, which typical
Fig. 1 Possible range of available lasers (vertical lines) and UV-vis
absorption of green-emitting QDs used in the study. Due to broad
absorption profile QDs don't require excitation on specific wavelength.
a
School of Physics, National University of Ireland, Galway, Ireland
b
Network of Excellence for Functional Biomaterials, Galway, Ireland. E-mail: yury.
rochev@nuigalway.ie; Fax: +353 91 494 596; Tel: +353 91 492 806
c
CRANN and School of Chemistry, Trinity College Dublin, Ireland
d
FarmLab Diagnostics, Emlagh, Elphin, Ireland
e
ITMO University, 197101 Saint Petersburg, Russia
f
School of Chemistry, National University of Ireland, Galway, Ireland
† Electronic supplementary information (ESI) available. See DOI:
10.1039/c5ra04233j
Cite this: RSC Adv., 2015, 5, 42250
Received 10th March 2015
Accepted 24th April 2015
DOI: 10.1039/c5ra04233j
www.rsc.org/advances
42250 | RSC Adv., 2015, 5, 42250–42258 This journal is © The Royal Society of Chemistry 2015
RSC Advances
PAPER
- 2. for organic dyes limits the number of colours that can be used in
single assay; QDs are not limited by this effect.
Fluorescent proteins (FPs) are great genetic labels which
have an option to be in-built into target. Being assembled
within a cell, they don't require further xing/permeabilising or
any other cell intervention by exogenous agents. This class of
uorescent tools has been widely explored in live in vivo and in
vitro imaging, and fundamental researches including protein
ageing, localisation, morphology etc. The history and applica-
tion of FPs is excellently described in review by Chudakov9
and
papers by Kremers10
and Chen.11
Unless exceptional set of
properties provided, FPs have few weak points: (1) large size
(25 kDa, whereas molecular uorophores are just 1 kDa in
average) (2) extreme susceptibility to media conditions; even
minor pH uctuations are able to impair FP stability and hence
optical properties.
Quantum Dots are shown as prospective uorescent tags in a
range of bio-conjugates, including anti-cancer antibodies,
drugs and receptors.12–15
More details about in vitro and in vivo
targeting, delivery and imaging can be found in reviews.16–18
Molecular Beacons (MBs) technology is a powerful tool in live
bio-imaging,19
disease diagnostics and molecular recogni-
tion.20,21
Based on the biochemical principle of selective
complementary nucleobases binding, MBs enable single-base
DNA mismatch detection. It plays a key role in mutations and
other pathological alterations detection. Upon binding of
complementary sequence, MB opens and thus release a uo-
rophore. Subsequently, basic hairpin approach has been enor-
mously improved and tted to different ways of application and
recently, such kind of technique is widely implemented in real-
time PCR monitoring,22
developing DNA sensors,23
investiga-
tions of gene activity,24,25
bio-imaging and cancer targeting,26
DNA–protein interactions.27
However, the highest FRET
response level and signal-to-noise ratio were achieved using
semiconductor QDs as uorescent moiety.20,21
In our group we
have carried out the graing of molecular beacons to QDs.
Obtained hybridized nanoprobes have demonstrated improved
optical characteristics, absence of background noise and high
affinity to chosen target (data not published).
The inherent function of macrophages is to engulf species
recognized as “non-self”, such as dead cell debris and bacteria.
Macrophage cell response is the rst line in adaptive immunity,
their surface has a number of markers susceptible to both toll-
like receptors (TLR) and mannose receptors. Another category
of surface proteins is responsible for triggering inammation
cascades by expressing inammatory interleukins (IL), chemo-
kines, cytokines, reactive oxygen species (ROS), nitrite oxide
(NO) and cyclooxygenases (COX). Macrophage cells are a
convenient in vitro model for investigations on QD endocytosis
and their further tracking due to quick ingestion within the
time scale of live bio-imaging (within a few hours). It can help
evaluate all the reactions correctly for objective results to be
realised regarding particle efficacy and toxicity.
The main purpose of this work is to describe the uptake
kinetics of small nanoparticles (2.1 nm) over the time; also we
aimed to develop a simple method for quantum dot intracel-
lular quantication and to investigate QD behaviour at different
levels of interaction in physiological media conditions. Particles
toxicity, intracellular uorescence, inammatory markers
expression and cell death mechanism were investigated at 12
and 24 hours time points. Flow cytometry was used to measure
cellular responses and quantify nanoparticle ingestion at a
specic population level.
2. Materials and methods
2.1 QDs synthesis
CdTe QDs were synthesised according to a previously published
procedure.28
Briey, Al2Te3 reacted with sulphuric acid to
produce H2Te gas which was bubbled through an aqueous
solution of CdCl2, thioglycolic acid (TGA) and 0.3 g of gelatin,
with pH buffered at 11. The molar ratio of Cd : Te : TGA was
1 : 0.25 : 1.4. The reaction mixture was then heated under reux
for 2 to 48 hours depending of the desired nanoparticle size.
Narrow size distribution fractions were collected via size-
selective precipitation using isopropanol.
2.2 UV-vis and PL spectra
Absorbance was examined on a Shimadzu UV-1601 spectro-
photometer; distilled water was taken as a baseline. PL spectra
were recorded on a Cary Eclipse spectrometer. All measure-
ments were performed to characterize the optical properties of
the nanoparticles obtained. More detailed description of as-
prepared QDs can be found in the papers previously pub-
lished by our group.29,30
2.3 Cell culture
RAW264.7 murine macrophages cell line was used in this study.
Cells were cultured in Dulbecco's Modied Eagle Media
(DMEM; Sigma), supplemented with 10% Foetal Bovine Serum
(FBS; Sigma), 100 mg mLÀ1
of penicillin and 100 mg mLÀ1
of
streptomycin. Macrophages were maintained in a humidied
atmosphere with 5% CO2 at 37
C.
2.4 Fluorescent microscopy
Cell morphology was tested at each time point. Actin was
stained with phalloidin eFluor 760 (eBiosciences) according to
recommended procedure. Cells were seeded in density 50 000
per well in 4-well chamber slide and let grow overnight. Next day
QDs solution was added to the slides and incubated for further
12 or 24 hours. Untreated monocytes were used as control.
Aerwards cells were removed from incubator, washed with PBS
and xed with 4% PFA for 15 minutes. Fixed cells were per-
meabilised with 0.2% TritonX solution for 5 min, washed with
PBS and stained with phalloidin for 1 hour. DAPI solution was
added to stain nuclei; the slides were viewed immediately under
inverted uorescent microscope.
Live/Dead Assay (Life Technologies) was used to visualize
viable and necrotic cells. Cells were treated with QDs as
described above. Aer co-incubation, samples were washed
with PBS and stained with calcein and ethidium bromide from
the kit as recommended by manufacturer. Slides were pro-
ceeded within an hour for uorescent microscopy.
This journal is © The Royal Society of Chemistry 2015 RSC Adv., 2015, 5, 42250–42258 | 42251
Paper RSC Advances
- 3. 2.5 Double stranded-DNA (ds-DNA) quantication
Quant-iT PicoGreen ds-DNA Assay Kit was used for a precise
counting cell number in the probe. The cells were seeded in a
24-well plate to a density of 1 Â 105
cells per well, 24 hours prior
to experiment. Different types of QDs (either TGA or TGA-
gelatin-covered) within a range of concentrations (1–100 nM
nal concentration) were added to macrophages. Aer 24 hours
of co-incubation, the cells were progressed to PicoGreen assay
according to protocol.
2.6 Annexin V apoptosis assay
In this assay cells were seeded to a density of 2.5 Â 105
cells per
well in 6 well-plates. Aer 24 hours of culture, appropriate
amounts of QDs were added to each well. Control samples
remained untreated. Cells were co-incubated with or without
nanoparticles for 12 or 24 hours. Samples were harvested on the
day of analysis. Briey, the reduced media was removed and the
cells were washed twice with phosphate buffered saline (PBS).
Macrophages were harvested by pipetting in fresh media and
then were placed in Eppendorf tubes. Cells were washed twice
with PBS immediately aer harvesting, re-suspended in 500 mL
buffer and stained with viability dye according to protocol.
Aerwards cells were washed with serum-containing buffer.
Finally, cells were prepared and stained with Annexin V
Apoptosis Assay Kit (eBioscience) and directly proceeded to ow
cytometry. All measurements were performed on BD FACS
Canto A tted with 2 lasers (blue, 488 nm; red, 633 nm) and 6
available colours. Unstained cells, single-stained samples, and
cells treated with QDs only (without further staining) were used
as quality controls.
2.7 QDs uptake and CD80/86 surface markers expression
Flow cytometry was used to detect the amount of internalized
nanoparticles and to measure the expression of pro-
inammatory receptors caused by exposure to QDs. All
measurements were performed on BD FACS Canto A. In this
experiment cells were seeded into 6-well plates to a density of
2.5 Â 105
cells per well and le 24 hours to adhere. The next day,
macrophages were loaded with QDs within a range of concen-
trations (1–100 nM nal concentration). Aer 12 hours of
treatment (for the CD86 study) and 24 hours (for the CD80
study), the probes were proceeded to the assay according to a
standard protocol. Armenian hamster IgG and Rat IgG2a K were
used as isotype controls for CD80 and CD86, respectively. All
antibodies and isotype controls were purchased from BioL-
egend. The standard staining protocol recommended by
manufacturer was employed. APC (Allophycocyanin) and FITC
(Fluorescein Isothiocyanate) channels were used as references
for signal detection. FlowJo soware was used for interpretation
of results.
2.8 PMA activation and CD86 expression study
Phorbol 12-myristate 13-acetate (PMA) was used to activate
monocytes as described elsewhere.31,32
Cell cultures were
prepared as described above. Cell culture media was
supplemented with 100 ng mLÀ1
of PMA and monocytes were
conditioned for 6 hours. Aerwards PMA containing media was
replaced by QD solution in normal media. The cells were co-
incubated with nanoparticles for 12 hours and proceeded
CD86 assay as in previous section. Unprimed monocytes, cells
treated only with PMA or QDs and isotype stain were used as
controls.
2.9 Quantication of QDs
The amount of ingested nano-crystals was dened by FlowJo
soware. At least 10 000 events were recorded per tube.
Consistent macrophage population was selected from light
scatter graph, the level of uorescence in FITC channel was
evaluated from a histogram plot; the geometric mean value was
used quantitatively as a statistical parameter. The percentage of
population of interest was found from the overlay of two
histograms of cells treated with QDs and untreated controls in
the reference channel.
3. Results
3.1 PicoGreen assay
Fig. 2 presents the results of ds-DNA quantication taken at 24
hours co-culture. Only 100 nM concentration signicantly
reduces the number of viable cells (either due to necrosis or
apoptosis). The inert reaction on 1 and 10 nM can be explained
by the threshold effect: a certain critical concentration of
particles in system should be achieved to trigger ingestion. To
prove it, independent ow cytometry measurements were taken
to evaluate intracellular amount of QDs.
3.2 Cell morphology and Live/Dead assay
Monocytes demonstrate healthy round morphology, actin is
uniformly spread compactly around cells without any disrup-
tion in samples with QDs concentration less than 100 nM at
both time points. Exposure to high concentration of nano-
particles leads to signicant reduction cell number. Aer
24 hours of treatment morphology changes were detected; Fig. 1
in ESI† shows partial nuclei swallowing and necrosis charac-
terised by fracture. Live/Dead assay showed similar results; was
conrmed drop in cell number at 100 nM concentration, as well
Fig. 2 ds-DNA content in cells introduced to green TGA QDs for 24
hours at various concentrations. The low dosage (1 and 10 nM) did not
cause any effect in cells. Exposure to high concentration is resulted in
significant cell death.
42252 | RSC Adv., 2015, 5, 42250–42258 This journal is © The Royal Society of Chemistry 2015
RSC Advances Paper
- 4. increase in viable/necrotic cell ratio towards necrotic cells (see
Fig. 2 in ESI†).
3.3 QDs quantication
The FlowJo soware was employed to convert uorescent
emission from cells to relative amount of ingested nano-
particles. Gated consistent cell population with narrow distri-
bution prole was plotted in FITC (green) uorescence channel.
In all samples histograms represented normal distribution.
Signal from cells in the control group (which did not receive
any nanoparticles) was taken as baseline. To estimate the
percentage of population which ingested quantum dots, histo-
grams of control and treated samples were overlaid. The overlap
area was excluded from analysis. Bright sub-population inges-
ted QDs is shied to the right. By integrating the shied area
can be found the percentage of cells which took up quantum
dots.
The intensity of uptake in the reference channel with respect
to untreated cells can be semi-quantitatively described. The
geometric mean was taken as the signal value; however, other
statistic options (median or mean values) are also applicable,
due to the fact that the system behaves as a normal distribution.
3.4 QDs internalizing
Flow cytometry allows accurate collection of uorescent signal
which are quantized for each cell. Cells were grown in presence
of QDs for 12 and 24 hours, respectively. Control cultures didn't
contain any particles. Comparing ow cytometry data to the
results of the PicoGreen study, where no alterations in ds-DNA
content in samples treated with the same amount of nano-
particles were observed, it can be concluded that there is no
detectable uptake in the case of treatment with concentrations
1–10 nM. Drastic changes were observed for samples exposed to
100 nM. At the 12 hour time point, the tested QDs demonstrated
higher uorescence amplication ratio – compared to untreated
cells. However, 12 hours later there was not much difference
among all probes (Fig. 3).
3.5 Apoptosis or necrosis?
To answer this question monocytes were cultured for 12 or
24 hours with QDs and subsequently submitted to an Annexin V
assay. The Annexin V kit was used to distinguish apoptotic
versus necrotic cells stained with xable viability dye according
to protocol. Notable alterations were found in probes treated
with 100 nM of QDs. Lower concentrations did not induce any
differences compared to control. FITC positive subsets were
chosen from histogram overlay of untreated control and 100 nM
exposed cells (Fig. 4C and D). The selected sub-population was
divided into 4 quadrants in Annexin V vs. Viability dye channels.
Contribution of viable, necrotic, early and late apoptotic cells to
uptake was calculated from the mean value of QD uorescence
spectra (FITC). Total uptake was performed as integrated value
(number of events in each subset multiplied by mean uores-
cence). Fig. 4 represents the resulting signal distribution
acquired on 12 and 24 hours respectively.
Fig. 3 (A and B) Green TGA QDs uptake after 12 or 24 hours of co-culture with RAW264.7 cells. The concentration range is 1–100 nM. Similar to
PicoGreen, low concentration (1–10 nM) did not affect the cells. 2.5-folds fluorescence increase is detected at 12 hours acquisition (A), whereas
at 24 hours (B) there's very little difference from control. It can be explained by massive cell death in between 12 and 24 hours and QDs release in
cell culture media. (C and D) Uptake histograms obtained from apoptosis/necrosis assay at 12 (C) and 24 (D) hours tests. X-axis is common
logarithm of fluorescent intensity in reference green (FITC) channel. Y-axis is frequency of data distribution. Red line is control (cells did not
treated with nanoparticles), blue line is 100 nM treated cells. The overlap area is excluded from uptake count; only cells in area shifted to the right
along x-axis are considered in further analysis as containing QDs.
This journal is © The Royal Society of Chemistry 2015 RSC Adv., 2015, 5, 42250–42258 | 42253
Paper RSC Advances
- 5. The general tendency is a small number of early apoptotic
cells and a low level of uorescence from necrotic cells
regardless time of exposure. Due to small size and a lack of
protective coating, green TGA nanoparticles were quickly
ingested by the cells with signicant accumulation (85% posi-
tive events) resulted in strong signal. It caused a signicant shi
to late apoptosis stage (86% of FITC positive sub-population)
observed aer 12 hours of co-incubation. Late apoptotic
subset appears as the main contributor to detected uorescent
signal.
The effects observed aer longer time of cell-culture in
presence of QDs are determined by intracellular processes
triggered by trapping foreign species. Introduction to high
concentration of small QDs inevitably led to the degradation of
the stabilizing shell and further particle aggregation. Rapidly
ingested green TGA-capped QDs caused massive apoptosis and,
consequently, cell cleavage. A small percentage of surviving cells
showed the less uptake and harvested signal from all QD-
treated cells studied here. These observations were conrmed
by transmission electron microscopy (TEM) microscopy –
signicant morphological changes (cytoplasm granulation,
chromatin condensation, mitochondria blebbing, presence of
QDs in nucleus) were spotted for 100 nM treated probes (see
Fig. 3 ESI†); Live/Dead assay demonstrated sudden drop in cell
number.
3.6 CD80/86 pro-inammatory markers expression
Foreign bodies ingested by macrophages can cause inamma-
tory response as defence reaction. CD80/86 are early pro-
inammatory receptors expressed on RAW264.7 cell surface.
These two markers were chosen as convenient indicators to
monitor the inammation process triggered by the QDs. CD80/
86 expression was measured simultaneously with particle
uptake using ow cytometry. Fig. 5 demonstrates the results of
the assays. CD86 expression was acquired aer 12 hours of cell
treatment with nanoparticles, as this marker is activated earlier
than CD80 which was measured at the 24 hour time point. Cells
co-incubated with low concentrations of QDs (1–10 nM)
demonstrated increased levels of both receptors. It was expec-
ted that at 100 nM QD concentration, the level of inammatory
markers would be signicantly higher due to intensive inter-
nalizing and consequent activation of defence mechanism
cascades. However the analysed markers were inhibited in this
experiment. Fig. 5 depicts observed macrophage behaviour. To
investigate on such unexpected effect, cells were activated by
PMA followed by QD exposure, the same pattern was detected –
Fig. 4 The contribution of each subset in total observed fluorescence
from FITC-positive sub-population after 12 or 24 hours of co-incu-
bation RAW264.7 monocytes with 100 nM green TGA QDs. Legend:
necrotic – dead cells followed necrosis pathway, early A – cells in early
apoptosis, late A – cells in late apoptosis, viable – live undamaged
cells. At 12 hours time point the strongest signal is produced by the
cells in late apoptotic stage. At 24 hours signal level is dropped down
due to dead cells cleavage and QDs release in the media.
Fig. 5 (A and B) CD80/86 expression of unconditioned monocytes at 12 and 24 hours time-points, respectively. Drastic down-regulation of both
markers is observed for cells treated with 100 nM QDs. It's related to high number of non-functional (necrotic, late apoptotic) cells and hence
their failure to proper expression of the surface molecules. (C) CD86 expression after preliminary activation of monocytes with PMA for 6 hours.
Cells were exposed to green TGA QDs for 12 hours after priming. The activation is confirmed by elevated production of CD86 comparing to
unconditioned cells. The same behaviour is observed in non-primed monocytes, where the CD86 expression is knocked down in 100 nM case.
(D) Uptake pattern for the cells activated by PMA for 6 hours and treated with green TGA QDs for 12 hours.
42254 | RSC Adv., 2015, 5, 42250–42258 This journal is © The Royal Society of Chemistry 2015
RSC Advances Paper
- 6. CD86 was suppressed aer 12 hours of treatment with
nanoparticles.
4. Discussion
Exposure to low doses of QDs (1 and 10 nM) doesn't affect cell
function and viability at any time point. Nanoparticles uptake is
not linear process, the saturation level has to be achieved to
trigger effective ingestion.33
Highest tested concentration
100 nM had resulted in massive uptake by the cell and number
of consequent effects. Fig. 4 shows total intensity of recorded
uorescence and contribution of each cellular subset. It
suggests that green TGA QDs due their small size quickly
penetrate cells and cause cell damage and death, what we
observe aer 12 hours of co-incubation. Aerwards, found
impaired cells with high amount of QDs are destroyed physi-
cally and release nanoparticles back to the media.
The majority of cells take up QDs in rst 2 hours (according
to Chitrani and Chan's model),33
followed by their cycle shut
down and apoptosis trigger. Early apoptosis is observable aer
further 2–4 hours of co-culture; as it's quick stage, has not been
detected at nal 12 hours ow cytometry experiment. Next 4–
6 hours late apoptosis is developing, what was observed in
experiment. In summary, aer 12 hours we have 2 subsets: the
small one is without QDs, and the majority one where cells are
appeared to ingest nanoparticles, which caused disruption of
cell cycle and promoted apoptosis up to late stage. A small
amount of live and necrotic cells were also found (1–2%).
In next 12 hours late apoptotic cells are getting eliminating
from the system; those survived 1% might undergo 1 division; it
gives us a small increase in uorescent response. We presume
that nothing is happening in resistant subset, so it remains
neutral to QDs. As result we observe that only 19% of cells have
QDs; nearly 60% of this subset are viable and 40% are necrotic.
The increase in uptake signal is negligible comparing to
12 hours response.
It has been shown that nanoparticles uptake depends on
number of factors, such as particle size, coating, composition,
surface charge, shape, protein corona formation, cytotoxicity,
cell type.33–38
In several works was developed and proved model
which states that uptake is happening regardless phase of cell
cycle, saturation is achieved once cell underwent full cycle.39,40
This study was conducted for non-toxic polymer particles
(diameter is z40 nm). It can be extrapolated to our case, but
with certain limitations, as QDs are potent to arrest cell
cycle.41–43
Besides the doubling time, as well as cell type should
be take in consideration: macrophages are professional
phagocytes which supposed to ingest and destroy foreign body
once it's recognised as “non-self”. RAW264.7 macrophage-like
cell line has been shown as fastest ingesting cell type with
high uptake rate.44,45
Another feature of this cell line is short
doubling time – only 11 hours, comparing to HeLa, A549 or
U937 cell lines which have 24 hours cell cycle duration.
The prevalent mechanism of nanotoxicity is still under
debate. Oxidative stress occurs when cells are treated with
nanoparticles and changes mitochondria membrane potential
in response. In a classical apoptotic pathway, increased
mitochondrial permeability results in cytochrome c release and
consequent caspase – 9, 3, 6 and 7 cascades activation. The rst
target is damaged mitochondria itself and ROS generation.
Wilhelmi had showed that this mechanism takes place in
RAW264.7 cells treated with ZnO nanoparticles.46
At the same
time the results of TEM analysis suggest the heterogeneity of
cell death: necrotic “ghost cells” were also been found as well as
apoptotic hallmarks. Moreover, caspase-independent apoptotic
route was shown in caspase-9 decient Jurkat T lymphocytes.
The observed cell death mechanisms “combo” has not been
related to any particular factors. Same effect – simultaneous
presence of apoptosis and necrosis – was studied by M. Liu47
in
A549 lung cancer cells exposed to 10 nm gold nanoparticles.
The presence of caspase-independent apoptosis has also been
proved by activity of AIF and EndoG proapoptotic factors –
triggers of chromatin condensation and DNA shredding.
Interestingly, the experiments had different time scale – 6 hours
for monocytes and 72 hours for cancer cells, but the same
outcome. That's in line with the intrinsic cell lines properties –
cancer cells are more inert to nanoparticles rather than actively
ingesting macrophages.44
Controversially, Pan et al.48
observing
same pattern in HeLa cells treated with 1.4 nm Au nano-
particles, had excluded apoptosis by the fact that zVAD-fmk
inhibitor did not prevent cell death hence only necrosis is
happening, regardless fact of massive oxidative stress and
mitochondria disruption. Caspase 3/7 activity was tested and
did not show signicant up-regulation in nanoparticle treated
cells, but this is the only apoptosis marker has been examined.
Basing on later observations of other groups mentioned
here46,47,49
we can speculate that caspase-independent mecha-
nism might have place. Surprisingly, larger (over 60 nm) “non-
toxic” silver nanoparticles had continued the trend in causing
cell death through both mechanisms.49
Foldbjerg et al. used
THP-1 human leukemic monocyte cell line exposed up to 24
hours to Ag nano-crystals and described “typical” picture – high
ROS production, fragmented DNA, large amounts of apoptotic
and necrotic cells (Annexiv/PI assay). It's hard to say whether co-
existence of apoptosis and necrosis has competitive49
or co-
dependent47
nature. Taken together, our results are in concor-
dance with described above cases, unless QDs are considered as
potentially highly toxic agents due to presence of Cd and Te and
their small size (2 nm), whereas other studies are dealing with
relatively “cell friendly” compounds (Ag, Au, ZnO) and species
of similar or greater dimensions. It has to be admitted, that
further tests are required to full the knowledge in molecular
mechanisms regulating and defying cell fate (apoptosis,
necrosis, surveillance) upon the exposure to any nanoparticles,
especially to those in a 1–10 nm size range.
It was expected that activity of pro-inammatory markers
CD80/86 will be elevated within the introduced QD concentra-
tion. In fact, monocytes did not respond on 1 and 10 nM and got
signicantly down-regulated when treated with 100 nM. Similar
results were observed for other nanoparticles as well, but the
source of the phenomenon was not investigated.50–52
Tsai et al.,
2012 (ref. 53) attempted to explain inhibition of TLR9 signalling
by 4 nm gold NPs in either bone marrow derived primary
macrophages and RAW264.7 cell line. They attributed this
This journal is © The Royal Society of Chemistry 2015 RSC Adv., 2015, 5, 42250–42258 | 42255
Paper RSC Advances
- 7. down-regulation to particles with the largest surface-to-volume
ratio for NPs ranged up to 45 nm. Hoshino et al., 2009 (ref.
54) showed in in vivo and in vitro experiments that CdSe QDs
didn't cause an elevation of anti-bacterial defenders IL-6 and
TNF-alpha in peritoneal macrophages, but arrested prolifera-
tion of CD4+ T-lymphocytes. It could be related to molecules
irresponsiveness to such stimuli as QDs. Thus we carried out
another experiment where monocytes were pre-activated by
PMA for 6 hours and then treated with QDs for 12 hours.
Compared to unconditioned cells, PMA activation had nearly 3
times greater CD86 expression level. The response to low dosage
is negligible, whereas 100 nM again arrested CD86 production.
We can conclude that the observed disfunction in both cases is
consequence of cell damage caused by ingestion of the QDs at
100 nM concentration. Intriguingly uptake pattern for activated
monocytes incubated for 12 hours with QDs is the same as for
unprimed cells exposed to the same conditions for 24 hours.
This is the result that alerted by PMA monocytes are actively
ingesting QDs and accelerate cell damage processes. Thus
activated monocytes can be used as active cargo to deliver
nanoparticles to target cell or inamed sites.
5. Conclusion
Flow cytometry was explored for quantication of intracellular
QDs. Three different concentrations of QDs (1, 10 and 100 nM)
were introduced to cell cultures. Only the highest one – 100 nM
– was found effective with regards to uptake. We propose that
lower concentrations were unable to form vesicles suitable for
ingestion, as it was shown by Chithrani and Chan, 2007.33
Due
to complexity of interaction between QDs and cell culture
proteins, surface receptors and cellular organelles, the esti-
mated number of nanoparticles we added to cells is not the
same as that detected aer certain time of co-incubation. In
other words, the initial particles and QDs inside the cells are
different species. The advantage of ow cytometry is that it
offers a quick measurement of the uorescent signal from a
large number of cells which in turn provides a comprehensive
outlook on population level. It helps to evaluate amount of
particles taken up without bias. This is important as in nal
distribution one can nd some cells either with low and high
uorescence, whereas geometric mean value is a more accurate
representation of population.
The exposure to nanoparticles caused unexpected immune
responses: we believed that the expression of pro-inammatory
surface markers (CD80/86) would be upregulated in dose-
dependent manner. In fact neither 1 nor 10 nM QDs affected
the aforementioned parameters. In the case of 100 nM
concentration, both receptors were drastically reduced (less
than 50% of control). Given the Annexin V assay results this
change is not controversial as the majority of cells with high
amount of ingested QDs are apoptotic.
The obtained results address few questions to future inves-
tigation. First of all, to evaluate the accuracy of ow cytometry,
mass spectrometry should be carried out to make a clear
correlation between intracellular cadmium content and
observed uorescence. It will also help to understand how QD
uorescent signal changes aer interaction with cellular
compartments. Further, it's always an open question how much
cell line results can be extrapolated on primary cells; next step
will be measurement same parameters in primary cultures,
particularly antigen presenting cells (e.g. monocytes/
macrophages, dendritic cells). It should include an investiga-
tion on mechanism behind cell activation and signalling
molecules expression upon QD uptake and exposure.
Acknowledgements
This work was conducted under the framework of INSPIRE, the
Irish Government's Programme for Research in Third Level
Institutions Cycle 5, National Development Plan 2007–2013 with
the assistance of the European Regional Development Fund and
the Ministry of Education and Science of the Russian Federation
(Grant no. 14.B25.31.0002). Authors are grateful to Shirley Hanley
(PhD, NCBES) for help with ow cytometry experiments and Pierce
Lalor (Centre for Microscopy and Imaging, Anatomy Department,
NUI Galway) for support with TEM processing and imaging.
References
1 R. N. Mitra, M. Doshi, X. Zhang, J. C. Tyus, N. Bengtsson,
S. Fletcher, B. D. G. Page, J. Turkson, A. J. Gesquiere,
P. T. Gunning, G. A. Walte and S. Santra, An activatable
multimodal/multifunctional nanoprobe for direct imaging
of intracellular drug delivery, Biomaterials, 2012, 33, 1500–
1508, DOI: 10.1016/j.biomaterials.2011.10.068.
2 K. V. Chakravarthy, B. A. Davidson, J. D. Helinski, H. Ding,
W.-C. Law, K. T. Yong, P. N. Prasad and P. R. Knight,
Doxorubicin-conjugated quantum dots to target alveolar
macrophages and inammation, Nanomedicine, 2011, 7,
88–96, DOI: 10.1016/j.nano.2010.09.001.
3 Q. Yuan, S. Hein and R. D. K. Misra, New generation of
chitosan-encapsulated ZnO quantum dots loaded with
drug: Synthesis, characterization and in vitro drug delivery
response, Acta Biomater., 2010, 6, 2732–2739, DOI: 10.1016/
j.actbio.2010.01.025.
4 H. Pawar, D. Douroumis and J. S. Boateng, Preparation and
optimization of PMAA–chitosan–PEG nanoparticles for oral
drug delivery, Colloids Surf., B, 2012, 90, 102–108, DOI:
10.1016/j.colsur.2011.10.005.
5 Z. Li, K. Wang, W. Tan, J. Li, Z. Fu, C. Ma, H. Li, X. He and
J. Liu, Immunouorescent labeling of cancer cells with
quantum dots synthesized in aqueous solution, Anal.
Biochem., 2006, 354, 169–174, DOI: 10.1016/j.ab.2006.04.029.
6 M. A. Reed, et al., Spatial quantization in GaAs–AlGaAs
multiple quantum dots, J. Vac. Sci. Technol., B:
Microelectron. Process. Phenom., 1986, 4, 358, DOI: 10.1116/
1.583331.
7 P. K. Chattopadhyay, D. A. Price, T. F. Harper, M. R. Betts,
J. Yu, E. Gostick, S. P. Perfetto, P. Goepfert, R. A. Koup,
S. C. De Rosa, M. P. Bruchez and M. Roederer, Quantum
dot semiconductor nanocrystals for immunophenotyping
by polychromatic ow cytometry, Nat. Med., 2006, 12(8),
972–977, DOI: 10.1038/nm1371.
42256 | RSC Adv., 2015, 5, 42250–42258 This journal is © The Royal Society of Chemistry 2015
RSC Advances Paper
- 8. 8 I. V. Astakhova, V. A. Korshun, K. Jahn, J. Kjems and
J. Wenge, Perylene Attached to 20
-Amino-LNA: Synthesis,
Incorporation into Oligonucleotides, and Remarkable
Fluorescence Properties in Vitro and in Cell Culture,
Bioconjugate Chem., 2008, 19, 1995–2007, DOI: 10.1021/
bc800202v, DOI: .
9 D. M. Chudakov, M. V. Matz, S. Lukyanov and
K. A. Lukyanov, Fluorescent proteins and their applications
in imaging living cells and tissues, Physiol. Rev., 2010, 90,
1103–1163, DOI: 10.1152/physrev.00038.2009.
10 G.-J. Kremers, S. G. Gilbert, P. J. Cranll, M. W. Davidson
and D. W. Piston, Fluorescent proteins at a glance, J. Cell
Sci., 2011, 124, 2157–2160, DOI: 10.1242/jcs.072744.
11 T.-W. Chen, T. J. Wardill, Y. Sun, S. R. Pulver,
S. L. Renninger, A. Baohan, E. R. Schreiter, R. A. Kerr,
M. B. Orger, V. Jayaraman, L. L. Looger, K. S. Svoboda and
D. S. Kim, Ultra-sensitive uorescent proteins for imaging
neuronal activity, Nature, 2013, 499(7458), 295–300, DOI:
10.1038/nature12354.
12 H. Tada, H. Higuchi, T. M. Wanatabe and N. Ohuchi, In vivo
real-time tracking of single quantum dots conjugated with
monoclonal anti-her2 antibody in tumors of mice, Cancer
Res., 2007, 67, 1138–1144, DOI: 10.1158/0008-5472.can-06-
1185.
13 X. Gao, Y. Cui, R. M. Levenson, W. K. L. Chung and S. Nie, In
vivo cancer targeting and imaging with semiconductor
quantum dots, Nat. Biotechnol., 2004, 22(8), 969–976, DOI:
10.1038/nbt994.
14 J. Pan and S.-S. Feng, Targeting and imaging cancer cells by
folate-decorated, quantum dots (QDs)-loaded nanoparticles
of biodegradable polymers, Biomaterials, 2009, 30, 1176–
1183, DOI: 10.1016/j.biomaterials.2008.10.039.
15 R. Savla, O. Taratula, O. Garbuzenko and T. Minko, Tumor
targeted quantum dot-mucin 1 aptamer–doxorubicin
conjugate for imaging and treatment of cancer,
J. Controlled Release, 2011, 153, 16–22, DOI: 10.1016/
j.jconrel.2011.02.015.
16 I. L. Medintz, H. T. Uyeda, E. R. Goldman and H. Mattoussi,
Quantum dot bioconjugates for imaging, labelling and
sensing, Nat. Mater., 2005, 4, 436–446, DOI: 10.1038/
nmat1390.
17 V. Biju, S. Mundayoor, R. V. Omkumar, A. Anas and
M. Ishikawa, Bioconjugated quantum dots for cancer
research: Present status, prospects and remaining issues,
Biotechnol. Adv., 2010, 28, 199–213, DOI: 10.1016/
j.biotechadv.2009.11.007.
18 A. M. Smith, H. Duan, A. M. Mohs and S. Nie, Bioconjugated
quantum dots for in vivo molecular and cellular imaging,
Adv. Drug Delivery Rev., 2008, 60, 1226–1240, DOI: 10.1016/
j.addr.2008.03.015.
19 J. Alexander, A. Pandit, G. Bao, D. Connolly and Y. Rochev,
Monitoring mRNA in living cells in a 3D in vitro model
using TAT-peptide linked molecular beacons, Lab Chip,
2011, 11, 3908–3914, DOI: 10.1039/c1lc20447e.
20 S.-M. Wu, et al., Direct uorescence in situ hybridization
(FISH) in Escherichia coli with a target-specic quantum
dot-based molecular beacon, Biosens. Bioelectron., 2010, 26,
491–496, DOI: 10.1016/j.bios.2010.07.067.
21 N. C. Cady, A. D. Strickland and C. A. Batt, Optimized linkage
and quenching strategies for quantum dot molecular
beacons, Mol. Cell. Probes, 2007, 21, 116–124, DOI:
10.1016/j.mcp.2006.09.001.
22 A. C. Yeo, K. P. Chan, G. Kumarasinghe and H. K. Yap, Rapid
detection of codon 460 mutations in the UL97 gene of
ganciclovir-resistant cytomegalovirus clinical isolates by
real-time PCR using molecular beacons, Mol. Cell. Probes,
2005, 19, 389–393, DOI: 10.1016/j.mcp.2005.06.008.
23 X. Liu, W. Farmerie, S. Schuster and W. Tan, Molecular
Beacons for DNA Biosensors with Micrometer to
Submicrometer Dimensions, Anal. Biochem., 2000, 283, 56–
63, DOI: 10.1006/abio.2000.4656.
24 T. Kihara, N. Yoshida, T. Kitagawa, C. Nakamura,
N. Nakamura and J. Miyake, Development of a novel
method to detect intrinsic mRNA in a living cell by using a
molecular beacon-immobilized nanoneedle, Biosens.
Bioelectron., 2010, 26, 1449–1454, DOI: 10.1016/
j.bios.2010.07.079.
25 L. C. Riches, A. M. Lynch and N. J. A. Gooderham, Molecular
beacon approach to detecting RAD52 expression in response
to DNA damage in human cells, Toxicol. In Vitro, 2010, 24,
652–660, DOI: 10.1016/j.tiv.2009.09.019.
26 J. K. Kim, K.-J. Choi, M. Lee, M. Jo and S. Kim, Molecular
imaging of a cancer-targeting theranostics probe using a
nucleolin aptamer- and microRNA-221 molecular beacon-
conjugated nanoparticle, Biomaterials, 2012, 33, 207–217,
DOI: 10.1016/j.biomaterials.2011.09.023.
27 J. Vitko, J. Rujan, L. Androga, I. Mukerji and P. H. Bolton,
Molecular Beacon-Equilibrium Cyclization Detection of
DNA–Protein Complexes, Biophys. J., 2007, 93, 3210–3217,
DOI: 10.1529/biophysj.106.097642.
28 S. J. Byrne, Y. Williams, A. Davies, S. A. Corr, A. Rakovich,
Y. K. Gunko, Y. P. Rakovich, J. F. Donegan and Y. Volkov,
Jelly Dots, Synthesis and Cytotoxicity Studies of CdTe
Quantum Dot–Gelatin Nanocomposites, Small, 2007, (7),
1152–1156, DOI: 10.1002/smll.200700090.
29 V. A. G´erard, Y. K. Gun'ko, B. R. Prasad and Y. Rochev,
Synthesis of Biocompatible Gelatinated Thioglycolic Acid-
Capped CdTe Quantum Dots, Jelly Dots, Nanoparticles in
Biology and Medicine: Methods and Protocols, Methods in
Molecular Biology, ed. M. Soloviev, Springer
Science+Business Media, LLC, 2012, vol. 906, DOI: 10.1007/
978-1-61779-953-2_21.
30 V. A. G´erard, C. M. Maguire, D. Bazou and Y. K. Gun'ko, Folic
acid modied gelatine coated quantum dots as potential
reagents for in vitro cancer diagnostics, J. Nanobiotechnol.,
2011, 9, 50, DOI: 10.1186/1477-3155-9-50.
31 S. Qiao, W. Li, R. Tsubouchi, M. Haneda, K. Murakami,
F. Takeuchi, Y. Nisimoto and M. Yoshino, Rosmarinic acid
inhibits the formation of reactive oxygen and nitrogen
species in RAW264.7 macrophages, Free Radical Res., 2005,
39(9), 995–1003, DOI: 10.1080/10715760500231836.
32 J. Gieche, J. Mehlhase, A. Licht, T. Zacke, N. Sitte and
T. Grune, Protein oxidation and proteolysis in RAW264.7
This journal is © The Royal Society of Chemistry 2015 RSC Adv., 2015, 5, 42250–42258 | 42257
Paper RSC Advances
- 9. macrophages: effects of PMA activation, Biochim. Biophys.
Acta, 2001, 1538, 321–328, DOI: 10.1016/S0167-4889(01)
00083-0.
33 D. B. Chithrani and W. C. Chan, Elucidating the mechanism
of cellular uptake and removal of protein-coated gold
nanoparticles of different sizes and shapes, Nano Lett.,
2007, 7(6), 1542–1550, DOI: 10.1021/nl070363y.
34 M. J. D. Cli, B. Rothen-Rutishauser, D. M. Brown, R. Duffin,
K. Donaldson, L. Proudfoot, K. Guy and V. Stone, The impact
of different nanoparticle surface chemistry and size on
uptake and toxicity in a murine macrophage cell line,
Toxicol. Appl. Pharmacol., 2008, 232, 418–427, DOI:
10.1016/j.taap.2008.06.009.
35 B. D. Chithrani, A. A. Ghazani and W. C. W. Chan,
Determining the Size and Shape Dependence of Gold
Nanoparticle Uptake into Mammalian Cells, Nano Lett.,
2006, 6(4), 662–668, DOI: 10.1021/nl052396o.
36 C. D. Walkey, J. B. Olsen, H. Guo, A. Emili and
W. C. W. Chan, Nanoparticle Size and Surface Chemistry
Determine Serum Protein Adsorption and Macrophage
Uptake, J. Am. Chem. Soc., 2012, 134, 2139–2147, DOI:
10.1021/ja2084338.
37 S. Tenzer, D. Docter, J. Kuharev, A. Musyanovych, V. Fetz,
R. Hecht, F. Schlenk, D. Fischer, K. Kiouptsi, C. Reinhardt,
K. Landfester, H. Schild, M. Maskos, S. K. Knauer and
R. H. Stauber, Rapid formation of plasma protein corona
critically affects nanoparticle pathophysiology, Nat.
Nanotechnol., 2013, 8, 772–781, DOI: 10.1038/nnano.2013.181.
38 J. Lovri´c, H. S. Bazzi, Y. Cuie, G. R. A. Fortin, F. M. Winnik
and D. Maysinger, Differences in subcellular distribution
and toxicity of green and red emitting CdTe quantum dots,
J. Mol. Med., 2005, 83, 377–385, DOI: 10.1007/s00109-004-
0629-x.
39 C. Aberg, J. A. Kim, A. Salvati and K. A. Dawson, Theoretical
framework for nanoparticle uptake and accumulation
kinetics in dividing cell populations, EPL, 2013, 101, 1–6,
DOI: 10.1209/0295-5075/101/38007.
40 J. A. Kim, C. Aberg, A. Salvati and K. A. Dawson, Role of cell
cycle on the cellular uptake and dilution of nanoparticles in
a cell population, Nat. Nanotechnol., 2012, 7, 62–68, DOI:
10.1038/nnano.2011.191.
41 Y. Liu, P. Wang, Y. Wang, Z. Zhu, F. Lao, X. Liu, W. Cong,
C. Chen, Y. Gao and Y. Liu, The Inuence on Cell Cycle
and Cell Division by Various Cadmium-Containing
Quantum Dots, Small, 2013, 9(14), 2440–2451, DOI:
10.1002/smll.201300861.
42 L. Chen, G. Qu, C. Zhang, S. Zhang, J. He, N. Sang and S. Liu,
Quantum dots (QDs) restrain human cervical carcinoma
HeLa cell proliferation through inhibition of the ROCK-c-
Myc signaling, Integr. Biol., 2013, 5(3), 590–596, DOI:
10.1039/c2ib20269g.
43 J. Wu, H. Li, Q. Chen, X. Lin, W. Liu and J.-M. Lin, Statistical
single-cell analysis of cell cycle-dependent quantum dot
cytotoxicity and cellular uptake using a microuidic
system, RSC Adv., 2014, 4, 24929–24934, DOI: 10.1039/
c4ra01665c.
44 T. dos Santos, J. Varela, I. Lynch, A. Salvati and K. A. Dawson,
Quantitative assessment of the comparative nanoparticle-
uptake efficiency of a range of cell lines, Small, 2011, 7(23),
3341–3349, DOI: 10.1002/smll.201101076.
45 C. Wilhelm, F. Gazeau, J. Roger, J. N. Pons and J.-C. Bacri,
Interaction of Anionic Superparamagnetic Nanoparticles
with Cells: Kinetic Analyses of Membrane Adsorption and
Subsequent Internalization, Langmuir, 2002, 18, 8148–8155,
DOI: 10.1021/la0257337.
46 V. Wilhelmi, U. Fischer, H. Weighardt, K. Schulze-Osthoff,
C. Nickel, B. Stahlmecke, T. A. J. Kuhlbusch,
A. M. Scherbart, C. Esser, R. P. F. Schins and C. Albrecht,
Zinc Oxide Nanoparticles Induce Necrosis and Apoptosis
in Macrophages in a p47phox- and Nrf2-Independent
Manner, PLoS One, 2013, 8(6), E65704, DOI: 10.1371/
journal.pone.0065704.
47 M. Liu, X. Gu, K. Zhang, Y. Ding, X. Wei, X. Zhang and
Y. Zhao, Gold nanoparticles trigger apoptosis and necrosis
in lung cancer cells with low intracellular glutathione,
J. Nanopart. Res., 2013, 15, 1745, DOI: 10.1007/s11051-013-
1745-8.
48 Y. Pan, A. Leifert, D. Ruau, S. Neuss, J. Bornemann,
G. Schmid, W. Brandau, U. Simon and W. Jahnen-Dechent,
Gold Nanoparticles of Diameter 1.4 nm Trigger Necrosis by
Oxidative Stress and Mitochondrial Damage, Small, 2009,
5(18), 2067–2076, DOI: 10.1002/smll.200900466.
49 R. Foldbjerg, P. Olesen, M. Hougaard, D. A. Dang,
H. J. Hoffmann and H. Autrup, PVP-coated silver
nanoparticles and silver ions induce reactive oxygen
species, apoptosis and necrosis in THP-1 monocytes,
Toxicol. Lett., 2009, 190, 156–162, DOI: 10.1016/
j.toxlet.2009.07.009.
50 H.-J. Yen, S.-H. Hsu and C.-L. Tsai, Cytotoxicity and
immunological response of gold and silver nanoparticles
of different sizes, Small, 2009, 5(13), 1553–1561, DOI:
10.1002/smll.200900126.
51 J. Choi, Q. Zhang, V. Reipa, N. S. Wang, M. E. Stratmeyer,
V. M. Hitchins and P. L. Goering, Comparison of cytotoxic
and inammatory responses of photoluminescent silicon
nanoparticles with silicon micron-sized particles in RAW
264.7 macrophages, J. Appl. Toxicol., 2009, 29, 52–60, DOI:
10.1016/j.toxlet.2008.10.012.
52 W.-K. Oh, S. Kim, M. Choi, C. Kim, Y. S. Jeong, B.-R. Cho,
J.-S. Hahn and J. Jang, Cellular uptake, cytotoxicity, and
innate immune response of silica-titania hollow
nanoparticles surface functionality, ACS Nano, 2010, 4(9),
5301, DOI: 10.1021/nn100561e.
53 C. Y. Tsai, S. L. Lu and C. W. Hu, et al., Size-dependent
attenuation of TLR9 signaling by gold nanoparticles in
macrophages, J. Immunol., 2012, 188, 68–76, DOI: 10.4049/
jimmunol.1100344.
54 A. Hoshino, S. Hanada, N. Manabe, T. Nakayama and
K. Yamamoto, Immune Response Induced by Fluorescent
Nanocrystal Quantum Dots In Vitro and In Vivo, IEEE
Transactions on NanoBioscience, 2009, 8(1), 51–57, DOI:
10.1109/TNB.2009.2016550.
42258 | RSC Adv., 2015, 5, 42250–42258 This journal is © The Royal Society of Chemistry 2015
RSC Advances Paper