2. Recent advance in nanotechnology has brought many
innovative approaches and solutions to biomedical research.
Gold nanoparticles (AuNPs) are among one of the most
extensively studied and broadly used nanomaterials for
biomedical applications.3−6
AuNPs exhibit exceptionally strong
light scattering properties at the surface plasmon wavelength
region.7,8
A AuNP scatters light 100s to 1000 times stronger
than a polymer bead at similar size. AuNPs are excellent optical
probes for light scattering-based bioimaging and biomolecular
detection.9,10
By combining the strong light scattering property
of AuNPs with a technique used routinely for nanoparticle size
analysis, dynamic light scattering (DLS), we developed a
nanoparticle-enabled dynamic light scattering assay (Nano-
DLSay) for chemical and biological target analyte detection and
analysis.11,12
NanoDLSay detects target analytes by monitoring
the average particle size increase of the AuNP probes upon
binding with the target analytes. The binding of target analytes
to the AuNP probes either causes individual particle size
increase or induces nanoparticle cluster formation. There is a
quantitative correlation between the average particle size of the
assay solution and the quantity of target analytes in sample
solutions. NanoDLSay has so far been applied for quantitative
detection and analysis of a wide range of chemical and
biological targets, including proteins, DNAs, viruses, carbohy-
drates, small chemicals, toxic metal ions, food and environ-
mental toxins.13−20
Citrate ligand-capped gold nanoparticle (ctAuNP), also
called gold colloid, is one of the best known gold nano-
particles.21,22
Citrate is negatively charged under neutral pH
conditions, therefore, ctAuNPs are negatively charged. Because
of the unique surface chemistry of ctAuNPs (the negative
charge and the hydrophobic Au atoms), proteins tend to adsorb
to ctAuNPs through a suite of noncovalent chemical
interactions including electrostatic interactions between pos-
itively charged amino acid residues and the citrate ligands; van
der Waals interactions between hydrophobic moieties of the
protein and gold metal core and strong Au−S, Au−N
bonding.23−25
The physical adsorption of antibodies to
ctAuNPs is commonly used to prepare gold nanoparticle
immunoprobes.26,27
Human blood contains thousands of proteins.28,29
When
ctAuNPs are mixed with human blood, studies have shown that
both abundant and low abundant blood proteins can adsorb to
the nanoparticles to form a “protein corona”.30−32
Because the
protein profile in the blood of cancer patients differs from
healthy donors, we hypothesize that the molecular composition
of the protein corona formed on the ctAuNP surface may differ
between cancer and noncancer human blood. While investigat-
ing the molecular differences in the protein corona formed on
ctAuNPs from prostate cancer and noncancer blood serum
samples using NanoDLSay, we discovered in this study that the
amount of human immunoglobulin G protein (IgG) in the
protein corona is increased in early stage prostate cancer. The
increased amount of IgG in the protein corona is believed to be
due to the coadsorption of tumor-specific antigens and
autoantibodies33−35
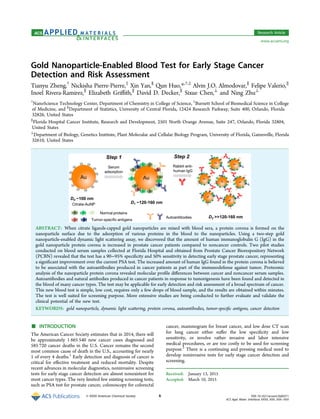
to the AuNPs. The complete procedure
of a two-step NanoDLSay used in the present study is
illustrated in Figure 1. In the first step of the assay, a small
amount of serum sample is directly mixed with a ctAuNP
solution. After certain incubation time (5−20 min), the average
particle size, D1, of the mixed solution is measured. Then in a
second step of the assay, a rabbit polyclonal antihuman IgG
antibody is added to the assay solution to probe the relative
amount of human IgG present in the protein corona. When
human IgG antibody is present in the protein corona, the
binding of rabbit antihuman IgG causes nanoparticle cluster
formation due to human IgG and antihuman IgG binding. The
nanoparticle cluster formation is detected by measuring the
average particle size of the assay solution again (D2) using DLS
following a 5−20 min of incubation time. The more human
IgG present in the protein corona, the larger the average
particle size increase. The ratio of the average particle size
measured in the second step of the assay (D2) versus the first
step of the assay (D1) is calculated and expressed as the test
score to assess the relative quantity of human IgG present in
the nanoparticle protein corona.
This test is very easy to perform. Two pilot studies we report
here revealed that the new test can discriminate prostate cancer
patients from noncancer patients with a 90−95% specificity and
50% sensitivity, a significant improvement over the current PSA
test for prostate cancer screening. Because the test detects
Figure 1. Illustration of a two-step NanoDLSay to analyze the relative amount of human IgG adsorbed to citrate-capped AuNPs for early stage
prostate cancer detection. In the first step of the assay, 2 μL of serum is mixed with 40 μL of AuNP solution. Normal blood proteins and tumor-
specific antigens from the serum compete to adsorb to the citrate-AuNPs to form a “protein corona”. The presence of tumor-specific antigens in the
blood serum of cancer patients can cause adsorption of tumor-specific autoantibodies (IgG proteins) to the nanoparticle protein corona. In the
second step of the assay, a rabbit antihuman IgG is added to the solution to analyze the relative quantity of human IgG in the adsorbed protein
corona. The binding of antihuman IgG with IgG present in the protein corona will lead to nanoparticle cluster formation. The average particle size of
the assay solution followed the first step and second step of the assay is measured using dynamic light scattering. The test score is expressed as the
ratio of the average particle size of the assay solution obtained from the second (D2) versus the first step of the assay (D1), D2/D1. Higher ratio
corresponds to more IgG present in the protein corona.
ACS Applied Materials & Interfaces Research Article
DOI: 10.1021/acsami.5b00371
ACS Appl. Mater. Interfaces XXXX, XXX, XXX−XXX
B
3. increased immune activities in cancer patients and tumor-
specific autoantibodies have been found and detected in a
broad spectrum of cancer types,33
it is possible that this new
test may be able to detect other types of cancer as well. More
extensive clinical studies are being conducted to further
evaluate and validate the potential of this new test as a
universal screening test for early stage cancer detection and
cancer risk assessment.
■ RESULTS AND DISCUSSION
Light Scattering Intensity Study of Gold Nano-
particles Mixed with Blood Sera. DLS measures the average
particle size of a particle solution by monitoring the scattering
light intensity fluctuation coming from all particles in the
sample solution.36
The exceptional light scattering property of
AuNP probes is crucial to ensure the successful application of
NanoDLSay for biological sample analysis. Biological fluids,
such as blood sera contain a large amount of colloidal particles
including biomacromolecules (large proteins and polymers),
macromolecular complexes, exosomes and vesicles (cell
components and fragments), of which the sizes fall in the
range between tens and hundreds of nanometers. These
biological particles also scatter light intensely. Approximately 40
years ago, Cohen et al. proposed a similar assay concept using
polystyrene beads as the light scattering probe and DLS to
detect the target analyte binding-induced polystyrene bead
cluster formation.37−39
However, this assay was not pursued
actively following its initial publication, presumably because of
less-than-expected performance. The light scattering intensity
of a polystyrene bead is not significantly stronger than typical
biological particles. As a result, the light scattering from the
sample matrix contributes significantly to the particle size
measurement. For the nanoparticle probe-enabled dynamic
light scattering assay to work, the light scattering intensity of
the nanoparticle probe must exceed largely the light scattering
from the sample matrix, so that the measured average particle
size of the assay solution only reflects the particle size change of
the nanoparticle probes caused by target analyte binding, but
not by the background scattering from the sample matrix.
To experimentally demonstrate the critical importance of a
strong light scattering nanoparticle probe in the assay, we
examined the light scattering intensity of pure AuNP solution
and the effect of the human blood serum on the light scattering
of the mixed AuNP-serum assay solution. The light scattering
intensity of AuNPs increases with nanoparticle size.7,8
ctAuNP
with two sizes were examined here: 40 nm (AuNP40nm) and
100 nm (AuNP100nm). To prepare the AuNP-serum mixture
solution, 2 μL serum was mixed with 40 μL of AuNP solution.
This is the serum-AuNP ratio used in the following clinical
study. Figure 2 is the intensity-averaged size distribution curves
of the two AuNP solutions and their mixtures with a blood
serum sample. The two distribution curves of AuNP-serum
mixture solutions are representative of multiple serum samples.
Before and after the addition of the serum solution, the particle
size distribution curves remain relatively monodispersed. The
average particle size of AuNP40nm-serum and AuNP100nm-
serum increased by about 26 and 20 nm, respectively,
compared to the pure AuNP solutions.
Table 1 is a summary of the scattering light intensity study of
the four solutions. It first needs to be explicitly pointed out here
that the DLS measurements of AuNP40nm and AuNP100nm
were conducted using two different incident laser power
adjusted by attenuation. The incident laser power used for
AuNP100nm study is approximately 3% of the laser power used
for AuNP40nm study. The reason to use less laser power for
AuNP100nm study is to avoid potential damage to the detector
because of excessive number of photons reaching the detector.
The manufacturer recommends to control the photon count
rate to be around or less than 1000 kcps (kilo counts per
second).40
Under a 3% laser power, the photon count rate from
AuNP100nm solution is at the similar level as AuNP40nm,
∼1000−1200 kcps. In other words, the AuNP100nm solution
scatters light approximately 30 times stronger than the
AuNP40nm solution. To evaluate the contribution of light
scattering from serum to the nanoparticle assay, 2 μL serum
was added to 40 μL pure water. Under the 100% and 3% laser
power, the photon count rate of this serum control solution is
509 and 29 kcps, respectively. The light scattering intensity
from the serum is approximately 49% of the light scattering
intensity from AuNP40nm, but only 2% of the light scattering
intensity of AuNP100nm. These numbers demonstrate clearly
that the AuNP40nm is not suitable for the proposed serum
assay, because the background light scattering from the serum
will contribute significantly to the average particle size of the
assay solution. Indeed, a significant light scattering intensity
increase of ∼300 kcps was observed from AuNP40nm solution
when serum was added. In contrast, the light scattering
intensity from the serum is at the noise level of the
AuNP100nm solution. The mixed AuNP100nm-serum solution
exhibits almost the same light scattering intensity as the pure
Figure 2. Intensity-averaged size distribution curves of AuNP40nm,
AuNP40nm mixed with serum, AuNP100nm, and AuNP100nm mixed
with serum. To prepare the mixture of AuNP and serum, 2 μL of
serum was added to 40 μL of AuNP solution.
Table 1. Light Scattering Intensity Study of AuNP40nm,
AuNP100nm, Serum, and Mixture of Serum with
AuNP40nm and AuNP100nm
laser power scattering light intensity (kcps) ± standard deviation
AuNP40nm serum
serum/
AuNP40nm ×
100%
AuNP40nm
+ serum
attenuation
11
1038 ± 21 509 ± 137 49 1311 ± 24
AuNP100nm serum
serum/
AuNP100nm ×
100%
AuNP100nm
+ serum
attenuation
8a
1252 ± 30 29 ± 5 2 1239 ± 23
a
Attenuation 8 decreases the incident laser power to 3% of the laser
power at attenuation 11.
ACS Applied Materials & Interfaces Research Article
DOI: 10.1021/acsami.5b00371
ACS Appl. Mater. Interfaces XXXX, XXX, XXX−XXX
C
4. AuNP100nm solution (1252 versus 1239 kcps). The
contribution from the serum particles to particle size
measurement of the assay solution can be neglected. Particle
size change detected from the AuNP100nm-serum assay
solution should arise solely from the AuNP probes. Although
only one serum sample is presented here, we have frequently
conducted the same analysis on randomly selected serum
samples (∼10% of the serum sample populations), and the
measured light scattering intensity from the serum samples has
never exceeded 5% of the light scattering from the
AuNP100nm solution. By using AuNP100nm in the serum
assay, the background light scattering interference from the
serum matrix can be successfully avoided.
AuNP-Serum Adsorption Assay and Adsorbed Human
IgG Analysis. Using AuNP100nm as the probe and following a
two-step assay format as illustrated in Figure 1, we conducted
two pilot studies on prostate cancer and cancer-free human
blood serum samples collected at Florida Hospital and obtained
from Prostate Cancer Biorespository Network (PCBN). PCBN
is a biorepository network that collects, archives and provides
human tissue specimens and samples related to prostate cancer
through collaboration between the Johns Hopkins University
(JHU), the New York University (NYU) School of Medicine,
Memorial Sloan Kettering Cancer Center (MSKCC), the
University of Washington (UW), and the Department of
Defense. The PCBN study was conducted as a blind study, with
the patients’ clinical information (cancer status and stage)
revealed to the researcher after the tests were completed and
results were submitted to the network for record keeping.
Clinical information on the samples including cancer stage
distribution data is summarized in Table 2. More than 80% of
cancer cases in both studies are early stage cancer (stage T2a
and below). In the first step of the assay, 2 μL serum was mixed
with 40 μL AuNP100nm; and in the second step of the assay, a
rabbit antihuman IgG antibody solution was added to the
AuNP-serum solution to analyze the relative quantity of human
IgG adsorbed to the AuNPs. The ratio of the average particle
size of the assay solution measured at the second step versus
the first step of the assay was expressed as the test score. The
detailed procedure of the assay can be found in the
corresponding figure captions. The Florida Hospital samples
include 32 cancer patients (cancer group) and 23 BPH (benign
prostate hyperplasia) patients (BPH group). BPH is a
noncancerous prostate condition. The PCBN samples include
20 cancer patients and 19 noncancer controls.
There are several slight differences in the protocols used for
Florida Hospital study versus PCBN study. The differences
between the two sets of protocols are as follows: (1) The
incubation time is 6 min for the first step of the assay and 9 min
for the second step assay for Florida Hospital study, and the
incubation time is 20 min for each step in the PCBN study. (2)
The antihuman IgG antibody used in the second step of the
assay is ab2410 for Florida Hospital study and ab6715 for
PCBN study. All other conditions are the same for both studies.
Both ab2410 and ab6715 are rabbit polyclonal antihuman IgG,
but ab6715 has a broader binding activity with human IgG than
ab2410. As a result of these differences in the assay protocol,
the nanoparticle test score expressed as the two-step average
particle size ratio D2/D1 is larger for the PCBN study compared
to the Florida Hospital study. The assay data of these two sets
of studies cannot be compared directly with each other. Assay
results are presented in Figure 3A (Florida Hospital study) and
Figure 3B (PCBN study), respectively. The pairwise p value
between sample groups was calculated using ANOVA model
and indicated in the graph.
Assay data reveals that a significant number of samples in the
cancer groups in both Florida Hospital and PCBN sample set
show higher test scores (larger particle size ratio) compared to
noncancer groups. From Florida Hospital study, statistical
analysis reveals the following: (1) There is a statistically
significant test score difference between the cancer group and
benign condition BPH group. The p value is 0.001. (2) At a
cutoff value of 1.35 (determined by median score of BPH group
plus one standard deviation), the test has a 91% specificity and
50% sensitivity in distinguishing benign prostate conditions
from cancer. The PCBN study revealed very similar findings as
Florida Hospital study: (1) The score difference between
cancer and healthy control group is statistically significant (p-
value 0.004); (2) At a cutoff value of 2.48 (determined by
median score of noncancer group plus two standard
deviations), the test has a 95% specificity and 50% sensitivity
in distinguishing healthy control from cancer case.
Overall, the test represents a significant improvement over
the current PSA test. According to a recent comprehensive
review published by the American Cancer Society based on
nine major clinical studies conducted around the world, at a
cutoff value of 4.0 ng/mL (the most widely adopted clinical
cutoff value for PSA test), the PSA test has a 91% specificity
and 21% sensitivity.41
If the PSA cutoff value is decreased to 3.0
ng/mL, the sensitivity of the PSA test is improved to 32%,
however, the specificity of the test is decreased to 85%.41
For
the new nanoparticle test, while maintaining a high specificity of
90−95%, the sensitivity of the new test is 50%, more than 2-
fold of the PSA test. Another major limiting factor of the
current PSA test is its poor specificity in distinguishing early
stage prostate cancer from noncancerous benign prostate
cancer conditions such as BPH.42
PSA value in the range of 4−
10 ng/mL represents a diagnostic gray zone. In this range,
prostate cancer is present in only 25% of the patients.43
This
low specificity (high false positive rate) of PSA test in the
diagnostic gray zone is the major cause of overdiagnosis. A
study by Stamey et al. showed that most PSA increase up to 9
ng/mL could be attributed to BPH.44
The fact that the new
nanoparticle test can discriminate BPH patients from prostate
cancer patients with ∼90% specificity is particularly encourag-
ing. The nanoparticle test could potentially be used in
combination with the PSA test to significantly improve the
specificity of early stage prostate cancer screening and
detection, especially in the diagnostic gray zone of PSA value
between 4 and 10 ng/mL, reducing the unnecessary over-
diagnosis and biopsy procedures performed on men.
Table 2. Sample Size and Cancer Stage Distribution of
Human Serum Samples Used in the Study
sample information cancer stage distribution
clinical
source
sample
group
sample
size
HPINa
,
T1a, T1c T2a
T2b,
T2c T3a T4
Florida
Hospital
cancer 32 22 5 2 3 0
Florida
Hospital
BPH 23 N/A
PCBN cancer 20 14 2 1 3 0
PCBN noncancer 19 N/A
a
HPIN: High-grade prostatic intraepithelial neoplasia.
ACS Applied Materials & Interfaces Research Article
DOI: 10.1021/acsami.5b00371
ACS Appl. Mater. Interfaces XXXX, XXX, XXX−XXX
D
5. Mechanistic Study of Increased Human IgG in the
Nanoparticle Protein Corona Formed in Cancer Pa-
tients’ Sera. From the first step of the nanoparticle assay, that
is, the adsorption of serum proteins to ctAuNPs, the average
particle size of the assay solution increased by about 20−60 nm
for most serum samples. This indicates no substantial
nanoparticle clusters/aggregates were formed from the serum
adsorption step. This was expected, because most circulating
IgGs are immune-inactive. The AuNP concentration used in
the assay is very low, only 10 pM. The small amount of tumor-
elicited autoantibodies in the serum is not enough to cause
substantial cross-linking of the AuNPs. In the second step of
the assay, a rabbit polyclonal anti-IgG was added intentionally
in high concentration (2 mg/mL) to the assay solution. This
high concentration of anti-IgG drives the cross-linking of
AuNPs into aggregates by binding with the small amount of
IgG autoantibodies adsorbed to the AuNP surface. We also
found the test results expressed as the average nanoparticle size
ratio instead of net average nanoparticle increase in the two-
step assay can better correlate to cancer status. Therefore, we
adopted the average nanoparticle size ratio between the first
and the second step of the assay as the test score. Higher test
score is interpreted as more human IgGs present on the gold
nanoparticle surface. To confirm that the particle size increase
observed in the second step of the assay following the addition
of rabbit antihuman IgG in the assay solution is indeed caused
by specific binding of antihuman IgG with human IgG on the
nanoparticle surface, we conducted the same assay using a
nonspecific rabbit antibody isotype control. The isotype control
caused almost no particle size increase following its addition to
the assay solution (Figure 4A).
It needs to be emphasized that this nanoparticle test detects
only the relative quantity of protein analytes, such as human
IgG adsorbed to the AuNPs, not the absolute quantity of
human IgG in the blood serum. According to the principal of
the assay as discussed earlier, the assay detects only antibody−
antigen binding that takes place around the AuNPs, more
specifically, around the protein corona formed on the
nanoparticle surface. To evaluate if there is a correlation
Figure 3. Nanoparticle test results of Florida Hospital (A) and PCBN
(B) study. Assay procedure for Florida Hospital study: 2 μL of serum
was added to 40 μL of AuNP100nm solution. Following a 6 min of
incubation at room temperature, the average particle size (D1) of the
assay solution was measured. Then 2 μL of rabbit antihuman IgG
antibody (ab2410) at 2.0 mg/mL was added to the assay solution.
Following a 9 min of incubation, the average particle size of the assay
solution was measured again (D2). Assay procedure for PCBN study: 2
μL of serum was added to 40 μL of AuNP100nm solution. Following a
20 min of incubation at room temperature, the average particle size
(D1) of the assay solution was measured. Then 2 μL of rabbit
antihuman IgG antibody (ab6715) at 2.4 mg/mL was added to the
assay solution. Following a 20 min of incubation, the average particle
size of the assay solution was measured again (D2). For both assays,
the test score is expressed as the nanoparticle size ratio of second
versus first step assay (D2/D1). ANOVA model was used to analyze
the statistical difference of group pairs. Pairwise p-values are indicated
in the graph. The difference between the group-pairs is considered
statistically significant is the p value is of or less than 0.05, and vice
versa.
Figure 4. (A) Control study using rabbit IgG isotype control antibody
in the two-step nanoparticle test. The first step of the assay is the same
as the nanoparticle test as used for PCBN study. In the second step of
the assay, a nonspecific rabbit IgG isotype control (ab37415) instead
of specific rabbit antihuman IgG was added to the assay solution at the
same concentration (2 mg/mL) and same volume (2 μL). (B) ELISA
analysis of total quantity of human IgG in PCBN serum sample sets
(cancer and noncancer group) using an ELISA kit (ab100547) from
Abcam. ANOVA model was used to analyze the p value of cancer and
noncancer group pair.
ACS Applied Materials & Interfaces Research Article
DOI: 10.1021/acsami.5b00371
ACS Appl. Mater. Interfaces XXXX, XXX, XXX−XXX
E
6. between the relative quantity of human IgG present in the
AuNP protein corona and the total IgG in the blood serum, we
determined the absolute quantity of human IgG antibody in the
PCBN sample set using an ELISA kit (ab100547) from Abcam.
This assay revealed no significant difference (p-value 0.82) in
the total quantity of human IgG between cancer and noncancer
group (Figure 4B). There is no correlation between the amount
of human IgG in the serum as determined by ELISA and the
relative quantity of human IgG in the gold nanoparticle protein
corona.
These observations led to an interesting question: why an
increased amount of human IgG is present in the nanoparticle
protein corona formed in cancer patients’ sera while the total
quantity of human IgG in the blood sera is about the same for
cancer and noncancer group? We hypothesize that the
increased amount of human IgG detected in the nanoparticle
protein corona of cancer patients’ sera is associated with the
presence and coadsorption of tumor-specific antigens and
autoantibodies (mainly IgG proteins)33−35
to the AuNPs.
According to cancer immunoediting theory,45,46
the host
immune system can recognize transformed tumor cells as
nonself, and will trigger certain immune defensive responses to
prevent primary tumor growth. Autoantibodies or natural
antibodies against tumor-specific antigens have been detected
widely in many cancer types and are being actively pursued as
potential biomarkers for early stage cancer detection.33−35,47−54
Using a phage display and protein microarray technique, Wang
et al. identified a 22 phage-displayed peptide panel that detects
autoantibody signatures in the blood of prostate cancer
patients.34
Xie et al. developed a multiplex assay combining
the detection of six autoantibodies associated with prostate
tumor and PSA, and the assay provides both enhanced
sensitivity and specificity for prostate cancer detection
compared to PSA test alone.35
In the nanoparticle test,
tumor-released antigens compete with other serum proteins
to adsorb to the citrate-AuNPs. The AuNP functions as a
“mini-concentrator” to attract both normal blood proteins and
tumor-specific antigens to the nanoparticle surface. Subse-
quently, autoantibodies that are specific to these tumor-
associated antigens are coadsorbed to the AuNPs by binding
with the adsorbed tumor antigens, as illustrated in Figure 1. As
a result, an increased amount of IgG proteins was detected in
the nanoparticle protein corona formed from cancer patients’
sera. This phenomenon was previously observed from a limited
study we conducted on mouse models carrying prostate
tumor.55
To support our hypothesis, we conducted proteomic analysis
on the proteins adsorbed to the AuNPs from several cancer and
noncancer serum samples. After the serum sample was mixed
with AuNP solution for 2 h at rt, the serum-adsorbed AuNP
product was isolated and purified by centrifuge followed by
washing with phosphate buffer solution twice. The adsorbed
proteins were released from the AuNPs by trypsin digestion
and then analyzed using a LTQ-Orbitrap mass spectrometer
and method as previously described,56
except the database used
for protein searching was the human protein database. Table 3
listed two groups of proteins that are either absent in the cancer
sera but present in the normal sera; or are present in the cancer
sera but absent in the normal serum. This short list illustrates
that the molecular profile of the protein corona adsorbed to the
AuNPs indeed differs between cancer and noncancer sera.
Some of the proteins that were found in cancer sera but not in
normal control sera are potentially tumor-associated antigens
and these antigens attracted their autoantibodies to the
nanoparticle surface, leading to an increased amount of IgG
protein in the protein corona. More extensive studies need to
be conducted to elucidate the identities of the tumor antigens
adsorbed to the ctAuNPs and such antigens may serve as
biomarkers for specific cancer detection.
■ CONCLUSION
Tumor antigen-specific autoantibodies are known to appear
months even years before clinical diagnosis of cancer, and
autoantibodies have been found in many types of cancer.43−50
Autoantibodies are excellent biomarkers for early stage cancer
detection and screening. According to cancer immunoediting
theory,45,46
the host immunodefense activity against tumor
occurs at early stage of tumor development. At later stages,
tumor may develop the capability to “escape” the immuno-
surveillance.45,46
This hints that there is an optimum time
window to detect the increased immune activity in cancer
patients. If the new nanoparticle test is applied as an annual
screening test, the sensitivity of the test could potentially
increase from the current 50% to a much higher level. Most
studies are attempting to identify tumor-specific antigens, and
detect antibodies that are specific to individual tumor-
Table 3. List of Selected Proteins and Peptides That Differ in
the Gold Nanoparticle Protein Coronas Formed in Prostate
Cancer and Non-cancer Blood Seraa
normalized total spectrum count
protein identity
cfu5
(T3a
cancer)
cfu40
(T3a
cancer)
cfu17
(noncancer)
proteins that are absent in cancer serum but present in normal serum
cluster of 13 kDa protein 0 0 6
13 kDa protein 0 0 5
13 kDa protein 0 0 6
cluster of antistreptococcal/antimyosin
immunoglobulin lambda light chain
variable region
0 0 53
putative uncharacterized protein
cluster of cold agglutinin FS-1 L-chain
13 kDa protein 0 0 5
cluster of Ig kappa chain V−III region
HRV Fab N27-VL 0 0 10
cluster of uncharacterized protein
HRV Fab 025-VL 0 0 7
cluster of VH6DJ protein
VH6DJ protein 0 0 6
hemoglobin subunit alpha 0 0 5
proteins that are present in cancer serum but absent in normal serum
cluster of antistreptococcal/antimyosin
immunoglobulin lambda light chain
variable region
Ig lambda chain V−I region VOR 6 3 0
cluster of cold agglutinin FS-1 L-chain
cold agglutinin FS-1 L-chain 5 4 0
Ig kappa chain V−I region CAR 11 7 0
isoform 3 of keratin, type I cytoskeletal
13
25 26 0
cluster of hypothetical protein
LOC100291917
18 9 0
Ig heavy chain V−II region SESS 5 3 0
hypothetical protein LOC100291917 17 8 0
a
Selection criteria: the normalized total spectrum count of the
protein/peptide is at least 5 or above.
ACS Applied Materials & Interfaces Research Article
DOI: 10.1021/acsami.5b00371
ACS Appl. Mater. Interfaces XXXX, XXX, XXX−XXX
F
7. associated antigens. Different from these approaches, the
nanoparticle test we report here detects an overall increase of
human IgG (including the tumor-specific autoantibodies)
adsorbed to a AuNP surface. On one hand, this test may not
be able to identify the specific type of cancer; on the other
hand, this test may potentially be able to detect early stage
tumor-induced immune responses associated with a broad
spectrum of cancer types, making this test potentially a
universal screening test for cancer risk assessment. The new test
may be combined with other cancer type-specific test such as
PSA test for prostate cancer to improve the early detection and
diagnosis of specific cancer types. More extensive clinical
studies are being pursued to further validate the clinical
applications of the new nanoparticle test, and to evaluate
comprehensively the potential interference of other medical
conditions and clinical factors that may affect the specificity and
sensitivity of the test.
In summary, we reported here a unique nanoparticle-enabled
blood test with clinical potential for early stage cancer screening
and detection. The test successfully utilizes the exceptional light
scattering property of gold nanoparticles for target protein
detection. The test is extremely simple, of low cost, requires a
few drops of blood samples that can be collected from a finger
prick instead of a blood draw, and may be conducted in a point-
of-care facility such as a doctor’s office. The test is well suited
for screening purpose.
■ EXPERIMENTAL PROCEDURES
Chemical and Biochemical Reagents. Citrate-protected gold
nanoparticles, AuNP40nm (15707−1, conc. 9.0 × 10¹⁰
particles/mL)
and AuNP100nm (15708−9, conc. 5.6 × 10⁹
particles/mL), were
purchased from Ted Pella, Inc. (Redding, CA). Rabbit polyclonal
antihuman IgG (ab2410 and ab6715), rabbit IgG isotype control
(ab37415), and ELISA kit (ab100547) for human IgG analysis of
blood serum samples were purchased from Abcam (Cambridge, MA).
Dynamic Light Scattering (DLS) Analysis. The scattering light
intensity study of AuNPs and AuNP-serum mixture solutions was
conducted using a Zetasizer Nano ZS90 DLS system equipped with a
green (532 nm, 4 mW) laser and an Avalanche photodiode detector
(APD) (quantum efficiency >50% at 532 nm) (Malvern Instruments
Ltd., England). The incident laser power can be adjusted by using
different attenuations. All AuNP-serum assays were conducted using
an automatic NDS1200 DLS instrument from Nano Discovery Inc.
(Orlando, FL). This system is equipped with a 633 nm He−Ne laser
(0.5 mW) and a 12-sample holder, which allow measurement of 12
samples within 6 min. All size measurements were conducted at an
ambient temperature of 25 °C.
Serum-AuNP Adsorption Assay and the Adsorbed Human
IgG Analysis. To perform the serum-AuNP adsorption assay and the
human IgG analysis, 2 μL of serum was mixed with 40 μL of
AuNP100nm. After incubating for 5−20 min, the average particle size
of the assay solution (D1) was measured using NDS1200. Then 2 μL
of rabbit antihuman IgG (2 mg/mL) was added to the assay solution.
After it was incubated for another 5−20 min, the average particle size
of the assay solution (D2) was measured again. The ratio of D2/D1 was
calculated as the test score. Specific assay incubation time can be found
in the corresponding figure captions. Statistical analysis of the assay
data was conducted to calculate the group pair p-value using ANOVA
(Analysis of Variance) model.
Human Subject Research and Protection. The Florida Hospital
study was reviewed and approved by both Institutional Review Board
committees at University of Central Florida and Florida Hospital (IRB
approval number: 288679-4). The study using PCBN samples was
reviewed and approved by University of Central Florida. For Florida
Hospital study, informed consent was obtained from all participants
and study protocol was strictly followed during the study. No
problems or harm to the participants were encountered or noticed
during the study.
Blood samples were collected using Serum Separator Tube (SST).
Immediately after obtaining the blood sample, the tube was inverted 5
to 6 times. The tube was placed in an upright position for 30 min to
allow complete blood clotting. Tubes were not refrigerated or opened
during this process. The SST contains a special gel at the bottom of
the tube that migrate during centrifugation and separate cells and
serum at the end of the centrifugation process. The tube was
centrifuged within the next 30 min (within 1 h from collection) for 10
min at 1500g.
The study using archived, deidentified blood serum samples from
PCBN was determined as “Not Human Subject Research” as defined
by DHHS regulations at 45 CFR 46 or FDA regulations at 21 CFR
50/56. Total 20 prostate cancer samples and 20 normal control
samples were received from PCBN. One normal sample was rejected
as an extreme outlier in the statistics analysis: the test score of this
sample was 6.43, largely exceeding the upper outer fence value of 3.4
of the normal control group.
Proteomic Analysis of Gold Nanoparticle Protein Corona. To
prepare the sample for proteomic analysis, AuNP100nm was first
concentrated 10 times from 1 mL to 100 μL by centrifuge. Then to
400 μL of 10× concentrated AuNP100nm, 2 μL of serum was added.
After incubating at r.t. for 2 h, the solution was centrifuged at 5 kilo
rmp using an Eppendorf minispin centrifuge for 3 min. After removing
the suspension, the nanoparticle residues were washed twice with 10
mM phosphate buffer solution. After decanting the second phosphate
buffer washing solution, the samples were ready for trypsin digestion.
Three serum samples were prepared for proteomic analysis: two
cancer serum samples (cfu5 and cfu40, both from T3a prostate cancer
patients), and one noncancer healthy control (cfu17). The trypsin
digest was loaded onto a nanoflow HPLC-LTQ Orbitrap mass
spectrometer system (Thermo Scientific Inc., Bremen, Germany) and
the data were analyzed as described previously described.56
The
database used was IPI human with 91 464 entries.
■ AUTHOR INFORMATION
Corresponding Author
*E-mail: Qun.Huo@ucf.edu. Tel: 407-882-2845.
Notes
The authors declare the following competing financial
interest(s): Q. Huo is an owner and officer of Nano Discovery
Inc. This company may be interested in commercializing the
new blood test for cancer detection.
■ ACKNOWLEDGMENTS
This work is supported by the Department of Defense Prostate
Cancer Research Program, DOD Award No W81XWH-10-2-
0056 and W81XWH-10-2-0046 PCRP Prostate Cancer
Biorepository Network (PCBN). We also thank Prof. Bruce
Trock from Johns Hopkins University for his collaboration and
suggestions in the study of PCBN specimens.
■ REFERENCES
(1) Statistics from the American Cancer Society. www.cancer.org.
(2) Smith, R. A.; Manassaram-Baptiste, D.; Brooks, D.; Cokkinides,
V.; Doroshenk, M.; Saslow, D.; Wender, R. C.; Brawley, O. W. Cancer
Screening in the United States, 2014: A Review of Current American
Cancer Society Guidelines and Issues in Cancer Screening. Ca
Cancer J. Clin. 2014, 64, 30−51.
(3) Jans, H.; Huo, Q. Gold Nanoparticle-Enabled Biological and
Chemical Detection and Analysis. Chem. Soc. Rev. 2012, 41, 2849−
2866.
(4) Dykman, L.; Khlebtsov, N. Gold Nanoparticles in Biomedical
Applications: Recent Advances and Perspectives. Chem. Soc. Rev. 2012,
41, 2256−2282.
ACS Applied Materials & Interfaces Research Article
DOI: 10.1021/acsami.5b00371
ACS Appl. Mater. Interfaces XXXX, XXX, XXX−XXX
G
8. (5) Dreaden, E. C.; Alkilany, A. K.; Huang, X.; Murphy, C. J.; El-
Sayed, M. A. The Golden Age: Gold Nanoparticles for Biomedicine.
Chem. Soc. Rev. 2012, 41, 2740−2779.
(6) Saha, K.; Agasti, S. S.; Kim, C.; Li; Rotello, V. M. Gold
Nanoparticles in Chemical and Biological Sensing. Chem. Rev. 2012,
112, 2739−2779.
(7) Yguerabide, J.; Yguerabide, E. E. Light-Scattering Submicroscopic
Particles as Highly Fluorescent Analogs and Their Use as Tracer
Labels in Clinical and Biological Applications. Anal. Biochem. 1998,
262, 137−156.
(8) Jain, P. K.; Lee, K. S.; El-Sayed, I. H.; El-Sayed, M. A. Calculated
Absorption and Scattering Properties of Gold Nanoparticles of
Different Size, Shape, and Composition: Applications in Biological
Imaging and Biomedicine. J. Phys. Chem. B 2006, 110, 7238−7248.
(9) El-Sayed, I. H.; Huang, X.; El-Sayed, M. A. Surface Plasmon
Resonance Scattering and Absorption of Anti-EGFR Antibody
Conjugated Gold Nanoparticles in Cancer Diagnostics: Applications
in Oral Cancer. Nano Lett. 2005, 5, 829−834.
(10) Kang, B.; Austin, L. A.; El-Sayed, M. A. Observing Real-Time
Molecular Event Dynamics of Apoptosis in Living Cancer Cells Using
Nuclear-Targeted Plasmonically Enhanced Raman Nanoprobes. ACS
Nano 2014, 8, 4883−3892.
(11) Liu, X.; Dai, Q.; Austin, L.; Coutts, J.; Knowles, G.; Zou, J.;
Chen, H.; Huo, Q. A One-Step Homogeneous Immunoassay for
Cancer Biomarker Detection Using Gold Nanoparticle Probes
Coupled with Dynamic Light Scattering. J. Am. Chem. Soc. 2008,
130, 2780−2782.
(12) Dai, Q.; Liu, X.; Coutts, J.; Austin, L.; Huo, Q. A One-Step
Highly Sensitive Method for DNA Detection Using Dynamic Light
Scattering. J. Am. Chem. Soc. 2008, 130, 8138−8139.
(13) Kalluri, J. R.; Arbneshi, T.; Afrin Khan, S.; Nelly, A.; Candice, P.;
Varisli, B.; Washington, M.; McAfee, S.; Robinson, B.; Banerjee, S.;
Singh, A. K.; Senapati, D.; Ray, P. C. Use of Gold Nanoparticles in a
Simple Colorimetric and Ultrasensitive Dynamic Light Scattering
Assay: Selective Detection of Arsenic in Groundwater. Angew. Chem.,
Int. Ed. 2009, 48, 9668−9671.
(14) Driskell, J. D.; Jones, C. A.; Tompkins, S. M.; Tripp, R. A. One-
Step Assay for Detecting Influenza Virus Using Dynamic Light
Scattering and Gold Nanoparticles. Analyst 2011, 136, 3083−3090.
(15) Jans, H.; Liu, X.; Austin, L.; Maes, G.; Huo, Q. Dynamic Light
Scattering as a Powerful Tool for Gold Nanoparticle Bioconjugation
and Biomolecular Binding Study. Anal. Chem. 2009, 81, 9425−9432.
(16) Wang, X.; Ramström, O.; Yan, M. Dynamic Light Scattering as
an Efficient Tool to Study Glyconanoparticle-Lectin Interactions.
Analyst 2011, 136, 4174−4178.
(17) Wang, L.; Zhu, Y.; Xu, L.; Chen, W.; Kuang, H.; Liu, L.;
Agarwal, A.; Xu, C.; Kotov, N. A. Side-by-Side and End-to-End Gold
Nanorod Assemblies for Environmental Toxin Sensing. Angew. Chem.,
Int. Ed. 2010, 49, 5472−5475.
(18) Wang, X.; Li, Y.; Quan, D.; Wang, J.; Zhang, Y.; Du, J.; Peng, J.;
Fu, Q.; Zhou, Y.; Jia, S.; Wang, Y.; Zhan, L. Detection of Hepatitis B
Surface Antigen by Target-Induced Aggregation Monitored by
Dynamic Light Scattering. Anal. Biochem. 2012, 428, 119−125.
(19) Yin, H.; Huang, X.; Ma, W.; Xu, L.; Zhu, S.; Kuang, H.; Xu, C.
Ligation Chain Reaction Based Gold Nanoparticle Assembly for
Ultrasensitive DNA Detection. Biosens. Bioelectron. 2014, 52, 8−12.
(20) Zhang, Z.; Lin, M.; Zhang, S.; Vardhanabhuti, B. Detection of
Aflatoxin M1 in Milk by Dynamic Light Scattering Coupled with
Superparamagnetic Beads and Gold Nanoprobes. J. Agric. Food Chem.
2013, 61, 4520−4525.
(21) Turkevich, J.; Stevenson, P. C.; Hillier, J. A Study of the
Nucleation and Growth Processes in the Synthesis of Colloidal Gold.
Discuss. Faraday Soc. 1951, 11, 55−75.
(22) Kimling, J.; Maier, M.; Okenve, B.; Kotaidis, V.; Ballot, H.;
Plech, A. Turkevich Method for Gold Nanoparticle Synthesis
Revisited. J. Phys. Chem. B 2006, 110, 15700−15707.
(23) Calzolai, L.; Franchini, F.; Gilliland, D.; Rossi, F. Protein−
Nanoparticle Interaction: Identification of the Ubiquitin−Gold
Nanoparticle Interaction Site. Nano Lett. 2010, 10, 3101−3105.
(24) Brewer, S. H.; Glomm, W. R.; Johnson, M. C.; Knag, M. K.;
Franzen, S. Probing BSA Binding to Citrate-Coated Gold Nano-
particles and Surfaces. Langmuir 2005, 21, 9303−9307.
(25) Glomm, W. R.; Halskau, Ø.; Hanneseth, A.-M. D.; Volden, S.
Adsorption Behavior of Acidic and Basic Proteins onto Citrate-Coated
Au Surfaces Correlated to Their Native Fold, Stability, and PI. J. Phys.
Chem. B 2007, 111, 14329−14345.
(26) De Mey, J. Colloid Gold Probes in Immunocytochemistry. In
ImmunocytochemistryPractical Applications in Pathology and Biology,
Polak, J. M., Van Norden, D., Eds., Wright: Bristol, England, 1983.
(27) Hermanson, G. T. Bioconjugate Techniques, 2nd ed.; Pierce
Biotechnology, Thermo Fisher Scientific: Rockford, 2008; Chapter 24.
(28) Krebs, H. Chemical Composition of Blood Plasma and Serum.
Annu. Rev. Biochem. 1950, 19, 409−430.
(29) Anderson, N. L.; Polanski, M.; Pieper, R.; Gatlin, T.; Tirumalai,
R. S.; Conrads, T. P.; Veenstra, T. D.; Adkins, J. N.; Pounds, J. G.;
Fagan, R. The Human Plasma Proteome a Nonredundant List
Developed by Combination of Four Separate Sources. Mol. Cell.
Proteomics 2004, 3, 311−326.
(30) Dobrovolskaia, M. A.; Patri, A. K.; Zheng, J.; Clogston, J. D.;
Ayub, N.; Aggarwal, P.; Neun, B. W.; Hall, J. B.; McNeil, S. E.
Interaction of Colloidal Gold Nanoparticles with Human Blood:
Effects on Particle Size and Analysis of Plasma Protein Binding
Profiles. Nanomedicine 2009, 5, 106−117.
(31) Lacerda, S. H. D. P.; Park, J. J.; Meuse, C.; Pristinski, D.; Becker,
M. L.; Karim, A.; Douglas, J. F. Interaction of Gold Nanoparticles with
Common Human Blood Proteins. ACS Nano 2010, 4, 365−379.
(32) Zhang, S.; Moustafa, Y.; Huo, Q. Different Interaction Modes of
Biomolecules with Citrate-Capped Gold Nanoparticles. ACS Appl.
Mater. Interfaces 2014, 5, 21184−21192.
(33) Zaenker, P.; Ziman, M. R. Serologic Autoantibodies as
Diagnostic Cancer BiomarkersA Review. Cancer Epidemiol.,
Biomarkers Prev. 2013, 22, 2161−2181.
(34) Wang, X.; Yu, J.; Sreekumar, A.; Varambally, S.; Shen, R.;
Giacherio, D.; Mehra, R.; Montie, J. E.; Pienta, K. J.; Sanda, M. G.;
Kantoff, P. W.; Rubin, M. A.; Wei, J. T.; Ghosh, D.; Chinnaiyan, A. M.
Autoantibody Signatures in Prostate Cancer. N. Engl. J. Med. 2005,
353, 1224−1235.
(35) Xie, C.; Kim, H. J.; Haw, J. G.; Kalbasi, A.; Gardner, B. K.; Li,
G.; Rao, J.; Chia, D.; Liong, M.; Punzalan, R. R.; Marks, L. S.; Pantuck,
A. J.; de la Taille, A.; Wang, G.; Mukouyama, H.; Zeng, G. A Novel
Multiplex Assay Combining Autoantibodies Plus PSA Has Potential
Implications for Classification of Prostate Cancer from Nonmalignant
Cases. J. Transl. Med. 2011, 9, 43.
(36) Berne, B. J.; Pecora, R. Dynamic Light Scattering: With
Applications to Chemistry, Biology and Physics; John Wiley & Sons:
New York, 1976.
(37) Cohen, R. J.; Benedek, G. B. Immunoassay by Light Scattering
Spectroscopy. Immunochemistry 1975, 12, 963−966.
(38) Von Schulthess, G. K.; Cohen, R. J. Laser Light Scattering
Spectroscopic Immunoassay for Mouse IgA. Immunochemistry 1976,
13, 955−962.
(39) Von Schulthess, G. K.; Cohen, R. J.; Benedek, G. B. Laser Light
Scattering Spectroscopic Immunoassay in the Agglutination-Inhibition
Mode for Human Chorionic Gonadotropin (hCG) and Human
Luteinizing Hormone (hLH). Immunochemistry 1976, 13, 963−966.
(40) The User Manual from Malvern Instruments on ZS90 DLS
system.
(41) Wolf, A. M. D.; Wender, R. C.; Etzioni, R. B.; Thompson, I. M.;
D’Amico, A. V.; Volk, R. J.; Brooks, D. D.; Dash, C.; Guessous, I.;
Andrews, K.; DeSantis, C.; Smith, R. A. American Cancer Society
Guideline for the Early Detection of Prostate Cancer Update 2010.
CaCancer J. Clin. 2010, 60, 70−98.
(42) Meigs, J. B.; Barry, M. J.; Oesterling, J. E.; Jaconson, S. J.
Interpreting Results of Prostate-Specific Antigen Testing for Early
Detection of Prostate Cancer. J. Gen. Int. Med. 1996, 11, 505−512.
(43) Catalona, W. J.; Richie, J. P.; Ahmann, F. R.; Hudson, M. A.;
Scardino, P. T.; Flanigan, R. C.; deKernion, J. B.; Ratliff, T. L.;
Kavoussi, L. R.; Dalkin, B. L. Comparison of Digital Rectal
ACS Applied Materials & Interfaces Research Article
DOI: 10.1021/acsami.5b00371
ACS Appl. Mater. Interfaces XXXX, XXX, XXX−XXX
H
9. Examination and Serum Prostate Specific Antigen in the Early
Detection of Prostate Cancer: Results of a Multicenter Clinical Trial of
6630 men. J. Urol. 1994, 151, 1283−1290.
(44) Stamey, T. A.; Johnstone, I. M.; McNeal, J. E.; Lu, A. Y.;
Yemoto, C. M. Preoperative Serum Prostate Specific Antigen Levels
Between 2 and 22 ng/mL Correlate Poorly With Post-Radical
Prostatectomy Cancer Morphology: Prostate Specific Antigen Cure
Rates Appear Constant Between 2 and 9 ng/mL. J. Urol. 2002, 167,
103−111.
(45) Dunn, G. P.; Bruce, A. T.; Ikeda, H.; Old, L. J.; Schreiber, R. D.
Cancer Immunoediting: From Immunosurveillance to Tumor Escape.
Nat. Immunol. 2002, 3, 991−998.
(46) Dunn, G. P.; Old, L. J.; Schreiber, R. D. The Three Es of Cancer
Immunoediting. Annu. Rev. Immunol. 2004, 22, 329−360.
(47) Lacombe, J.; Mangé, A.; Solassol, J. Use of Autoantibodies to
Detect the Onset of Breast Cancer. J. Immunol. Res. 2014, No. 574981.
(48) Wandall, H. H.; Blixt, O.; Tarp, M. A.; Pedersen, J. W.; Bennett,
E. P.; Mandel, U.; Ragupathi, G.; Livingston, P. O.; Hollingswoth, M.
A.; Taylor-Papadimitriou, J.; Burchell, J.; Clausen, H. Cancer
Biomarkers Defined by Autoantibody Signatures to Aberrant O-
Glycopeptide Epitopes. Cancer Res. 2010, 70, 1306−1313.
(49) Kazarian, M.; Laird-Offringa, A. Small-Cell Lung Cancer-
Associated Autoantibodies: Potential Applications to Cancer Diag-
nosis, Early Detection, and Therapy. Mol. Cancer 2011, 10, 33.
(50) Woodard, K. M.; Chapman, C. J. Lung Cancer-Can Autoanti-
bodies Provide an Aid to Diagnosis? Expert Opin. Med. Diagn. 2008, 2,
911−923.
(51) Díaz-Zaragoza, M.; Hernández, R.; Ostoa-Saloma, P. 2D
Immunoblots Show Differential Response of Mouse IgG and IgM
Antibodies to Antigens of Mammary Carcinoma 4 T1 Cells. Cancer
Cell Int. 2014, 14, 9.
(52) Caron, M.; Choquet-Kastylevsky, G.; Joubert-Caron, R. Cancer
Immunomics Using Autoantibody Signatures for Biomarker Discovery.
Mol. Cell. Proteomics 2007, 6, 1115−1122.
(53) Brändlein, S.; Pohle, T.; Ruoff, N.; Wozniak, E.; Müller-
Hermelink, H.-K.; Vollmers, H. P. Natural IgM Antibodies and
Immunosurveillance Mechanisms Against Epithelial Cancer Cells in
Humans. Cancer Res. 2003, 63, 7995−8005.
(54) Vollmers, H. P.; Brändlein, S. Natural Antibodies and Cancer. J.
Autoimmun. 2007, 29, 295−302.
(55) Huo, Q.; Colon, J.; Cordero, A.; Bogdanovic, J.; Baker, C. H.;
Goodison, S.; Pensky, M. Y. A Facile Nanoparticle Immunoassay for
Cancer Biomarker Discovery. J. Nanobiotechnol. 2011, 9, 20.
(56) Silva-Sanchez, C.; Chen, S.; Li, J.; Chourey, P. S. A Comparative
Glycoproteome Study of Transfer Cells-Enriched Basal Endosperm in
the Hexose-Deficient Miniature1 (mn1) Seed Mutant and Its Wild
Type Mn1 in Maize. Front. Plant Sci. 2014, 5, 63.
ACS Applied Materials & Interfaces Research Article
DOI: 10.1021/acsami.5b00371
ACS Appl. Mater. Interfaces XXXX, XXX, XXX−XXX
I