Good Stuff Happens in 1:1 Meetings: Why you need them and how to do them well
July 2013 Housing Sales Statistics
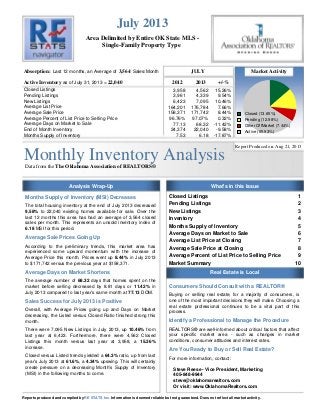
1. Monthly Inventory AnalysisData from the The Oklahoma Association of REALTORS®
Area Delimited by Entire OK State MLS -
Single-Family Property Type
July 2013
Report Produced on: Aug 21, 2013
Absorption:
Active Inventory
3,564
22,040
JULY Market Activity
2012 2013 +/-%
Last 12 months, an Average of Sales/Month
as of July 31, 2013 =
Closed Listings
Pending Listings
New Listings
Average List Price
Average Sale Price
Average Percent of List Price to Selling Price
Average Days on Market to Sale
End of Month Inventory
Months Supply of Inventory
Closed Listings 1
Pending Listings 2
New Listings 3
Inventory 4
Months Supply of Inventory 5
Average Days on Market to Sale 6
Average List Price at Closing 7
Average Sale Price at Closing 8
Average Percent of List Price to Selling Price 9
Market Summary 10
3,958 4,562 15.26%
3,961 4,339 9.54%
6,423 7,095 10.46%
164,201 176,784 7.66%
158,371 171,742 8.44%
96.76% 97.07% 0.32%
77.13 68.32 -11.42%
24,374 22,040 -9.58%
7.53 6.18 -17.87%
Analysis Wrap-Up What's in this Issue
Real Estate is Local
Closed (13.65%)
Pending (12.98%)
Other OffMarket (7.44%)
Active (65.93%)
Months Supply of Inventory (MSI) Decreases
The total housing inventory at the end of July 2013 decreased
9.58% to 22,040 existing homes available for sale. Over the
last 12 months this area has had an average of 3,564 closed
sales per month. This represents an unsold inventory index of
6.18 MSI for this period.
Average Sale Prices Going Up
According to the preliminary trends, this market area has
experienced some upward momentum with the increase of
Average Price this month. Prices went up 8.44% in July 2013
to $171,742 versus the previous year at $158,371.
Average Days on Market Shortens
The average number of 68.32 days that homes spent on the
market before selling decreased by 8.81 days or 11.42% in
July 2013 compared to last year’s same month at 77.13 DOM.
Sales Success for July 2013 is Positive
Overall, with Average Prices going up and Days on Market
decreasing, the Listed versus Closed Ratio finished strong this
month.
There were 7,095 New Listings in July 2013, up 10.46% from
last year at 6,423. Furthermore, there were 4,562 Closed
Listings this month versus last year at 3,958, a 15.26%
increase.
Closed versus Listed trends yielded a 64.3% ratio, up from last
year’s July 2013 at 61.6%, a 4.34% upswing. This will certainly
create pressure on a decreasing Month’s Supply of Inventory
(MSI) in the following months to come.
Consumers Should Consult with a REALTOR®
Buying or selling real estate, for a majority of consumers, is
one of the most important decisions they will make. Choosing a
real estate professional continues to be a vital part of this
process.
Identify a Professional to Manage the Procedure
REALTORS® are well-informed about critical factors that affect
your specific market area - such as changes in market
conditions, consumer attitudes and interest rates.
Are You Ready to Buy or Sell Real Estate?
For more information, contact:
Steve Reese - Vice President, Marketing
405-848-9944
steve@oklahomarealtors.com
Or visit: www.OklahomaRealtors.com
Reports produced and compiled by Information is deemed reliable but not guaranteed. Does not reflect all market activity.RE STATS Inc.
2. Monthly Inventory Analysis
The Oklahoma Association of
REALTORS®
July 2013
ClosedListings
Closed Listings
ReadytoBuyorSellRealEstate?
ContactanexperiencedREALTOR
Data from the
Area Delimited by Entire OK State MLS - Single-Family Property Type
Closed Sales as of Aug 13, 2013
Report Produced on: Aug 21, 2013
JULY YEAR TO DATE (YTD)
5 YEAR MARKET ACTIVITY TRENDS 5yr JUL AVG = 3,736 3 MONTHS
CLOSED LISTINGS & BEDROOMS DISTRIBUTION BY PRICE
High
Low
Jul 2013 = 4,562
Jan 2010 = 1,720
Closed Listingsthis
month at
above the 5 yr JUL
average of
4,562,
3,736
M
A
Y
J
U
N
J
U
L
Distribution of Closed Listings by Price Range % AVDOM 2 Beds 3 Beds 4 Beds 5 Beds+
2009
4,055
2010
2,736
2011
3,368
2012
3,958
2013
4,562
1 Year
2 Year
+15.26%
+35.45%
2009
21,671
2010
21,627
2011
20,277
2012
23,840
2013
25,717
1 Year
2 Year
+7.87%
+26.83%
4,180
4,080
-2.39%
4,562
11.81%
442 9.69% 77.6 194 220 25 3
$50,000
and less
348 7.63% 82.3 127 192 24 5
$50,001
$75,000
435 9.54% 72.1 115 282 37 1
$75,001
$100,000
1,166 25.56% 63.4 200 830 133 3
$100,001
$150,000
953 20.89% 59.4 152 564 230 7
$150,001
$200,000
648 14.20% 68.8 81 264 279 24
$200,001
$275,000
570 12.49% 74.1 49 120 325 76
$275,001
and up
5,000
4,000
3,000
2,000
1,000
0
Jun 2009 Dec 2009 Jun 2010 Dec 2010 Jun 2011 Dec 2011 Jun 2012 Dec 2012 Jun 2013
Total Closed Units:
Total Closed Volume:
Average Closed Price:
4,562
783,489,032
$171,742
68.3 918
112.73M
$122,796
2472
355.27M
$143,717
1053
258.79M
$245,764
119
56.70M
$476,507
pp. 1Reports produced and compiled by Information is deemed reliable but not guaranteed. Does not reflect all market activity.RE STATS Inc.
Steve Reese 405-848-9944 steve@oklahomarealtors.com
3. Monthly Inventory Analysis
The Oklahoma Association of
REALTORS®
July 2013
PendingListings
Pending Listings
ReadytoBuyorSellRealEstate?
ContactanexperiencedREALTOR
Data from the
Area Delimited by Entire OK State MLS - Single-Family Property Type
Pending Listings as of Aug 13, 2013
Report Produced on: Aug 21, 2013
JULY YEAR TO DATE (YTD)
5 YEAR MARKET ACTIVITY TRENDS 5yr JUL AVG = 3,628 3 MONTHS
PENDING LISTINGS & BEDROOMS DISTRIBUTION BY PRICE
High
Low
Apr 2010 = 4,941
Dec 2009 = 2,025
Pending Listingsthis
month at
above the 5 yr JUL
average of
4,339,
3,628
M
A
Y
J
U
N
J
U
L
Distribution of Pending Listings by Price Range % AVDOM 2 Beds 3 Beds 4 Beds 5 Beds+
2009
3,604
2010
2,911
2011
3,327
2012
3,961
2013
4,339
1 Year
2 Year
+9.54%
+30.42%
2009
23,434
2010
22,530
2011
21,762
2012
26,034
2013
28,422
1 Year
2 Year
+9.17%
+30.60%
4,225
4,322
2.30%
4,339
0.39%
160 3.69% 63.0 83 67 7 3
$25,000
and less
693 15.97% 83.1 239 385 61 8
$25,001
$75,000
464 10.69% 64.1 111 302 44 7
$75,001
$100,000
1,050 24.20% 64.6 167 752 128 3
$100,001
$150,000
826 19.04% 69.3 108 492 215 11
$150,001
$200,000
623 14.36% 69.1 90 248 265 20
$200,001
$275,000
523 12.05% 76.0 45 128 290 60
$275,001
and up
5,000
4,000
3,000
2,000
1,000
0
Jun 2009 Dec 2009 Jun 2010 Dec 2010 Jun 2011 Dec 2011 Jun 2012 Dec 2012 Jun 2013
Total Pending Units:
Total Pending Volume:
Average Listing Price:
4,339
739,773,690
$171,287
74.6 843
101.25M
$120,101
2374
338.13M
$142,431
1010
245.13M
$242,699
112
55.27M
$493,494
pp. 2Reports produced and compiled by Information is deemed reliable but not guaranteed. Does not reflect all market activity.RE STATS Inc.
Steve Reese 405-848-9944 steve@oklahomarealtors.com
4. Monthly Inventory Analysis
The Oklahoma Association of
REALTORS®
July 2013
NewListings
New Listings
ReadytoBuyorSellRealEstate?
ContactanexperiencedREALTOR
Data from the
Area Delimited by Entire OK State MLS - Single-Family Property Type
New Listings as of Aug 13, 2013
Report Produced on: Aug 21, 2013
JULY YEAR TO DATE (YTD)
5 YEAR MARKET ACTIVITY TRENDS 5yr JUL AVG = 6,464 3 MONTHS
NEW LISTINGS & BEDROOMS DISTRIBUTION BY PRICE
High
Low
Apr 2010 = 7,789
Dec 2012 = 3,690
New Listings this
month at
above the 5 yr JUL
average of
7,095,
6,464
M
A
Y
J
U
N
J
U
L
Distribution of New Listings by Price Range % 2 Beds 3 Beds 4 Beds 5 Beds+
2009
6,156
2010
6,235
2011
6,412
2012
6,423
2013
7,095
1 Year
2 Year
+10.46%
+10.65%
2009
40,611
2010
43,373
2011
42,679
2012
44,831
2013
45,697
1 Year
2 Year
+1.93%
+7.07%
6,707
6,739
0.48%
7,095
5.28%
632 8.91% 273 305 45 9
$50,000
and less
629 8.87% 234 362 26 7
$50,001
$75,000
845 11.91% 246 525 64 10
$75,001
$100,000
1,755 24.74% 282 1,233 228 12
$100,001
$150,000
1,641 23.13% 197 930 481 33
$150,001
$225,000
855 12.05% 90 311 397 57
$225,001
$325,000
738 10.40% 64 158 371 145
$325,001
and up
8,000
7,000
6,000
5,000
4,000
3,000
2,000
1,000
0
Jun 2009 Dec 2009 Jun 2010 Dec 2010 Jun 2011 Dec 2011 Jun 2012 Dec 2012 Jun 2013
Total New Listed Units:
Total New Listed Volume:
Average New Listed Listing Price:
7,095
1,316,600,919
$175,968
1386
177.95M
$128,388
3824
567.77M
$148,476
1612
428.43M
$265,772
273
142.46M
$521,825
pp. 3Reports produced and compiled by Information is deemed reliable but not guaranteed. Does not reflect all market activity.RE STATS Inc.
Steve Reese 405-848-9944 steve@oklahomarealtors.com
5. Monthly Inventory Analysis
The Oklahoma Association of
REALTORS®
July 2013
ActiveInventory
Active Inventory
ReadytoBuyorSellRealEstate?
ContactanexperiencedREALTOR
Data from the
Area Delimited by Entire OK State MLS - Single-Family Property Type
Active Inventory as of Aug 13, 2013
Report Produced on: Aug 21, 2013
END OF JULY ACTIVE DURING JULY
5 YEAR MARKET ACTIVITY TRENDS 5yr JUL AVG = 24,122 3 MONTHS
INVENTORY & BEDROOMS DISTRIBUTION BY PRICE
High
Low
Jul 2011 = 26,732
Dec 2009 = 19,797
Inventory this
month at
below the 5 yr JUL
average of
22,040,
24,122
M
A
Y
J
U
N
J
U
L
Distribution of Inventory by Price Range % AVDOM 2 Beds 3 Beds 4 Beds 5 Beds+
2009
22,277
2010
25,201
2011
26,732
2012
24,359
2013
22,040
1 Year
2 Year
-9.52%
-17.55%
2009
28,184
2010
30,512
2011
32,682
2012
30,835
2013
28,865
1 Year
2 Year
-6.39%
-11.68%
21,495
21,792
1.38%
22,040
1.14%
1,937 8.79% 115.6 1,016 812 96 13
$50,000
and less
2,263 10.27% 117.9 871 1,244 126 22
$50,001
$75,000
2,665 12.09% 104.8 744 1,672 224 25
$75,001
$100,000
6,709 30.44% 93.3 1,250 4,295 1,068 96
$100,001
$175,000
2,727 12.37% 95.1 410 1,352 888 77
$175,001
$225,000
3,551 16.11% 104.1 532 1,142 1,589 288
$225,001
$375,000
2,188 9.93% 117.7 198 432 1,010 548
$375,001
and up
30,000
20,000
10,000
0
Jun 2009 Dec 2009Jun 2010 Dec 2010Jun 2011 Dec 2011Jun 2012 Dec 2012Jun 2013
Total Active Inventory by Units:
Total Active Inventory by Volume:
Average Active Inventory Listing Price:
22,040
4,438,517,616
$201,385
103.6 5,021
703.06M
$140,023
10,949
1.71B
$155,854
5,001
1.45B
$290,383
1,069
576.81M
$539,576
pp. 4Reports produced and compiled by Information is deemed reliable but not guaranteed. Does not reflect all market activity.RE STATS Inc.
Steve Reese 405-848-9944 steve@oklahomarealtors.com
6. Monthly Inventory Analysis
The Oklahoma Association of
REALTORS®
July 2013
MonthsSupply
Months Supply of Inventory
ReadytoBuyorSellRealEstate?
ContactanexperiencedREALTOR
Data from the
Area Delimited by Entire OK State MLS - Single-Family Property Type
Active Inventory as of Aug 13, 2013
Report Produced on: Aug 21, 2013
MSI FOR JULY INDICATORS FOR JULY 2013
5 YEAR MARKET ACTIVITY TRENDS 5yr JUL AVG = 7.7 3 MONTHS
MONTHS SUPPLY & BEDROOMS DISTRIBUTION BY PRICE
High
Low
Jun 2011 = 9.7
Feb 2013 = 6.0
Months Supply this
month at
below the 5 yr JUL
average of
6.2,
7.7
M
A
Y
J
U
N
J
U
L
Distribution of Active Inventory by Price Range and MSI % MSI 2 Beds 3 Beds 4 Beds 5 Beds+
2009
7.2
2010
7.9
2011
9.6
2012
7.5
2013
6.2
1 Year
2 Year
-17.82%
-35.84%
Inventory
22,040
End of
Month
Active
Inventory
Closed
42,770
Closed
Last
12
Months
Absorption
3,564
Average
Closed per
Month over
12 Months
MSI
6.2
Months
Supply
of
Inventory
MSI %
16.171%
Percent
Months
Supply of
Inventory
6.1
6.2
1.01%
6.2
-0.29%
1,937 8.79% 4.6 5.5 3.9 3.6 4.1
$50,000
and less
2,845 12.91% 7.2 8.8 6.8 5.1 7.7
$50,001
$80,000
2,850 12.93% 6.3 7.0 6.0 6.5 11.2
$80,001
$110,000
5,584 25.34% 5.2 6.0 4.9 5.3 12.3
$110,001
$170,000
3,664 16.62% 5.8 6.8 5.6 5.5 7.5
$170,001
$240,000
2,884 13.09% 7.0 9.3 7.4 6.1 9.1
$240,001
$370,000
2,276 10.33% 13.1 17.0 13.7 11.2 16.6
$370,001
and up
10
9
8
7
6
5
4
3
2
1
0
Jun 2009 Dec 2009 Jun 2010 Dec 2010 Jun 2011 Dec 2011 Jun 2012 Dec 2012 Jun 2013
MSI:
Total Active Inventory: 22,040
6.2 6.9
5,021
5.6
10,949
6.3
5,001
11.7
1,069
pp. 5Reports produced and compiled by Information is deemed reliable but not guaranteed. Does not reflect all market activity.RE STATS Inc.
Steve Reese 405-848-9944 steve@oklahomarealtors.com
7. Monthly Inventory Analysis
The Oklahoma Association of
REALTORS®
July 2013
AverageDaysonMarket
Average Days on Market to Sale
ReadytoBuyorSellRealEstate?
ContactanexperiencedREALTOR
Data from the
Area Delimited by Entire OK State MLS - Single-Family Property Type
Closed Sales as of Aug 13, 2013
Report Produced on: Aug 21, 2013
JULY YEAR TO DATE (YTD)
5 YEAR MARKET ACTIVITY TRENDS 5yr JUL AVG = 77 3 MONTHS
AVERAGE DOM OF CLOSED SALES & BEDROOMS DISTRIBUTION BY PRICE
High
Low
Mar 2011 = 98
Jul 2013 = 68
Average DOM this
month at
below the 5 yr JUL
average of
68,
77
M
A
Y
J
U
N
J
U
L
Distribution of Average Days on Market to Sale by Price Range % AVDOM 2 Beds 3 Beds 4 Beds 5 Beds+
2009
78
2010
79
2011
85
2012
77
2013
68
1 Year
2 Year
-11.42%
-19.32%
2009
86
2010
78
2011
90
2012
84
2013
76
1 Year
2 Year
-9.99%
-16.06%
71
69
-2.94%
68
-1.16%
442 9.69% 77.6 95.9 60.5 88.2 51.0
$50,000
and less
348 7.63% 82.3 96.5 75.0 66.7 73.2
$50,001
$75,000
435 9.54% 72.1 91.0 66.4 56.0 112.0
$75,001
$100,000
1,166 25.56% 63.4 75.2 59.4 71.3 49.7
$100,001
$150,000
953 20.89% 59.4 57.5 57.4 65.1 72.6
$150,001
$200,000
648 14.20% 68.8 85.0 62.9 68.0 90.0
$200,001
$275,000
570 12.49% 74.1 61.9 70.8 72.6 93.8
$275,001
and up
100
90
80
70
60
50
40
30
20
10
0
Jun 2009 Dec 2009 Jun 2010 Dec 2010 Jun 2011 Dec 2011 Jun 2012 Dec 2012 Jun 2013
Average Closed DOM:
Total Closed Units:
Total Closed Volume:
68.3
4,562
783,489,032
81.7
918
112.73M
62.0
2472
355.27M
69.2
1053
258.79M
88.9
119
56.70M
pp. 6Reports produced and compiled by Information is deemed reliable but not guaranteed. Does not reflect all market activity.RE STATS Inc.
Steve Reese 405-848-9944 steve@oklahomarealtors.com
8. Monthly Inventory Analysis
The Oklahoma Association of
REALTORS®
July 2013
AverageListPrice
Average List Price at Closing
ReadytoBuyorSellRealEstate?
ContactanexperiencedREALTOR
Data from the
Area Delimited by Entire OK State MLS - Single-Family Property Type
Closed Sales as of Aug 13, 2013
Report Produced on: Aug 21, 2013
JULY YEAR TO DATE (YTD)
5 YEAR MARKET ACTIVITY TRENDS 5yr JUL AVG = 165K 3 MONTHS
AVERAGE LIST PRICE OF CLOSED SALES & BEDROOMS DISTRIBUTION BY PRICE
High
Low
Jul 2013 = 176,784
Jan 2010 = 138,935
Average LPrice this
month at
above the 5 yr JUL
average of
176,784,
164,656
M
A
Y
J
U
N
J
U
L
Distribution of Average List Price at Closing by Price Range % AVL$ 2 Beds 3 Beds 4 Beds 5 Beds+
2009
156,758
2010
161,871
2011
163,665
2012
164,201
2013
176,784
1 Year
2 Year
+7.66%
+8.02%
2009
149,957
2010
150,605
2011
155,327
2012
157,885
2013
168,461
1 Year
2 Year
+6.70%
+8.46%
172,583
174,527
1.13%
176,784
1.29%
408 8.94% 33,332 32,645 38,419 33,832 27,300
$50,000
and less
325 7.12% 64,823 67,100 68,675 68,858 63,120
$50,001
$75,000
450 9.86% 88,957 90,904 92,723 93,441 119,000
$75,001
$100,000
1,163 25.49% 128,169 128,933 129,338 134,247 135,967
$100,001
$150,000
958 21.00% 175,831 178,674 176,608 181,537 184,300
$150,001
$200,000
655 14.36% 235,487 236,952 236,603 242,126 247,348
$200,001
$275,000
603 13.22% 431,241 392,963 391,418 406,413 687,587
$275,001
and up
200,000
100,000
0
Jun 2009 Dec 2009Jun 2010 Dec 2010Jun 2011 Dec 2011Jun 2012 Dec 2012Jun 2013
Average List Price:
Total Closed Units:
Total List Volume:
$176,784
4,562
806,487,009
$127,127
918
116.70M
$147,320
2472
364.18M
$251,853
1053
265.20M
$507,625
119
60.41M
pp. 7Reports produced and compiled by Information is deemed reliable but not guaranteed. Does not reflect all market activity.RE STATS Inc.
Steve Reese 405-848-9944 steve@oklahomarealtors.com
9. Monthly Inventory Analysis
The Oklahoma Association of
REALTORS®
July 2013
AverageSoldPrice
Average Sold Price at Closing
ReadytoBuyorSellRealEstate?
ContactanexperiencedREALTOR
Data from the
Area Delimited by Entire OK State MLS - Single-Family Property Type
Closed Sales as of Aug 13, 2013
Report Produced on: Aug 21, 2013
JULY YEAR TO DATE (YTD)
5 YEAR MARKET ACTIVITY TRENDS 5yr JUL AVG = 159K 3 MONTHS
AVERAGE SOLD PRICE OF CLOSED SALES & BEDROOMS DISTRIBUTION BY PRICE
High
Low
Jul 2013 = 171,742
Jan 2010 = 133,300
Average SPrice this
month at
above the 5 yr JUL
average of
171,742,
158,907
M
A
Y
J
U
N
J
U
L
Distribution of Average Sold Price at Closing by Price Range % AVS$ 2 Beds 3 Beds 4 Beds 5 Beds+
2009
151,096
2010
155,677
2011
157,650
2012
158,371
2013
171,742
1 Year
2 Year
+8.44%
+8.94%
2009
144,610
2010
145,254
2011
149,188
2012
152,274
2013
163,222
1 Year
2 Year
+7.19%
+9.41%
167,012
169,795
1.67%
171,742
1.15%
442 9.69% 31,778 28,845 34,722 28,892 29,600
$50,000
and less
348 7.63% 64,517 63,609 64,997 66,044 61,796
$50,001
$75,000
435 9.54% 89,024 87,351 89,611 89,717 90,000
$75,001
$100,000
1,166 25.56% 126,786 124,990 126,686 129,911 135,800
$100,001
$150,000
953 20.89% 175,075 175,491 173,590 178,258 181,186
$150,001
$200,000
648 14.20% 234,492 232,116 231,819 237,141 241,106
$200,001
$275,000
570 12.49% 423,922 378,234 380,211 396,070 641,504
$275,001
and up
200,000
100,000
0
Jun 2009 Dec 2009Jun 2010 Dec 2010Jun 2011 Dec 2011Jun 2012 Dec 2012Jun 2013
Average Closed Price:
Total Closed Units:
Total Closed Volume:
$171,742
4,562
783,489,032
$122,796
918
112.73M
$143,717
2472
355.27M
$245,764
1053
258.79M
$476,507
119
56.70M
pp. 8Reports produced and compiled by Information is deemed reliable but not guaranteed. Does not reflect all market activity.RE STATS Inc.
Steve Reese 405-848-9944 steve@oklahomarealtors.com
10. Monthly Inventory Analysis
The Oklahoma Association of
REALTORS®
July 2013
AverageList/SellPrice
Average Percent of List Price to Selling Price
ReadytoBuyorSellRealEstate?
ContactanexperiencedREALTOR
Data from the
Area Delimited by Entire OK State MLS - Single-Family Property Type
Closed Sales as of Aug 13, 2013
Report Produced on: Aug 21, 2013
JULY YEAR TO DATE (YTD)
5 YEAR MARKET ACTIVITY TRENDS 5yr JUL AVG=96.57% 3 MONTHS
AVERAGE L/S% OF CLOSED SALES & BEDROOMS DISTRIBUTION BY PRICE
High
Low
Mar 2013 = 97.20%
Jan 2011 = 95.22%
Average List/Sell this
month at
above the 5 yr JUL
average of
97.07%,
96.57%
M
A
Y
J
U
N
J
U
L
Distribution of $avgmed L/S % by Price Range % AVL/S% 2 Beds 3 Beds 4 Beds 5 Beds+
2009
96.68%
2010
96.04%
2011
96.31%
2012
96.76%
2013
97.07%
1 Year
2 Year
+0.32%
+0.79%
2009
96.22%
2010
96.40%
2011
95.86%
2012
96.29%
2013
96.82%
1 Year
2 Year
+0.55%
+1.00%
97.04%
96.98%
-0.06%
97.07%
0.09%
442 9.69% 91.25% 89.81% 92.36% 85.51%151.28%
$50,000
and less
348 7.63% 95.35% 95.14% 95.27% 96.58% 97.74%
$50,001
$75,000
435 9.54% 96.94% 96.39% 97.22% 97.07% 75.63%
$75,001
$100,000
1,166 25.56% 98.06% 97.02% 98.49% 96.91% 99.73%
$100,001
$150,000
953 20.89% 98.39% 98.25% 98.46% 98.30% 98.28%
$150,001
$200,000
648 14.20% 98.04% 98.06% 98.07% 98.06% 97.46%
$200,001
$275,000
570 12.49% 97.37% 96.74% 97.48% 97.84% 95.57%
$275,001
and up
98
97
96
95
Jun 2009 Dec 2009 Jun 2010 Dec 2010 Jun 2011 Dec 2011 Jun 2012 Dec 2012 Jun 2013
Average List/Sell Ratio:
Total Closed Units:
Total Closed Volume:
97.10%
4,562
783,489,032
95.44%
918
112.73M
97.45%
2472
355.27M
97.53%
1053
258.79M
97.54%
119
56.70M
pp. 9Reports produced and compiled by Information is deemed reliable but not guaranteed. Does not reflect all market activity.RE STATS Inc.
Steve Reese 405-848-9944 steve@oklahomarealtors.com
11. Monthly Inventory Analysis
The Oklahoma Association of
REALTORS®
July 2013
Market Summary
Data from the
Area Delimited by Entire OK State MLS - Single-Family Property Type
Inventory as of Aug 13, 2013
Report Produced on: Aug 21, 2013
Inventory Inventory Market Activity Market Activity
New Listings Closed Sales
Pending Sales
Other Off Market
Active Inventory
Start Inventory
Total Inventory
Units
Volume
7,095 = 24.56%
21,793
28,888
$5,658,515,961
4,562 = 13.65%
4,339 = 12.98%
2,486 = 7.44%
22,040 = 65.93%
Absorption:
Active Inventory
3,564
22,040
JULY Year To Date
2012 2013 +/-% 2012 2013 +/-%
Last 12 months, an Average of Sales/Month
as of July 31, 2013 =
Closed Sales
Pending Sales
New Listings
Average List Price
Average Sale Price
Average Percent of List Price to Selling Price
Average Days on Market to Sale
Monthly Inventory
Months Supply of Inventory
3,958 4,562 15.26%
3,961 4,339 9.54%
6,423 7,095 10.46%
164,201 176,784 7.66%
158,371 171,742 8.44%
96.76% 97.07% 0.32%
77.13 68.32 -11.42%
24,374 22,040 -9.58%
7.53 6.18 -17.87%
23,840 25,717 7.87%
26,034 28,422 9.17%
44,831 45,697 1.93%
157,885 168,461 6.70%
152,274 163,222 7.19%
96.29% 96.82% 0.55%
84.22 75.81 -9.99%
24,374 22,040 -9.58%
7.53 6.18 -17.87%
New Listings Pending Listings List Price Sale Price
Active Inventory Monthly Supply of Inventory % of List to Sale Price Days on Market to Sale
2012
2013
2012
2013
2012
2013
2012
2013
JULY MARKET AVERAGE PRICES
INVENTORY AVERAGE L/S% & DOM
6,423
3,961
7,095
+10.46%
4,339
+9.54%
164,201
158,371
176,784
+7.66%
171,742
+8.44%
24,374 7.53
22,040
-9.58%
6.18
-17.87%
96.76%
77.1397.07%
+0.32%
68.32
-11.42%
pp. 10Reports produced and compiled by Information is deemed reliable but not guaranteed. Does not reflect all market activity.RE STATS Inc.
Steve Reese 405-848-9944 steve@oklahomarealtors.com