Norberto cioffi portfolio power bi video - kp is - dashboards
•
0 likes•41 views

Norberto cioffi portfolio power bi video - kp is - dashboards

Recommended
More Related Content
Similar to Norberto cioffi portfolio power bi video - kp is - dashboards
Similar to Norberto cioffi portfolio power bi video - kp is - dashboards (20)
Recently uploaded
Recently uploaded (20)
Norberto cioffi portfolio power bi video - kp is - dashboards
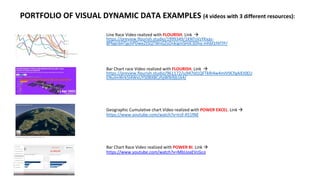
- 1. PORTFOLIO OF VISUAL DYNAMIC DATA EXAMPLES (4 videos with 3 different resources): Line Race Video realized with FLOURISH. Link https://preview.flourish.studio/1999349/1KNTsVzYKxas- 8PbgirbHTgchPDweZtSQTWnGZsOnkigmSHJE3Dhq-mhbl1fXf7P/ Bar Chart race Video realized with FLOURISH. Link https://preview.flourish.studio/961172/iu947Id1QFTkRI4w4mIV9CfqAIEt0EU ENulmWrk5l4WxUYS0BX8CzfqWlb9jb1k4/ Geographic Cumulative chart Video realized with POWER EXCEL. Link https://www.youtube.com/watch?v=Irzf-X51fNE Bar Chart Race Video realized with POWER BI. Link https://www.youtube.com/watch?v=MbUoaEVcGco
- 2. POWER BI – BUSINESS DASHBOARD of KPIs Example: A Multinational Company selling in Different Regions in Europe Same Product Portfolio, who needs to reach Targets in Selling Quantity 1. per Region 2. per Sale Representative 3. per Product Penetration – a focus on years 2017 - 2019