1. Improving Pre-Exam Review Sessions in an Undergraduate Physiology Course
Frank D Perry, MA; Nicole Cesanek; Angela Seliga, PhD
Boston University, Boston, MA
Frank D Perry
Boston University
Email: fdp@bu.edu
Contact
1. Hackathorn, J., Cornell, K., Garczynski, A., Solomon, E., Blankmeyer, K., & Tennial, R. (2012). Examining exam reviews: A comparison of exam scores and attitudes. Journal of the Scholarship of Teaching and Learning, 12(3), 78-87.
2. Jensen, P. A., & Moore, R. (2009). What do help sessions accomplish in introductory science courses?. Journal of College Science Teaching, 38(5), 60.
3. King, D. (2010). Redesigning the preexam review session. Journal of College Science Teaching, 40(2), 88.
4. Virtanen, P., Nevgi, A., & Niemi, H. (2015). Self-Regulation in Higher Education: Students’ Motivational, Regulational and Learning Strategies, and Their Relationships to Study Success. Studies for the Learning Society.
5. Eva, K. W., Cunnington, J. P., Reiter, H. I., Keane, D. R., & Norman, G. R. (2004). How can I know what I don't know? Poor self assessment in a well-defined domain. Advances in Health Sciences Education, 9(3), 211-224.
References
• Provide and improve review session experience to students as an
additional support for exam preparation.
• Examine the effectiveness of review sessions by studying students' self-
awareness and confidence related to content knowledge and exam
preparation.
• Compare students who found the review session useful with those who did
not to provide insight into review session effectiveness .
• Highlight areas for improvement of future review sessions.
Goals
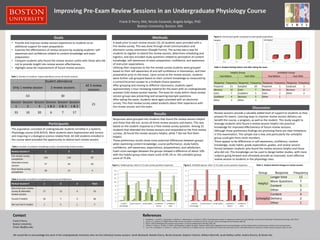
Responses were grouped into students that found the review session helpful
and those that did not, across all three review sessions and exams. This was
based on the student response to a Post-review survey question. Among 33
students that attended the review sessions and responded to the Post-review
surveys, 26 found the review sessions helpful, while 7 did not find them
helpful.
These preliminary results show some potential differences between groups
when examining content knowledge, course performance, study habits,
confidence, self-awareness, expectations, preparedness, and satisfaction.
Exam score averages between the groups showed a difference of about 10%
with the helpful group mean exam score of 85.1% vs. the unhelpful group
score of 75.6%.
A week prior to each review session (3), all students were provided with a
Pre-review survey. This was done through email communication and
electronic survey submission (Google Forms). The survey was a way for
students to register to attend the review session, determine scheduling and
logistics, and also included study questions related to perception of content
knowledge, self-awareness of exam preparation, confidence, and awareness
of instructor expectations.
Utilizing their responses to the Pre-review survey students were grouped
based on their self-awareness of and self-confidence in themselves, and their
preparation prior to the exam. Upon arrival at the review session, students
were further sub-grouped based on their content knowledge as measured by
a correct/incorrect answer to a multiple choice question.
After grouping and moving to different classrooms, students spent
approximately 1 hour reviewing material for the exam with an undergraduate
assistant (UA) review session teacher. The basis for study within these review
session groups was presenting and answering example questions.
After taking the exam, students were again provided with an electronic
survey. This Post-review survey asked students about their experience with
the review session and the exam.
Methods
Review sessions provide a valuable added level of support to students as they
prepare for exams. Learning ways to improve review session delivery can
benefit the course, a program, as well as the student. This study sought to
leverage students who found a review session helpful into practical
knowledge for improved effectiveness of future review sessions.
Although these preliminary findings are promising there are clear limitations
in this examination. The sample size is low, and particularly the unhelpful
group could gain from more members.
There appear to be differences in self-awareness, confidence, content
knowledge, study habits, grade expectation, grades, and review session
format between students who found the review sessions helpful and those
who did not. This knowledge can be used to design better studies, with more
subjects going forward and ultimately provide an improved, more effective
review session to students in the physiology class.
Discussion
Review Session # 1 2 3 Total
Returned post-review
survey & attended
review session
17 12 4 33
Found it helpful 16 7 3 26
Did not find it helpful 1 5 1 7
Results
Figure 2. Unhelpful group: Likert (1-5) scale survey question responses.Figure 1. Helpful group: Likert (1-5) scale survey question responses.
Table 2. Number of students completing surveys, and attending review sessions.
Participants
The population consisted of undergraduate students enrolled in a Systems
Physiology course (CAS BI315). Most students were Sophomores and Juniors
and majoring in a biological science related field. All 240 students enrolled in
the course were provided the opportunity to attend each review session.
Review Session # 1 2 3
Pre-review survey
completion
126 110 87
Attended review
session
77 44 65
Post-review survey
completion
18 12 4
Table 3. Number of students completing post-survey & helpfulness.
Student attendance
Only 1 review session 2 review sessions
All 3 review
sessions
63 30
21
Session
1
Session
2
Session
3
Session
1 & 2
Session
2 & 3
Session
1 & 3
33 10 20 6 7 17
Table 1. Number of students: repeat attendance across all review sessions.
We would like to acknowledge the work of the Undergraduate Assistants who ran the individual review sessions: Sarah Blackwell, Natalie Cherry, Nicole Cesanek, Stephan Foianini, William Mermell, Jacob Reilley-Luther, Andria Sharma, & Steven Xie.
Table 5. Student desired changes to review session.
Group Response Frequency
Helpful
Longer time 12
More Questions 7
Content 5
Other 2
Unhelpful
Content 4
Delivery 2
Other 1
Figure 3. Actual exam grade compared to exam grade expectation.
Helpful Unhelpful
Helpful Group Unhelpful Group
Feel Before Feel After Feel Before Feel After
Response Frequency Response Frequency Response Frequency Response Frequency
Prepared 21 Satisfied 20 Prepared 5 Confused 3
Nervous 12 Calm 7 Nervous 3 Nervous 2
Calm 7 Confident 5 Calm 2 Other 4
Confident 4 Nervous 5 Other 1
Other 3 Other 3
Table 4. Student feelings before and after taking the exam.