2. It is well documented in water that collapsing cavitation
bubbles and clouds produce a distinguishable characteristic
acoustic emission upon collapse.8–11
The goal here was to
assess the feasibility of monitoring this acoustic emission to
determine a threshold proton beam energy where cavitation
first occurs. Megahertz-frequency acoustic transducers im-
mersed in mercury were employed as passive cavitation de-
tectors ͑PCDs͒ to record acoustic activity produced within
mercury by the collapsing cavitation bubbles.
II. EXPERIMENTAL SETUP
A. Mercury target and PCD alignment
The test target was approximately rectangular in shape
with walls made of 4.8-mm-thick 316L stainless steel. The
inner dimensions were 203.2ϫ142.9ϫ41.3 mm3
: A sche-
matic of the target can be seen in Fig. 2. The back wall of the
chamber was fitted with two ultrasonic transducers, which
were mounted off the axis of the incident proton beam in
order to reduce direct radiation exposure to the transducers.
The transducers were angled at 11° so that their acoustic axes
crossed where the proton beam entered the chamber. The two
transducers employed were a 2.25 MHz, 25.4 mm diameter,
200 mm spherically focused transducer ͑model V304,
Olympus-NDT, Waltham, MA͒, and a 1 MHz, 19.05 mm
diameter, unfocused transducer ͑model V314, Olympus-
NDT, Waltham, MA͒. The predicted acoustic fields for the
two transducers are also shown in Fig. 2, with the unfocused
field calculated using a semi-analytical expression12
and the
focused source by means of an angular spectrum calculation.
Piezoelectric transducers typically act as reciprocal
devices,13
and therefore field patterns shown in Fig. 2 also
correspond to the regions that the transducers are sensitive to
when they are used as receivers. The unfocused transducer
was chosen to allow cavitation to be detected over a rela-
tively broad region and the focused transducer was chosen to
provide a more sensitive response, albeit for a smaller re-
gion.
Prior to immersion in mercury the transducers were
mounted into the stainless steel wall and their acoustic fields
characterized in water. We note that the sound speed in mer-
cury ͑ϳ1450 m/s͒ is close to that of water ͑ϳ1500 m/s͒
and therefore the measured spatial acoustic field should be
close to that in mercury ͑the difference in density is only a
multiplicative factor͒. Figure 3 shows results obtained by
scanning a broadband point source 175 mm away from the
front face of the transducer in the Y-Z plane. As seen in Fig.
3 the alignment of the transducers’ beam axes in the Z-axis
was approximately 10 mm off. This suggests a 2°–3° offset
in the welded mounting holes used to secure the PCDs. This
misalignment was not ideal, but as seen in Fig. 2 the acoustic
sensing region of both transducers still coincides with the
expected location of the incoming proton beam.
Scans in the X-Y plane were also conducted to check the
axial sensitivity of the transducers. As expected the unfo-
cused transducer has a larger diameter beam width, Ϸ20
mm, than the focused transducer Ϸ6 mm. On the other hand
the tighter beam of the focused transducer resulted in great
sensitivity at X=0, the location where cavitation is antici-
pated to be most prevalent. The measured beams were well
aligned in the Y-axis and also in good agreement with the
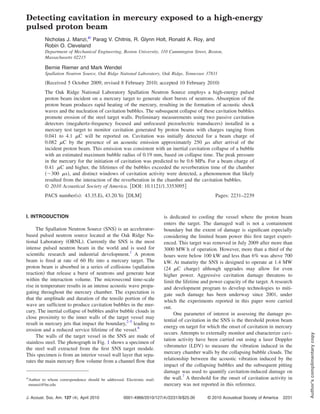
FIG. 1. ͑Color online͒ Picture of a specimen extracted from the first SNS
target module. This specimen ͑diameter ϳ60 mm; original thickness 3 mm͒
is from an interior vessel wall layer that separates the main mercury flow
volume from a channel flow that is dedicated to cooling the vessel where the
proton beam enters the target.
FIG. 2. ͑Color online͒ Plan view schematic of the mercury target. The
incoming proton beam profiles are shown by the solid ellipse with the width
in the Y-axis and the height, which is out of the page shown in the X-axis.
The dashed ellipse shows the large beam profile. The predicted sensing
regions for the focused and unfocused transducers are portrayed by the color
maps.
FIG. 3. ͑Color online͒ ͑Top͒ Y-Z scan in the plane of the incident proton
beam for the unfocused 1 MHz focused 2.25 MHz transducers. ͑Bottom͒
X-Y scan of the unfocused 1 MHz and focused 2.25 MHz transducers.
2232 J. Acoust. Soc. Am., Vol. 127, No. 4, April 2010 Manzi et al.: Detecting cavitation in liquid mercury
Author'scomplimentarycopy
3. predicted profiles shown in Fig. 2. The sensitive regions also
extend along the length of the chamber and so cavitation
activity will also be detected away from the wall.
The PCD transducer configuration was tested by moni-
toring cavitation activity produced by a shock wave lithot-
ripter in water.9,14–16
The PCDs were mounted in the plate
and placed 175 mm away from the focus of the lithotripter
͑same distance as in the mercury tests͒. In this test 50 m long
Bayonet Neill-Concelman ͑BNC͒ coaxial cables were em-
ployed to mimic the long cable path in the proton beam tests
as the electromagnetic pulse generated by the proton beam
can adversely affect nearby electronic equipment. Cavitation
signals were detected by both PCDs with no spurious signal
or noise artifacts induced by the use of 50 m cables. In one
set of mercury experiments the signal level was determined
to be too low and an active filter ͑model 3944, Krohn-Hite,
Brockton, MA͒ with a 10 kHz high pass filter and 20 dB
input gain was placed in a shielded enclosure close to the test
target and drove the BNC cable. The data from both PCDs
were collected by a digital oscilloscope ͑LeCroy Waverunner
LT344, 8 bits, 500 Msample/s͒.
B. Pulsed proton beam facility
The Los Alamos Neutron Science Center ͑LANSCE͒ at
the Los Alamos National Laboratory ͑LANL͒ provided the
pulsed proton beam used in the experiment. In the LANSCE
facility, a linear accelerator accelerates protons to approxi-
mately 84% of the speed of light ͑800 MeV͒. The proton
beam was varied from 1% of full beam charge ͑0.041 C͒
to 100% of full beam charge ͑4.1 C͒. A total of 86 shots
were fired over a 2-h time period with at least 30 s in be-
tween each shot. The duration of the proton pulse was
0.3 s. The spatial distribution of the beam is elliptical with
3:1 X:Y aspect ratio and for the bulk of the experiments
reported here a beam of 21ϫ7 mm2
half-width half-height
was employed. A full charge of 4.1 C results in 26ϫ1012
protons with a corresponding flux of 28
ϫ109
protons/mm2
per pulse. Even though the charge is
less than in the SNS at 1.4 MW on a per pulse basis the
4.1 C charge is equivalent to the SNS running at 2.1 MW
because in the SNS the protons are spread over a larger area.
Based on nuclear calculations the absorption of the proton
beam by mercury should result in a peak pressure of 35 MPa
in the mercury.17
To first order the peak pressure scales lin-
early with proton flux, that is, at 10% charge ͑0.41 C͒ the
peak pressure in the mercury will be 3.5 MPa. Over the
duration of the experiment the temperature of the mercury
increased by 7.6 K. The primary objective of the proton
beam study was to assess damage to the steel chamber,6
and
the PCD experiments reported here were subsequently added
to the test plan. The digital oscilloscope used to acquire the
PCD signals was triggered by a synchronization pulse pro-
vided by LANSCE. This trigger was generated by a sensor
that detected the proton beam nanoseconds prior to hitting
the mercury target and defines time t=0 for all waveforms
shown below.
III. RESULTS AND DISCUSSION
Examples of the raw waveforms recorded from both
PCDs for a beam charge of 2% ͑0.082 C͒ are shown in
Fig. 4. The transducers were located 178.5 mm from the
entrance of the proton beam and therefore ͑based on the 1450
m/s sound speed in mercury͒ the first arrival associated with
acoustic activity where the proton beam enters the mercury
will be at 124 s. It is expected that the dominant acoustic
signals from the thermo-elastic response of the mercury and
the dominant cavitation activity will originate close to where
the proton beam enters. Signals prior to 124 s can most
likely be attributed to acoustic waves generated by the proton
pulse elsewhere in the fluid and electronic noise. In the raw
data shown in Fig. 4, a low frequency signal ͑Ϸ20 kHz͒ was
observed prior to the expected 124 s arrival time. The am-
plitude of this low frequency signal nearly doubled when the
beam charge was increased to 5%. The low frequency signal
became less prevalent with a continuing increase in the beam
energy, but was nonetheless still a substantial part of the
signal. Simulations of the acoustic field in the chamber ͑data
not shown͒ indicated that the Ϸ20 kHz signal could be at-
tributed to reverberation in the vertical axis of the chamber;
the height of 41.3 mm has a propagation time of 60 s. We
note that this signal is 50 times lower than the center fre-
quency of the PCDs and thus has already been reduced by
the transfer function of the transducers. Given that emissions
associated with cavitation are generally high frequency sig-
nals ͑Ն100 kHz͒ a digital high pass filter ͑fourth order, But-
terworth filter with a 100 kHz cut off frequency͒ was applied
to the received data in order to further attenuate these low
frequency signals.
Figure 5 shows digitally high passed filtered waveforms
collected by the focused and unfocused transducers for beam
charges ranging from 1% ͑0.041 C͒ to 100% ͑4.1 C͒. In
the waveforms recorded by the focused transducer, for 1%,
2%, and 5% beam charges, there are signals around 124 and
440 s that appear above the noise. The unfocused trans-
ducer also picked up weak signals at 124 and 440 s with
FIG. 4. ͑Top͒ Unfiltered signal obtained by the focused transducer for a
beam charge of 0.082 C ͑2%͒. ͑Bottom͒ Unfiltered signal obtained by the
unfocused transducer for a beam charge of 0.082 C ͑2%͒.
J. Acoust. Soc. Am., Vol. 127, No. 4, April 2010 Manzi et al.: Detecting cavitation in liquid mercury 2233
Author'scomplimentarycopy
4. the amplitude of this signal approximately half the amplitude
produced by the focused transducer. The signal at 124 s
corresponds to the first arrival of the initial pressure wave
created by rapid heating of the mercury at the entry point of
the proton beam ͑path length approximately 178 mm͒, and it
what follows it will be referred to as the “direct wave.” The
signal at 440 s is caused by a wave that reflects off the
back wall, then the front wall, and propagates to the trans-
ducer ͑total path length of about 628 mm͒; this will be re-
ferred to as the “reverberation wave.” These two signatures
are not associated with cavitation activity and will be iden-
tified by circles on the figures.
A. Cavitation threshold
For a beam charge of 1% there was no evidence of cavi-
tation in either PCD trace. As the proton beam charge was
increased to 2% ͑0.082 C͒ the amplitude of the direct
FIG. 5. ͑Color online͒ Filtered signals obtained by the focused transducer ͑left column͒ and the unfocused transducer ͑right column͒ for beam charges of
0.041, 0.082, 0.20, 0.40, 0.90, 2.05, 3.31, and 4.10 C. Ellipses represent acoustic signals and squares represent cavitation signals. Note that the temporal
scale increases as charge increases from 0.4 to 2.05 C.
2234 J. Acoust. Soc. Am., Vol. 127, No. 4, April 2010 Manzi et al.: Detecting cavitation in liquid mercury
Author'scomplimentarycopy
5. wave doubled consistent with the expected linear relation-
ship between beam charge and acoustic generation. Evidence
of a very weak cavitation emission is present in the focused
transducer data at approximately 240 s; however, this sig-
nal was not detected by the unfocused PCD.
For a beam charge of 5% ͑0.205 C͒ the increase in the
amplitude of the direct wave remained consistent with a lin-
ear pressure-charge relationship. The focused transducer
showed the emergence of two distinct cavitation-related sig-
nals: one at 240 s and the other at approximately 290 s.
These are consistent with the collapse of a cavitation bubble
or bubble cloud near the wall where the proton beam was
incident. The cavitation event was characterized by a char-
acteristic time tcϷ115 s, which is the time between the
direct wave ͑that initiates the cavitation͒ and the acoustic
emission from the bubble collapse.10
The rebound time tr
Ϸ50 s is the time between the acoustic emission from the
initial bubble collapse and the second emission from the
bubble presumably as a result of a rebound.11
Again, the
cavitation signals were not observed above the noise floor of
the unfocused PCD. The focused PCD provides greater sen-
sitivity to cavitation activity and the presence of the cavita-
tion signals indicates that the bubble activity was in or near
the sensing volume of the focused PCD. In what follows all
transient signals that do not correspond to the direct and
reverberation waves will be classified as cavitation signals
and in the figures they will be identified by a rectangle.
For a beam charge of 10% ͑0.41 C͒ the arrival of the
direct wave was still clearly visible at 124 s. However, the
rest of the waveform has now changed qualitatively. The
expected reverberation wave, which should arrive at 440 s,
is not distinguishable from a sequence of signals that arrive
over the time period of 375–500 s. The spikes appear to
grow in amplitude and peak at around 450 s and then rap-
idly decay such that after 500 s the signal is barely detect-
able. The same signal structure was observed in both the
focused and unfocused PCDs. We propose that at this beam
charge a cloud of cavitation is generated that extends from
the entrance window into the bulk of the mercury. These
cavitation bubbles are driven hard enough that they have a
lifetime greater than the reverberation time of the chamber.
As the reverberation wave returns to the front wall it scatters
off and/or collapses the cavitation bubbles along its path,
which result in the sequence of arrivals observed in the figure
with the peak occurring when the reverberation wave inter-
acts with the largest bubbles near the entrance window.
At the next increase in beam charge ͑20% or 0.90 C͒,
the focused transducer was still able to pick up the direct
wave at 124 s. The cavitation activity now extended over a
time frame that started almost immediately after the incident
pulse arrival and grew with time, reaching a peak at 800 s
and then quickly concluding by 900 s, with the hint of a
rebound signature at 1100 s. There is significant “noise”
after the emission at 900 s suggesting that bubbles re-
mained active for a long time either oscillating and continu-
ing to radiate sound or scattering reverberation waves. The
unfocused transducer showed similar behavior but with the
direct wave and collapse emission appearing less distinct.
These data suggest that cavitation activity is now occurring
through much of the mercury. The bubbles further from the
window are not driven as hard resulting in a shorter collapse
time and a less energetic collapse. In addition, these events
are closer to the transducer and therefore will arrive sooner.
The cavitation near the window is likely driven the hardest
and therefore has the longest time scale, most energetic col-
lapse, and due to the propagation distance will arrive the
latest. This is consistent with the strong collapses seen
around 800–900 s. The absence of minor peaks for the
unfocused transducer may have been because it was sensitive
to a much larger region of space and the emissions from the
various bubbles did not arrive in phase.
At a beam charge of 50% ͑2.05 C͒ the direct wave at
124 s was detectable on both transducers. The focused
transducer showed emission activity from 250 to 600 s
with a peak around 440 s, the time of flight corresponding
to the reverberation wave in a bubble free fluid, and may be
due to scattering of the reverberation wave from bubbles
near the window or acoustic emissions from bubbles that are
driven to collapse by the reverberation wave. The cavitation
emissions showed a second distinct peak at 1600 s after
which activity decayed.
At a beam charge of 80% ͑3.31 C͒ no clear direct
wave was identifiable but this may be related to the apparent
loss of sensitivity of the transducer, as will be described in
Sec. III C. The PCDs now recorded three “time windows” of
cavitation activity. The first window at 550 s does not cor-
respond to the travel time of the reverberated wave; however,
the pulse propagated through a two-phase mercury mixture.
We speculate that the presence of bubbles in the bulk of the
mercury reduced the effective sound speed thus delaying the
arrival of the reverberation wave. The second “time window
of activity” occurred between 1100 and 1600 s similar to
the second peak at 50%. A third distinct event occurred at
2100 s suggestive of a rebound.
For proton beam charge of 4.10 C ͑100%͒ again three
windows of cavitation activity were observed. The first win-
dow occurred from 400 to 750 s with distinct acoustic ac-
tivity around 600 s. This is an additional 100 s later than
at 80% beam charge and suggests that the propagation speed
of the echo signal may have been further slowed by the pres-
ence of bubbles in the mercury. The second distinct “time
window” occurred from 1250 to 1600 s. A third time win-
dow of cavitation signal occurred around 2250 s. These
windows of cavitation activity were also present in the unfo-
cused signal.
B. Rayleigh collapse
For the lower beam charges of 0.082 and 0.205C the
PCD recorded the characteristic double bang signature of
inertial cavitation with a tC=120 s. This behavior is in-
dicative of single bubble activity or perhaps a coherent cloud
at the surface of the wall. If we assume that the emissions are
due to a single bubble and further assume that a bubble
spends half of this time in a growth phase and half in a
collapse phase then tC will be twice the Rayleigh collapse
time of a cavity.11,18
The maximum radius of the bubble can
then be estimated from the Rayleigh collapse time
J. Acoust. Soc. Am., Vol. 127, No. 4, April 2010 Manzi et al.: Detecting cavitation in liquid mercury 2235
Author'scomplimentarycopy
6. Rmax =
tC
1.83
ͱP0
0
,
where P0 and 0 are the ambient pressure and density of the
mercury. In these experiments the mercury was slightly over-
pressured and P0=112 kPa in which case the relationship
becomes Rmax=1.6 m/s·tC and the measured time of
120 s corresponds to a maximum radius of 0.19 mm. For
beam charges of 0.41 C and higher the double bang signa-
ture was lost and instead there were distinct windows of
extended cavitation activity. We speculate that for the higher
beam charges the collapse time of the cavitation increased
such that it was longer than the reverberation time of the
chamber. Based on the reverberation time of the chamber the
Rayleigh collapse formula predicts that cavitation bubbles
grew to a radius greater than 0.5 mm. It is also likely that at
the higher beam charges a cloud of cavitation exists in the
mercury. Therefore, when the reverberation wave reflected
off the back wall it propagated through the bubbles before
they had collapsed inertially. Instead the bubbles were driven
to collapse by the reflected acoustic pulse.
C. Transducer status
In the course of the experiments, an apparent reduction
in the sensitivity of the transducers was observed. This was
assessed by monitoring the amplitude of the direct wave dur-
ing the tests. The pressure amplitude of the direct wave
should be linearly proportional to the proton flux and there-
fore the direct wave amplitude divided by the beam charge
should remain constant throughout the experiments. Figure 6
shows the direct wave amplitude normalized by the beam
charge as a function of time ͑top͒ and the beam charge as a
function of time ͑bottom͒. Also shown is the amplitude of the
noise normalized by the beam charge.
For the first 18 min both the normalized direct wave and
the normalized noise remain reasonably constant. At 18 min,
when a beam charge of 50% ͑2.05 C͒ was employed, the
direct wave amplitude dropped to that of the noise floor. As
the beam charge was increased to 4.10 C both normalized
levels dropped reaching a minimum at about 35 min—
associated with the last proton beam at 4.10 C. In particu-
lar, the normalized direct wave amplitude was about 400
times less than the value at 0 min. From 35 to 65 min the
beam charge was stepped down to 0.41 C and the normal-
ized levels started to increase. However, at 65 min, neither
the direct wave nor noise level has recovered to their initial
values. The data suggest a transient change in the signal
levels detected by the PCDs for the higher beam charge.
In order to estimate the performance of the transducers,
the response was assessed before, during, and after radiation
exposure by transmitting a broadband pulse with the unfo-
cused transducer and sensing the reflection from the window
with the focused transducer. This yielded information regard-
ing the combined response of both transducers ͑plus the re-
flectivity of the window͒ rather than the response of an indi-
vidual transducer. The unfocused transducer was excited
with a pulser-receiver ͓model 5072PR, Panametrics ͑now
Olympus-NDT͒, Waltham, MA͔. Figure 7 shows the evolu-
tion of the combined response ͑temporal and spectral͒. Prior
to exposure to proton beam pulses, the received signal was
400 mVpp and the spectrum contained two distinct peaks at
0.75 and 1.75 MHz. A measurement taken midway in the
beam experiments ͑at a time just after 65 min on Fig. 6,
which corresponded to approximately 50 beam pulses͒
showed a dramatic change in the temporal and spectral re-
sponses to the reflected wave. The amplitude dropped by
nearly a factor of 50 to about 8 mVpp, and the two peaks at
0.75 and 1.75 MHz are no longer present in the spectrum.
The change in amplitude is consistent with the change in the
normalized direct wave shown in Fig. 6.
Waveforms taken immediately following the completion
of beam exposure show a shape similar to that taken midway
through beam exposure; however, the waveforms did show
an increase in the signal level to about 70 mVpp, and the
spectral signal around 1 MHz is beginning to recover. The
transducer’s response recovered to near pre-exposure levels
͑approximately 325 mVpp͒ 20 h after beam exposure, and
was comparable to the pre-beam exposure temporal and
spectral responses. It is possible that the proton beam in-
duced a transient change in the piezoelectric efficiency of the
transducers, although we would anticipate that in this sce-
nario a permanent depolarization would occur. Another ex-
FIG. 6. ͑Color online͒ ͑Top͒ Response, normalized to beam power, of the
focused PCD prior to the arrival of the direct wave ͑squares͒ and the sub-
sequent noise floor ͑circles͒ of that response as a function of time. ͑Bottom͒
Beam charge in microcoloumb as a function of time.
2236 J. Acoust. Soc. Am., Vol. 127, No. 4, April 2010 Manzi et al.: Detecting cavitation in liquid mercury
Author'scomplimentarycopy
7. planation is that the increases in temperature of the bulk fluid
may have contributed to the changes. However, only a 7 K
increase in temperature was recorded and this certainly did
not affect the sound speed as can be ascertained from the
arrival times in Fig. 7. Also the temperature hypothesis is not
consistent with the initial recovery seen at the end of the
experiments as the temperature should have still be increas-
ing.
A more likely explanation for the change is the presence
of bubbles, which attenuated the acoustic wave. The absence
of a temporal shift in the arrival time of the pulses suggests
that it was probably not due to bubbles in the bulk. Therefore
we speculate that the reduction in sensitivity was due to the
accumulation of stable bubbles on the face of the transducer.
Mercury does not readily wet most solid surfaces ͑typical
contact angles between 130° and 140°͒ and further our expe-
rience indicates that mercury tends to push out particulates
and impurities and deposit them on the surfaces of the cham-
ber. Cavitation bubbles formed close to the transducers at
high beam charges may have migrated to the surface and
remained there—perhaps partially stabilized by the impuri-
ties that had been ejected by the mercury. Such a bubble wall
would serve to acoustically isolate the sensor. The mercury
was slightly overpressured with helium gas and so there was
gas in the mercury, which could have diffused into bubbles
during cavitation activity. This gas would diffuse back into
the mercury in the quiet times between proton pulses. We
speculate that as the beam charge was increased the amount
of gas driven into the bubbles increased and the bubbles
grew to a large enough size or number density that they
shielded the PCDs. As the beam charge was reduced the
cavitation activity also reduced and so less gas was driven
into the bubble and the bubbles shrunk during the quiet
periods—this would be consistent with the slow recovery
observed in Fig. 6 toward the end of the experiments.
Figure 8 shows PCD measurements after the change in
sensitivity of the transducers for a beam charge of 50%. In
comparison to the waveforms shown in Fig. 5 for 50% beam
charge it can be seen that the direct wave is no longer de-
tected but three distinct windows of cavitation activity are
observed. The first at 450 s is consistent with the emis-
sions shown in Fig. 5. The second at 1600 s is about
100 s later than seen in Fig. 5. A third out-lying distinct
cavitation signal also occurred at 1950 s, which was not
detected in the earlier data. These three windows of cavita-
tion activity are also present in the unfocused signal. These
later signals also show an apparent reduction in “noise” sig-
nal between the emissions.
FIG. 7. ͑Color online͒ Response of the PCDs prior to, midway through, immediately following, and 1 day after proton beam exposure. ͑Left͒ Temporal
response measured by pulsing with the unfocused transducer and listening to reflected wave off the front window of the mercury chamber with the focused
transducer. ͑Right͒ The associated amplitude spectra. For the later responses the initial response is also shown as a solid line.
J. Acoust. Soc. Am., Vol. 127, No. 4, April 2010 Manzi et al.: Detecting cavitation in liquid mercury 2237
Author'scomplimentarycopy
8. D. Beam shape study
The previous experiments all employed an elliptical in-
cident beam profile that had a nominal half-width of 21 mm
and a half-height of 7 mm. In order to assess the effect of the
spatial profile of the proton beam on cavitation activity, full
beam charge experiments were conducted with a small ͑15
ϫ5 mm2
͒ and a large beam ͑30ϫ11 mm2
͒. To account for
the reduction in sensitivity of both PCDs signals from each
transducer were amplified with 20 dB gain and filtered at 10
kHz high pass. The digitized signals were then passed
through the 100 kHz digital high pass filter described previ-
ously. Figure 9 shows representative waveforms taken for the
small and large beams.
For the small beam the PCD waveforms look remark-
ably similar to those for the nominal ͑medium͒ beam size in
Fig. 5. There are windows of cavitation activity from 400–
700 and 1250–1600 s, which are temporally and morpho-
logically similar to what was observed for the regular beam.
It is not possible to conclude whether cavitation fields gen-
erated by the small and medium beams are significantly dif-
ferent.
In contrast, the waveforms for the large beam showed a
distinct change in the cavitation signature. There was no
longer the presence of two distinct time windows of cavita-
tion. Instead there was one window of activity, which began
slightly earlier ͑Ϸ300 s͒ and remained present until an
abrupt transition at approximately 1300 s. This single epi-
sode of cavitation suggests that the large beam produced a
cavitation cloud of larger spatial extent that interfered so
strongly with the acoustic reverberation that the cavitation
patterns seen for the medium and small beams did not occur
here.
IV. CONCLUSIONS
We have demonstrated that both focused and unfocused
megahertz-frequency immersion transducers, acting as pas-
sive cavitation detectors, are able to identify acoustic emis-
sions from cavitation induced by the rapid absorption of a
pulsed proton beam in mercury. The focused PCD proved
more sensitive and was able to detect cavitation signals for a
beam charge as low as 0.082 C. Calculations predict a
pressure amplitude of 0.6 MPa in the mercury at this charge
and this is therefore an estimate of the cavitation threshold in
mercury.
PCD measurements taken for a proton beam with a re-
duced beam size resulted in cavitation signatures similar to
the normal-sized beam. However, for a wider proton beam,
cavitation signals were only received over one time window
indicating that the proton beam energy produced a cavitation
field with different spatial and temporal characteristics. De-
spite exposure to an intense proton beam the two transducers
remained operational throughout the process. However, the
overall sensitivity and high frequency response of both de-
tectors did decay during exposure. The effect proved tran-
sient, as the response recovered the following day, and we
speculate that it was due to the buildup of bubbles on the
transducer surface.
These results demonstrate that proton beam induced
cavitation can be detected in mercury using PCDs. By using
a focused detector, one can achieve resolution in both space
and time. For low beam powers the cavitation signatures
were similar to the double bang emissions expected from
inertial cavitation. As the beam power increased it appeared
that reverberation in the chamber interacted with the cavita-
tion field to result in more complex cavitation activity with
cavitation collapses throughout the mercury. The results sug-
gest that PCDs could be incorporated into the SNS mercury
target in order to monitor cavitation activity during opera-
tion.
ACKNOWLEDGMENTS
This work was supported by the ORNL Spallation Neu-
tron Source, which is managed by University of Tennessee
͑UT͒-Battelle, LLC, under Contract No. DE-AC05-
FIG. 8. PCD measurements after the change in sensitivity of the transducers
for a beam charge of 2.05 C ͑50%͒.
FIG. 9. Representative waveforms obtained for different beam sizes at full
charge 4.1 C. ͑Top͒ Smaller beam size ͑15 mm half-width
ϫ5 mm half-height͒. ͑Bottom͒ Larger beam size ͑30 mm half-width
ϫ11 mm half-height͒.
2238 J. Acoust. Soc. Am., Vol. 127, No. 4, April 2010 Manzi et al.: Detecting cavitation in liquid mercury
Author'scomplimentarycopy
9. 00OR22725 for the U.S. Department of Energy. The authors
would like to thank the LANL and ORNL staffs, in particu-
lar, David Felde ͑ORNL͒, for technical help with the experi-
ments. This work has benefited from the use of the Los Ala-
mos Neutron Science Center at the Los Alamos National
Laboratory, a facility funded by the U.S. Department of En-
ergy.
1
http://neutrons.ornl.gov/aboutsns/aboutsns.shtml ͑Last viewed 2/8/2010͒.
2
T. Benjamin and A. Ellis, “The collapse of cavitation bubbles and the
pressure thereby produced against solid boundaries,” Philos. Trans. R.
Soc. London, Ser. A 260, 221–240 ͑1966͒.
3
J. Blake and D. Gibson, “Growth and collapse of a vapor cavity near a free
surface,” J. Fluid Mech. 111, 123–140 ͑1981͒.
4
J. Blake and D. Gibson, “Cavitation bubbles near boundaries,” Annu. Rev.
Fluid Mech. 19, 99–123 ͑1987͒.
5
T. Leighton, The Acoustic Bubble ͑Academic, Boston, MA, 1997͒, pp.
531–545.
6
J. Haines, B. Riemer, D. Felde, J. Hunn, S. Pawel, and C. Tsai, “Summary
of cavitation erosion investigations for the SNS mercury target,” J. Nucl.
Mater. 343, 58–69 ͑2005͒.
7
M. Futakawa, H. Kogawa, S. Hasegawa, Y. Ikeda, B. Riemer, M. Wendel,
J. Haines, G. Bauer, T. Naoe, N. Tanaka, K. Okita, A. Fijiwara, and Y.
Matsumoto, “Cavitation erosion by proton beam bombarding mercury tar-
get for spallation neutron source,” Sixth International Symposium on
Cavitation, Wageningen, The Netherlands ͑2006͒.
8
A. Vogel and W. Lauterborn, “Acoustic transient generation by laser-
produced cavitation bubbles near solid boundaries,” J. Acoust. Soc. Am.
84, 719–731 ͑1988͒.
9
A. Coleman, J. Saunders, L. Crum, and M. Dyson, “Acoustic cavitation
generated by an extra corporeal shock wave lithotripter,” Ultrasound Med.
Biol. 13, 69–76 ͑1987͒.
10
A. Coleman, M. Choi, J. Saunders, and T. Leighton, “Acoustic emission
and sonoluminescence due to cavitation at the beam focus of an electro
hydraulic shock wave lithotripter,” Ultrasound Med. Biol. 18, 267–281
͑1992͒.
11
R. Cleveland, O. Sapozhnikov, M. Bailey, and L. Crum, “A dual passive
cavitation detector for localized detection of lithotripsy-induced cavitation
in vitro,” J. Acoust. Soc. Am. 107, 1745–1758 ͑2000͒.
12
D. Hutchins, H. Mair, P. Puhach, and A. Osei, “Continuous-wave pressure
fields of ultrasonic transducers,” J. Acoust. Soc. Am. 80, 1–12 ͑1986͒.
13
M. Willatzen, “Ultrasound transducer modeling—General theory and ap-
plications to ultrasound reciprocal systems,” IEEE Trans. Ultrason. Ferro-
electr. Freq. Control 48, 100–12 ͑2001͒.
14
L. Crum, “Cavitation micro-jets as a contributory mechanism for renal
calculi disintegration in ESWL,” J. Urol. ͑Baltimore͒ 140, 1587–1590
͑1988͒.
15
G. Delacrétaz, K. Rink, G. Pittomvils, J. P. Lafaut, H. Vandeursen, and R.
Boving, “Importance of the implosion of ESWL-induced cavitation
bubbles,” Ultrasound Med. Biol. 21, 97–103 ͑1995͒.
16
Y. Pishchalnikov, O. Sapozhnikov, M. Bailey, J. Williams, Jr., R. Cleve-
land, T. Colonius, L. Crum, A. Evan, and J. McAteer, “Cavitation bubble
cluster activity in the breakage of kidney stones by lithotripter shock
waves,” J. Endourol 17, 435–446 ͑2003͒.
17
B. Riemer, “Benchmarking dynamic strain predictions of pulsed mercury
spallation target vessels,” J. Nucl. Mater. 343, 81–91 ͑2005͒.
18
P. Chitnis and R. Cleveland, “Quantitative measurements of acoustic emis-
sions from cavitation at the surface of a stone in response to a lithotripter
shock wave,” J. Acoust. Soc. Am. 119, 1929–1932 ͑2006͒.
J. Acoust. Soc. Am., Vol. 127, No. 4, April 2010 Manzi et al.: Detecting cavitation in liquid mercury 2239
Author'scomplimentarycopy