Downloaded 21 times

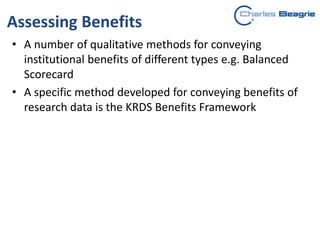
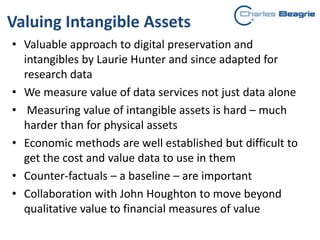
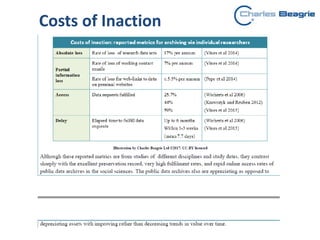
![Counter-factuals – “Costs of Inaction”
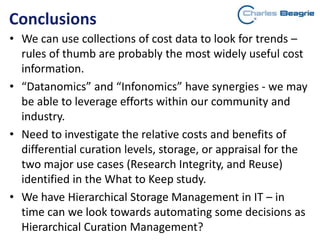
“Ideally, economic impact assessments should estimate
the counterfactual – i.e. what would occur in the
absence of the facility…However, counterfactuals are
rarely addressed in the [c.100] studies reviewed due to
lack of data. We found two exceptions that address this
issue partially. One is the evaluation of the economic
impacts of ESDS (2012) which partially explores the
counterfactual through a users’ survey…Another
exception is a review of economic impacts of large-scale
science facilities in the UK (SQW, 2008) … however, this
estimation is not done rigorously and relies mostly on
the estimation of the local benefits.”
Big Science and Innovation - Report to BIS - Technopolis
2013](https://image.slidesharecdn.com/dpcdatanomicsglasgow2019slideshare-190321114628/85/Datanomics-the-value-of-research-data-21-320.jpg)
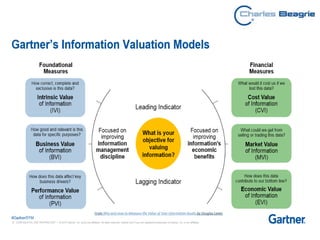
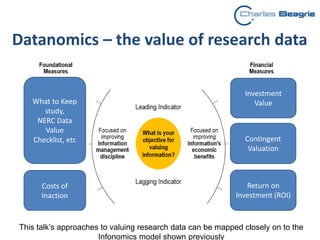

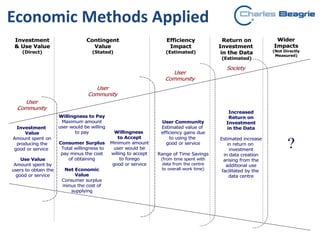
The document discusses the costs, benefits, and value of research data, highlighting various cost models and trends associated with data curation. It presents qualitative and quantitative methods for assessing the benefits of research data, and emphasizes the challenges of valuing intangible assets in the digital age. Recommendations are provided for future research on differential curation levels and the necessity of improved accounting practices for data as an asset.


![[DSC Europe 25] Bojan Djuricic - Predictive Design Process.pdf](https://cdn.slidesharecdn.com/ss_thumbnails/5awdrbedqdek3gqu2ezy-4-the-predictive-design-bojan-djuricic-260120105856-6c399e9b-thumbnail.jpg?width=640&height=640&fit=bounds)


![[DSC Europe 25] Dubravko Culibrk - Deep Learning for Mammography.pptx](https://cdn.slidesharecdn.com/ss_thumbnails/yiscimuktacgqoiu4dkp-deep-learning-for-mammography-260119121559-aad59182-thumbnail.jpg?width=640&height=640&fit=bounds)
![[DSC Europe 25] Andrzej Kowalczyk - AI - how to start small and grow in the f...](https://cdn.slidesharecdn.com/ss_thumbnails/oy1zmo94qv6vpcqjvno2-andrzej-kowalczyk-ai-how-to-start-small-and-grow-in-the-future-1-260119121559-cf093b23-thumbnail.jpg?width=640&height=640&fit=bounds)
![[DSC Europe 25] Laila Kakar - Leveraging AI for Strategic Excellence: Enhanci...](https://cdn.slidesharecdn.com/ss_thumbnails/eykmhrtsqmaaftwkexh7-dsc-lailakakar-1-260119101520-5f3b5616-thumbnail.jpg?width=640&height=640&fit=bounds)
![[DSC Europe 25] Mikhail Rozhkov - AI Product Canvas: From Business Goals to T...](https://cdn.slidesharecdn.com/ss_thumbnails/d53doddtpgfqivmzqel6-mikhail-rozhkov-ai-product-canvas-v1-260121115910-9dd517a7-thumbnail.jpg?width=640&height=640&fit=bounds)
![[DSC Europe 25] Egor Krasheninnikov - The Control Stack: Building Guardrails ...](https://cdn.slidesharecdn.com/ss_thumbnails/3lzcz7hxqmo51mtalv4u-the-control-stack-260119101520-ea90841a-thumbnail.jpg?width=640&height=640&fit=bounds)
![[DSC Europe 25] Srdj Stanisic - Local and Private AI in UX.pdf](https://cdn.slidesharecdn.com/ss_thumbnails/vwmetykqmztgmokmmkfa-3-srdjan-stanisic-local-and-small-ai-in-ux-260120105855-55a31869-thumbnail.jpg?width=640&height=640&fit=bounds)


![[DSC Europe 25] Tali Fulman - Guild Meetings, Then What? Building Data Commun...](https://cdn.slidesharecdn.com/ss_thumbnails/fgohhi33rwmhqdowdj5k-tali-fulman-guild-meetings-then-what-building-data-communities-that-actually-ch-260120105855-528492c3-thumbnail.jpg?width=640&height=640&fit=bounds)
![[DSC Europe 25] Milovan Jovicic - Beyond AI's Reach: The Enduring Value of Ev...](https://cdn.slidesharecdn.com/ss_thumbnails/pyeij0hurgwq5jugmtnv-2-milovan-jovicic-beyond-ais-reach-the-enduring-value-of-evergreen-design-v2-260120105856-d6ee57e5-thumbnail.jpg?width=640&height=640&fit=bounds)


![[DSC Europe 25] Josip Saban - Career building for data professionals.pptx](https://cdn.slidesharecdn.com/ss_thumbnails/zroflcttkm1vmli0txea-josip-saban-career-building-for-data-professionals-260123083019-587cdb8c-thumbnail.jpg?width=640&height=640&fit=bounds)