1. BMI, Education, and Income in Relation to the Knowledge and Usage of the 2005 USDA MyPyramid in
US Women Aged 25 to 45 Years.
Authors: Natasha M. Lopez, Melissa A. Masters, PhD, RDN1
Metropolitan State University of Denver, Denver Colorado
1Faculty Mentor, Assistant Professor, Department of Nutrition
Introduction:
The 2005 USDA food guidance system MyPyramid, provided food-based
guidance system that used a pyramid structure to implement dietary
recommendations of food groups. MyPyramid was a diet tracking tool that
enabled individuals to track their caloric needs based on their sex, age, and
activity level. The program also encouraged users to eat more fruits,
vegetables, and grains, while limiting intake of saturated fat, trans-fat, sugar-
additives, and processed sugars. Whether this design structure was effective
in implementation could be based on several factors: BMI, education levels,
and income levels.
Objective:
The purpose of this study was to examine the relationship of BMI, income, and
education levels on the both the knowledge and usage of the 2005 Food
Guidance System MyPyramid, with women aged 25-45 years.
Methods:
Design setting and participants:
A cross-sectional analysis of the 2009-2010 National Health and Nutrition
Examination Survey (NHANES) was utilized for this study. Data from a total of
1,097 females, aged 25-45 years was analyzed for the purpose of this study.
Statistical Analysis:
Prevalence of each category, BMI (healthy, overweight and obese), using
standards outlined by the Center of Disease Control, education level (< 9th grade,
some high school, high school diploma/GED, some college to college graduate),
race/ethnicity (white, black, or Hispanic), and PIR groups (<130%, 130% to 349%,
and ≥350%) were determined for the entire sample and analyzed separately for
each of the categories pertaining to the knowledge of MyPyramid (tried, heard of,
and/or looked up) and the knowledge of the USDA Food Pyramid. The survey
design was taken into account when analyzing the NHANES data. Survey sample
weights were used, and the complex survey design was accounted for in the
estimation of variance. The data was analyzed using the SAS (version 9.4)
software.
Results:
Demographic Results:
College level education, among participants, was most prevalent (33.5%±2.0%)
compared to a high school level education (5.3%±-0.6%). Approximately
38.0%±1.5% of participants were middle income compared to 26.0%±1.0% of
whom were low income. Approximately 37.0%±2.0% of participants had a
normal BMI, 26.5%±2.0% were considered overweight, and 34.0%±2.0% obese
according to BMI anthropometric standards.
Knowledge and Usage of MyPyramid:
Prevalence of knowledge of the 2005 Food Guidance System was highest among
women who reported to have a college level education (66.0%±3.0%) and
earned mid-level income (67.0%±4.0%). Both obese (36.0%±5.0) and low-
income (36.0%±3.0%) groups had the highest prevalence of participants who
had tried MyPyramid.
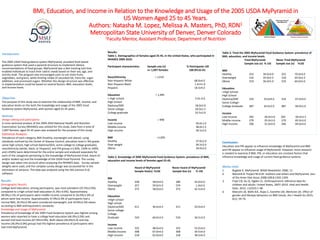
Results:
Table 1. Demographics of females aged 25-45, in the United States, who participated in
NHANES 2009-2010.
Participant characteristics Sample size (n) % Participants ±SE
n= 1,097 females 100.0%±6.5%
Race/Ethnicity = 1,019
Non-Hispanic White 68.0±4.0
Non-Hispanic Black 1.4±11.0
Hispanic 18.5±4.0
Education = 1,095
< High school- 5.0±-0.6
High School
Diploma/GRE 18.0±2.0
Some college- 30.0±1.5
College graduate 33.5±2.0
Income = 998
Low-income 26.0±1.0
Middle-income 38.0±1.5
High-income 36.5±2.0
BMI =1,095
Healthy 37.0±2.0
Over weight 26.5±2.0
Obese 34.0±2.0
Table 2. Knowledge of 2005 MyPyramid Food Guidance System: prevalence of BMI,
education and income levels of females aged 25-45.
Heard of MyPyramid Never heard of MyPyramid
Sample Size(n) %±SE Sample Size (n) % ±SE
BM
Healthy 228 58.0±4.0 286 42.0±4.0
Overweight 257 59.0±5.0 574 1.0±5.0
Obese 372 58.0±4.0 372 42.5±4.0
Education
<High school-
High school
Diploma/GRE 411 46.0±4.0 411 54.0±4.0
Some college-
College
Graduate 524 66.0±3.0 524 34.5±3.0
Income
Low-income 332 48.0±4.0 332 52.0±4.0
Middle-income 308 67.0±4.0 308 34.5±4.0
High-income 218 62.0±4.0 218 38.5±4.0
Table 3. Tried the 2005 MyPyramid Food Guidance System: prevalence of
BMI, education, and income levels.
Tried MyPyramid Never Tried MyPyramid
Sample size (n) % ±SE Sample size (n) %±SE
BMI
Healthy 252 30.0±4.0 252 70.0±4.0
Overweight 216 35.0±2.5 216 65.0±2.5
Obese 319 36.0±5.0 319 64.0±5.0
Education
<High School-
High School
Diploma/GRE 316 33.0±4.0 316 67.0±4.0
Some College-
College Graduate 487 34.0±2.0 487 66.0±2.0
Income
Low-income 265 36.0±3.0 265 64.0±3.5
Middle-income 279 35.0±3.0 279 65.0±3.0
High-income 206 31.0±4.0 206 69.0±4.0
Conclusion:
Education and PIR appear to influence knowledge of MyPyramid and BMI
and PIR appear to influence usage of MyPyramid. However, more research
is needed to examine if BMI, PIR, or education are constant factors that
influence knowledge and usage of current food guidance systems
Works cited
1. Bugbee K. MyPyramid. NASN Newsletter. 2006; 11
2. Wansink B. Project M.O.M: mothers and others and MyPyramid. Jour
of the Amer Diet Assoc.2008;108:8:1302-1304.
3. Fryar CD, Gu Q, Ogden CL. Anthropometric reference data for
children and adults: United States, 2007–2010. Vital and Health
Stats. 2012; 11(252):1-48.
4. Malcolm JD, Walls KJE, Rojas C, Everette LM, Wentzien DE. Effect of
gender and lifestyle behaviors on BMI trends. Am J Health Sci.2015;
6(1): 59-74.