1. Statistical Error Model for Real-Time PCR Based RNAi Validation
Y. Wang, S. Tian, X. Zeng
SuperArray Bioscience Corporation, Frederick, MD 21704
Abstract
Multiple Factors Affect Confidence in RNAi Measurements
Validation Outcome for SureSilencing™ shRNA Plasmid
RNA interference (RNAi) using synthetic siRNA or vector-based shRNA
has growing popularity among researchers trying to understand the
functional roles of their genes of interest. Central to any RNAi experiment
is the validation of knockdown efficiency. Although validation by Western
analysis is indeed still necessary for successful gene function studies,
real-time PCR provides a simpler method to validate the suppression of
gene expression and therefore a more direct measure of actual RNAi
success. However, due to limitations caused by variations in real-time
PCR detection and siRNA delivery, some erroneous conclusions can
easily be made when interpreting RNAi validation results. Here, we
analyze all sources of variance in an RNAi validation process using both
theoretical and experimental approaches to build a statistical error model
for real-time PCR based RNAi validation. According to our model, greater
than 80% transfection efficiency is essential for RNAi validation. We also
demonstrate the absolute need for both biological and technical
replicates. Based on our model, a practical guideline is provided for
minimal required replicates in real time PCR based RNAi validation.
Figure 1: Sensitivity of Variance in RNAi Measurement to Various Parameters
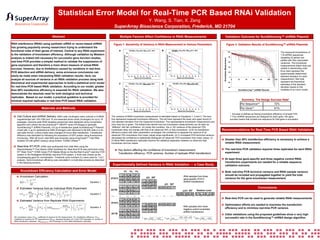
Figure 3: Validation Results of SureSilencing™ shRNA Plasmids
SureSilencing™
TE=60%, CVTE=5%, SDPCR=0.1, N=3
Expected Knockdown
Expected Knockdown
100
80
60
40
20
100
80
60
40
20
0
0
100
90
80
70
60
50
40
30
20
10
100
0
90
D
TE=80%, CVTE=5%, SDPCR=0.2, N=3
Expected Knockdown
Expected Knockdown
100
80
60
40
20
100
Real-time RT-PCR: cDNA was synthesized from total RNA using the
ReactionReady™ First Strand cDNA Synthesis Kit. Real-time PCR was performed using
RT2 Real-Time™ SYBR Green PCR Master Mixes on the Bio-Rad iCycler® real-time PCR
system or the Stratagene Mx3000p real-time PCR system. β-Actin was chosen as the
housekeeping gene for normalization. Threshold cycle numbers (Ct) were used for “∆∆Ct”
analysis. Gene knockdown efficiency was calculated in a multi-step process as described
in the following sections.
90
80
70
60
50
CVKD =
2
4 SDPCR 2 −∆∆Ct
SDKD
2
2
×
≈ CVTE + 2 SDMultiExpAVG +
KD
N 1 − 2 − ∆∆Ct
30
20
10
0
40
30
20
10
Ct2
Equation 1
2 27.0 27.0 27.0
Equation 3
40
60
80
100
120
0
100 90
0
Summary: The Design Success Rate*
Rate*
80
70
60
50
40
30
20
10
0
RNA samples from three
gene-specific STAT3
geneshRNA transfections
2 17.9 18.2 17.7
∆Ct SD‡
2 9.07 0.25
3 8.93 0.24
AVG 9.03 0.17
Relative Level
∆∆Ct SD#
91%
* Success is defined as having knockdown efficiency of at least 70%.
** Four shRNA sequences are designed for each gene. Per gene
success means that at least one sequence for that gene is successful.
Recommendations for Real-Time PCR Based RNAi Validation
Greater than 80% transfection efficiency is necessary to achieve a
reliable RNAi measurement.
The real-time PCR validation requires three replicates for each RNAi
experiment.
At least three gene-specific and three negative control RNAi
transfection experiments are needed for a reliable sequence
validation outcome.
Both real-time PCR technical variance and RNAi sample variance
should be included and propagated together to yield the total
variance for the gene knockdown measurement.
Conclusions
0.15←0.20→0.26
AVG 2.36 0.39
Real-time PCR can be used to generate reliable RNAi measurements.
1 6.50 0.22
AVG 6.68 0.36
2 6.47 0.25
1 17.9 18.2 18.1
3 7.07 0.12
2 17.6 18.1 17.8
3 18.1 18.1 18.2
72%
Per Gene**
Observed Knockdown
1 9.10 0.26
STAT3 2 24.3 24.3 24.3
3 25.1 25.2 25.3
ACTB
KD, knockdown value; CVKD, coefficient of variance for KD measurement; TE, transfection efficiency; CVTE,
coefficient of variance for TE measurement; SDPCR, standard deviation of Ct from PCR replicates; N, number of
RNAi transfection replicates; SDMultiExpAVG, SD of average ∆Ct from RNAi transfection replicates.
20
Per Sequence**
20
1 24.4 24.6 24.7
2
0
SureSilencing™ shRNA Plasmid
40
3 17.9 18.0 17.6
Equation 2
0
60
∆Ct SD†
1 17.8 17.8 17.9
ACTB
20
-40
Ct3
3 26.7 26.7 26.9
STAT3
40
The measured knockdowns of
119 shRNA sequences
(targeting 32 genes) are
plotted with their associated
variances. The knockdown
measurements (black dots) are
ranked in descending order.
Error bars represent the
experimentally determined
standard deviation for each
measurement. Red dots
represent the theoretical
estimates of the standard
deviation based on the
variables of our error model.
80
Experimentally Defined Variance in RNAi Validation a Case Study
Ct1
60
-20
Key factors affecting the confidence of knockdown measurement:
Transfection efficiency, PCR variance, Number of replicate RNAi transfections
1 27.0 26.7 27.2
Estimated Variance from an Individual RNAi Experiment:
2
SDKD
4
2 − ∆∆Ct
2
2
CVKD =
≈ CVTE + ∑ SDPCR ×
− ∆∆Ct
KD
n =1
1− 2
Estimated Variance from Replicate RNAi Experiments:
40
The variance of RNAi knockdown measurement is estimated based on Equations 1, 2 and 3. The blue
line represents measured knockdown efficiency. The red lines represent the lower and upper bound of
one standard deviation from the measured knockdown. The representative knockdown measurement and
error bars are in green. The dotted lines denote how two knockdown measurements can be seen as
“different” with fair confidence. (A) Under this condition, the ±1 SD variance of the observed 70%
knockdown does not overlap with that of an observed 34% or less knockdown. (A-B) As transfection
efficiency lowers with other parameters unchanged, the confidence to separate the variance of an
observed 70% knockdown from lower values drops significantly. (A-C) Increased PCR technical variance
decreases the confidence to statistically distinguish an observed 70% knockdown from lower values. (CD) More RNAi transfection replicates improve the statistical separation between an observed high
knockdown and low values.
Knockdown Efficiency Calculation and Error Model
Knockdown Calculation:
1 − 2 − ∆∆Ct
KD =
TE
50
100
Observed Knockdown
supplemented with 10% FBS and 1X non-essential amino acids (Invitrogen) for up to 15
passages. Genome-wide RNAi targeting sequences were designed using a proprietary
algorithm and cloned into the pGeneClip™ hMGFP vector (Promega) to generate
SureSilencing™ shRNA Plasmids. 0.8 µg of transfection grade SureSilencing™ Plasmid
mixed with 3 µg of Lipofectamine 2000 (Invitrogen) was delivered to 80,000 cells in a 24well plate format. Culture media were changed 24 hours after transfection. Transfection
efficiency was estimated by following the expression of GFP protein using fluorescence
microscopy. After 48 hours, total RNA was extracted using ArrayGrade™ Total RNA
Isolation Kit with gDNA cleanup using Ambion TURBO DNase™.
60
TE=80%, CVTE=5%, SDPCR=0.2, N=1
0
Cell Culture and shRNA Delivery: 293H cells (Invitrogen) were cultured in D-MEM
70
80
120
120
Materials and Methods
80
Observed Knockdown
Observed Knockdown
C
100
120
120
Knockdown Measurement
A
B
TE=80%, CVTE=5%, SDPCR=0.1, N=3
†
2
SD= SD2 3 + SDACTB
STAT
‡
2
SD= SDAVG∆Ct +
RNA samples from three
negative control scrambled
shRNA transfections
SD2 + SD2 + SD2
1
2
3
9
#
2
SD = SDRNAi + SD2
Ctrl
Optimization efforts are needed to maximize the transfection
efficiency and to minimize real-time PCR variance.
Initial validations using the proposed guidelines show a very high
successful rate in the SureSilencing™ shRNA design algorithm.