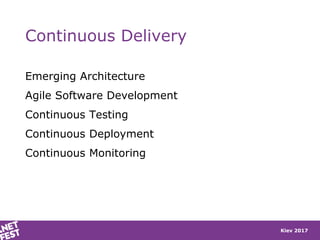
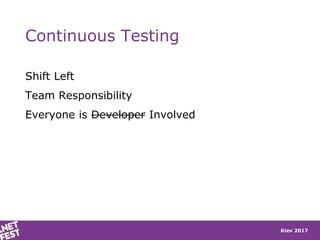
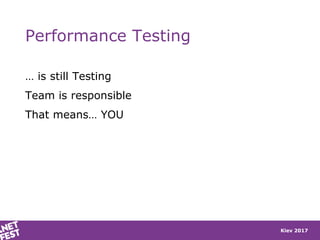
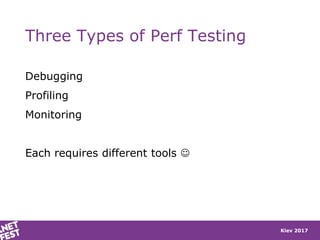
Kiev 2017
Only real cases. Only actual trends.
Treasure Hunt: Finding
your application hotspot
Martin Kulov
Association of Software Engineers
Kiev 2017
Only real cases. Only actual trends.
It is a DevOps world!
Treasure Hunt: inding your application hotspot
<show visual DevOps>
Treasure Hunt: Finding your application hotspot
Kiev 2017
Agile Software Development
Kiev 2017
Continuous Delivery
Emerging Architecture
Agile Software Development
Continuous Testing
Continuous Deployment
Continuous Monitoring
Kiev 2017
Continuous Testing
Shift Left
Team Responsibility
Everyone is Developer Involved
Kiev 2017
Performance Testing
… is still Testing
Team is responsible
That means… YOU
Kiev 2017
Three Types of Perf Testing
Debugging
Profiling
Monitoring
Each requires different tools 
Kiev 2017
Only real cases. Only actual trends.
Before we start…
Kiev 2017
Simple Checklist
Isolate the cause
CPU
Memory
Network
Disk
Locate the root cause
Provide fix
Kiev 2017
General Guidelines
Start measures as early as possible
Set up Source Symbols
Use Release build
Beware of the observer effect
Kiev 2017
Only real cases. Only actual trends.
What are Source
Symbols?
Kiev 2017
Program Database Files (PDB)
Generated on build
Contains metadata about unmanaged code
Contains location of the source code
Files should be published to symbol server
Kiev 2017
Microsoft Symbol Server
Contains PDBs for Windows
https://msdl.microsoft.com/download/symbols
Moved to Azure based store
“backed by a more robust publishing pipeline”
SET _NT_SYMBOL_PATH=srv*DownstreamStore*https://
msdl.microsoft.com/download/symbols
Kiev 2017
Only real cases. Only actual trends.
DEMO: Configure use of
Symbol Server
Kiev 2017
Only real cases. Only actual trends.
Debug vs Release
Kiev 2017
Kiev 2017
Only real cases. Only actual trends.
The Observer Effect
Kiev 2017
Only real cases. Only actual trends.
“a heisenbug is a
software bug that seems
to disappear or alter its
behavior when one
attempts to study it.”
Kiev 2017
Examples
Debugger
Profiler
VS Host process
VS Test process
Kiev 2017
Only real cases. Only actual trends.
Debugging Performance
Kiev 2017
Debugging Performance
SolarLint
Code Analysis
PerfTips
Diagnostic Tools
Kiev 2017
SonarLint
Kiev 2017
Code Analysis
Kiev 2017
PerfTips
Performance measures while debugging
Run To Cursor (Ctrl+F10)
Take Multiple Measurements
Kiev 2017
Diagnostic Tools
Use Event Tracing for Windows (ETW)
ETW provides call stack
Samples from function entry and exit points
Kiev 2017
Only real cases. Only actual trends.
DEMO: Debugging
Performance
Kiev 2017
Only real cases. Only actual trends.
Profiling Performance
Kiev 2017
Profiling Performance
Visual Studio Profiler
Visual Studio Stand Alone Profiler
CLR Profiler
Collect data under load
Kiev 2017
Only real cases. Only actual trends.
Sampling vs
Instrumenting
Kiev 2017
Sampling Profiler
Non obtrusive
CPU execution samples
Memory footprint samples
Kiev 2017
Instrumenting Profiler
Obtrusive
Can break the application
Use .NET profiler variables
COR_ENABLE_PROFILING
COR_PROFILER
Slows down the application
Kiev 2017
Only real cases. Only actual trends.
DEMO: Profiling
Performance
Kiev 2017
Only real cases. Only actual trends.
Monitoring Performance
Kiev 2017
Monitoring Performance
Performance Counters – PerfMon, PAL Tool
Application Insights
Dynatrace (for complex environments)
Kiev 2017
Kiev 2017
Kiev 2017
Only real cases. Only actual trends.
DEMO: Monitoring
Performance
Kiev 2017
Summary
Performance Testing is a continuous effort
Debug, Profile and Monitor Performance
Continuously Improve
Kiev 2017
Only real cases. Only actual trends.
Questions?
martin@kulov.net

.NET Fest 2017. Martin Kulov. Treasure Hunt: Finding your application hot spot