SlideShare a Scribd company logo
23/3/14
Mr Davies,
Your response to my concerns about remote students struggling to get back to school at the end of July is
contradicted by the evidence of the E & A tables on the department’s website.
There are 75 remote schools, but information on the department website does not name the 28 schools you refer to
as very remote. As a consequence I have analysed all 75 schools, but I have not identified the sub-group of “very
remote” you refer to.
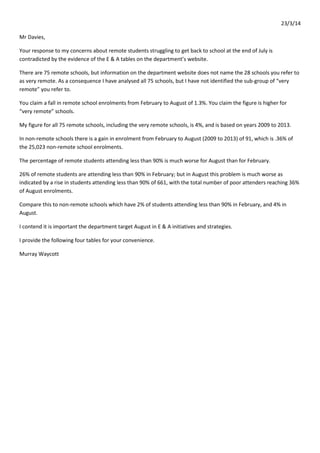
You claim a fall in remote school enrolments from February to August of 1.3%. You claim the figure is higher for
“very remote” schools.
My figure for all 75 remote schools, including the very remote schools, is 4%, and is based on years 2009 to 2013.
In non-remote schools there is a gain in enrolment from February to August (2009 to 2013) of 91, which is .36% of
the 25,023 non-remote school enrolments.
The percentage of remote students attending less than 90% is much worse for August than for February.
26% of remote students are attending less than 90% in February; but in August this problem is much worse as
indicated by a rise in students attending less than 90% of 661, with the total number of poor attenders reaching 36%
of August enrolments.
Compare this to non-remote schools which have 2% of students attending less than 90% in February, and 4% in
August.
I contend it is important the department target August in E & A initiatives and strategies.
I provide the following four tables for your convenience.
Murray Waycott
1. 75 remote & very remote schools - raw enrolment
2009 2010 2011 2012 2013 Average
February Enrolments 75 Remote
Schools* 8220 8193 8348 8170 8389 8284
August Enrolments 75 Remote
Schools 8044 8155 7913 7835 7939 7978
Loss 176 38 435 335 450 306
% loss Feb to Aug 2% 0% 5% 4% 5% 4%
*Includes 28 Very Remote schools. List of schools provided by the education department at
http://www.teaching.nt.gov.au/remote/ but names of the 28 Very Remote schools is not available at
this website.
2. 75 remote & very remote schools - effective enrolment (raw enrolment by average attendance) and
insufficient attendance
2009 2010 2011 2012 2013 Average
February Effective Enrolments 75
Remote Schools 5602 4876 5290 4926 5064 5171
August Effective Enrolments 75
Remote Schools 4673 4210 4170 4093 3834 4197
Loss 930 665 1120 833 1230 974
% loss Feb to Aug 17% 14% 21% 17% 24% 19%
Attending <90% in Aug 2574 3050 2875 2882 3234 2840
Attending <90% as % Aug enr 32.0% 37.4% 36.3% 36.8% 40.7% 35.6%
Attending <90% in Feb 1751 2433 2173 2359 2424 2174
Attending <90% as % Feb enr 20.9% 29.6% 26.5% 28.3% 29.7% 25.9%
3. 74 non-remote schools – raw enrolment
2009 2010 2011 2012 2013 Average
February Enrolments 74
Non-remote Schools 25204 24577 24637 25479 25042 25023
August Enrolments 74 Non-
remote Schools* 25520 24765 25010 25352 24922 25114
Loss -316 -188 -373 127 120 -91
% loss Feb to Aug -1.25% -0.76% -1.51% 0.50% 0.48% -0.36%
4. 74 non-remote schools - effective enrolment (raw enrolment by average attendance) and insufficient
attendance
2009 2010 2011 2012 2013 Average
February Enrolments 74 Non-
remote Schools 22375 21867 22212 22837 22353 22350
August Enrolments 74 Non-
remote Schools* 21994 21352 21875 21979 21621 21764
Loss 381 515 337 858 732 585
% loss Feb to Aug 1.70% 2.35% 1.52% 3.76% 3.27% 2.62%
Attending <90% in Aug 1181 993 751 923 886 950
Attending <90% as % Aug enr 5% 4% 3% 4% 4% 4%
Attending <90% in Feb 456 496 456 475 492 474
Attending <90% as % Feb enr 1.8% 2.0% 1.9% 1.9% 2.0% 1.9%

More Related Content

What's hot

Direct admissions 2017 eng
Direct admissions 2017 engDirect admissions 2017 eng
Direct admissions 2017 eng
Indira Tolendiyeva
 
Waihi college's place in the world ncea analysis april 2016
Waihi college's place in the world ncea analysis april 2016Waihi college's place in the world ncea analysis april 2016
Waihi college's place in the world ncea analysis april 2016
WaihiCollege
 
Causes of Financial Model Errors
Causes of Financial Model ErrorsCauses of Financial Model Errors
Causes of Financial Model Errors
Excel
 
Extended Day Kindergarten
Extended Day KindergartenExtended Day Kindergarten
Extended Day Kindergartenmroe
 
Foundation admissions 2017_eng(2)
Foundation admissions 2017_eng(2)Foundation admissions 2017_eng(2)
Foundation admissions 2017_eng(2)
Indira Tolendiyeva
 
ESIC UDC 2022 Best Courses and Study Materials at BYJU'S Exam Prep
ESIC UDC 2022 Best Courses and Study Materials at BYJU'S Exam PrepESIC UDC 2022 Best Courses and Study Materials at BYJU'S Exam Prep
ESIC UDC 2022 Best Courses and Study Materials at BYJU'S Exam Prep
KanakChauhan5
 
Graduate admissions statistics eng(1)
Graduate admissions statistics eng(1)Graduate admissions statistics eng(1)
Graduate admissions statistics eng(1)
Indira Tolendiyeva
 
Enrollment Verification Letter (1)
Enrollment Verification Letter (1)Enrollment Verification Letter (1)
Enrollment Verification Letter (1)George Givens
 
Direct admissions 2016 eng
Direct admissions 2016 engDirect admissions 2016 eng
Direct admissions 2016 eng
Indira Tolendiyeva
 
001 direct admissions 2016 eng
001 direct admissions 2016 eng001 direct admissions 2016 eng
001 direct admissions 2016 eng
Indira Tolendiyeva
 
Ldsb april 8 delegation
Ldsb april 8 delegationLdsb april 8 delegation
Ldsb april 8 delegation
savekingstoncityschools
 

What's hot (11)

Direct admissions 2017 eng
Direct admissions 2017 engDirect admissions 2017 eng
Direct admissions 2017 eng
 
Waihi college's place in the world ncea analysis april 2016
Waihi college's place in the world ncea analysis april 2016Waihi college's place in the world ncea analysis april 2016
Waihi college's place in the world ncea analysis april 2016
 
Causes of Financial Model Errors
Causes of Financial Model ErrorsCauses of Financial Model Errors
Causes of Financial Model Errors
 
Extended Day Kindergarten
Extended Day KindergartenExtended Day Kindergarten
Extended Day Kindergarten
 
Foundation admissions 2017_eng(2)
Foundation admissions 2017_eng(2)Foundation admissions 2017_eng(2)
Foundation admissions 2017_eng(2)
 
ESIC UDC 2022 Best Courses and Study Materials at BYJU'S Exam Prep
ESIC UDC 2022 Best Courses and Study Materials at BYJU'S Exam PrepESIC UDC 2022 Best Courses and Study Materials at BYJU'S Exam Prep
ESIC UDC 2022 Best Courses and Study Materials at BYJU'S Exam Prep
 
Graduate admissions statistics eng(1)
Graduate admissions statistics eng(1)Graduate admissions statistics eng(1)
Graduate admissions statistics eng(1)
 
Enrollment Verification Letter (1)
Enrollment Verification Letter (1)Enrollment Verification Letter (1)
Enrollment Verification Letter (1)
 
Direct admissions 2016 eng
Direct admissions 2016 engDirect admissions 2016 eng
Direct admissions 2016 eng
 
001 direct admissions 2016 eng
001 direct admissions 2016 eng001 direct admissions 2016 eng
001 direct admissions 2016 eng
 
Ldsb april 8 delegation
Ldsb april 8 delegationLdsb april 8 delegation
Ldsb april 8 delegation
 

Similar to Raw enrolment

Nansiakan National High School: School Report Card
Nansiakan National High School: School Report Card Nansiakan National High School: School Report Card
Nansiakan National High School: School Report Card
Myrna Castaneda
 
First Quarter SMEA ppt.pptx
First Quarter SMEA ppt.pptxFirst Quarter SMEA ppt.pptx
First Quarter SMEA ppt.pptx
francosabayton699
 
Attendance Presentation-short version
Attendance Presentation-short versionAttendance Presentation-short version
Attendance Presentation-short versionGeorgia Wing
 
An Introduction to Online Course Development for Engaged Learning at UO
An Introduction to Online Course Development for Engaged Learning at UOAn Introduction to Online Course Development for Engaged Learning at UO
An Introduction to Online Course Development for Engaged Learning at UO
UOInTRO
 
3rd quarter SMEA.pptx
3rd quarter SMEA.pptx3rd quarter SMEA.pptx
3rd quarter SMEA.pptx
EmmieGGarbosa
 
accomplishmnet 20223 for the Year 2.pptx
accomplishmnet 20223 for the Year 2.pptxaccomplishmnet 20223 for the Year 2.pptx
accomplishmnet 20223 for the Year 2.pptx
cdsapalaran
 
Winnetka District36 Academic Data (june2014)
Winnetka District36 Academic Data (june2014)Winnetka District36 Academic Data (june2014)
Winnetka District36 Academic Data (june2014)justthefactswinnetka
 
SAMPLE-TEMPLATE-OPENING-OF-CLASSES.pptx
SAMPLE-TEMPLATE-OPENING-OF-CLASSES.pptxSAMPLE-TEMPLATE-OPENING-OF-CLASSES.pptx
SAMPLE-TEMPLATE-OPENING-OF-CLASSES.pptx
MangudadatuNHSRegist
 
School Monitoring Evaluation and Adjustment (SMEA).pptx
School Monitoring Evaluation and Adjustment (SMEA).pptxSchool Monitoring Evaluation and Adjustment (SMEA).pptx
School Monitoring Evaluation and Adjustment (SMEA).pptx
ABEJOYISARAN
 
JNHS-SMEA-S.Y.-2020-2021-Presentation.pptx
JNHS-SMEA-S.Y.-2020-2021-Presentation.pptxJNHS-SMEA-S.Y.-2020-2021-Presentation.pptx
JNHS-SMEA-S.Y.-2020-2021-Presentation.pptx
JoAnnKatherineValled2
 
Pillar 2.pptx
Pillar 2.pptxPillar 2.pptx
Pillar 2.pptx
JevyRoseMolino1
 
School report card src 2020 2021
School report card src 2020 2021School report card src 2020 2021
School report card src 2020 2021
Ma. Loiel Salome Nabelon
 
Seizing the agenda | Being data-informed and measuring what we value
Seizing the agenda | Being data-informed and measuring what we valueSeizing the agenda | Being data-informed and measuring what we value
Seizing the agenda | Being data-informed and measuring what we value
Wholeeducation
 
"School Closures" Survey Results
"School Closures" Survey Results"School Closures" Survey Results
"School Closures" Survey Results
School Improvement Network
 
LSCES_SCHOOL REPORT CARD_2021-2022.pdf
LSCES_SCHOOL REPORT CARD_2021-2022.pdfLSCES_SCHOOL REPORT CARD_2021-2022.pdf
LSCES_SCHOOL REPORT CARD_2021-2022.pdf
KRISTINECALIXTON4
 
Src 2016 binmaley sof
Src 2016   binmaley sofSrc 2016   binmaley sof
Src 2016 binmaley sof
casilang
 
Driving Academic Acceleration: ELA & Math Gap Analysis
Driving Academic Acceleration: ELA & Math Gap AnalysisDriving Academic Acceleration: ELA & Math Gap Analysis
Driving Academic Acceleration: ELA & Math Gap Analysis
Houghton Mifflin Harcourt
 
Chronic-Absence-Background-Spring-2014.pptx
Chronic-Absence-Background-Spring-2014.pptxChronic-Absence-Background-Spring-2014.pptx
Chronic-Absence-Background-Spring-2014.pptx
VeronicaAbellar1
 

Similar to Raw enrolment (20)

Nansiakan National High School: School Report Card
Nansiakan National High School: School Report Card Nansiakan National High School: School Report Card
Nansiakan National High School: School Report Card
 
First Quarter SMEA ppt.pptx
First Quarter SMEA ppt.pptxFirst Quarter SMEA ppt.pptx
First Quarter SMEA ppt.pptx
 
Attendance Presentation-short version
Attendance Presentation-short versionAttendance Presentation-short version
Attendance Presentation-short version
 
An Introduction to Online Course Development for Engaged Learning at UO
An Introduction to Online Course Development for Engaged Learning at UOAn Introduction to Online Course Development for Engaged Learning at UO
An Introduction to Online Course Development for Engaged Learning at UO
 
3rd quarter SMEA.pptx
3rd quarter SMEA.pptx3rd quarter SMEA.pptx
3rd quarter SMEA.pptx
 
accomplishmnet 20223 for the Year 2.pptx
accomplishmnet 20223 for the Year 2.pptxaccomplishmnet 20223 for the Year 2.pptx
accomplishmnet 20223 for the Year 2.pptx
 
Winnetka District36 Academic Data (june2014)
Winnetka District36 Academic Data (june2014)Winnetka District36 Academic Data (june2014)
Winnetka District36 Academic Data (june2014)
 
SAMPLE-TEMPLATE-OPENING-OF-CLASSES.pptx
SAMPLE-TEMPLATE-OPENING-OF-CLASSES.pptxSAMPLE-TEMPLATE-OPENING-OF-CLASSES.pptx
SAMPLE-TEMPLATE-OPENING-OF-CLASSES.pptx
 
School Monitoring Evaluation and Adjustment (SMEA).pptx
School Monitoring Evaluation and Adjustment (SMEA).pptxSchool Monitoring Evaluation and Adjustment (SMEA).pptx
School Monitoring Evaluation and Adjustment (SMEA).pptx
 
JNHS-SMEA-S.Y.-2020-2021-Presentation.pptx
JNHS-SMEA-S.Y.-2020-2021-Presentation.pptxJNHS-SMEA-S.Y.-2020-2021-Presentation.pptx
JNHS-SMEA-S.Y.-2020-2021-Presentation.pptx
 
Pillar 2.pptx
Pillar 2.pptxPillar 2.pptx
Pillar 2.pptx
 
School report card src 2020 2021
School report card src 2020 2021School report card src 2020 2021
School report card src 2020 2021
 
Seizing the agenda | Being data-informed and measuring what we value
Seizing the agenda | Being data-informed and measuring what we valueSeizing the agenda | Being data-informed and measuring what we value
Seizing the agenda | Being data-informed and measuring what we value
 
"School Closures" Survey Results
"School Closures" Survey Results"School Closures" Survey Results
"School Closures" Survey Results
 
LSCES_SCHOOL REPORT CARD_2021-2022.pdf
LSCES_SCHOOL REPORT CARD_2021-2022.pdfLSCES_SCHOOL REPORT CARD_2021-2022.pdf
LSCES_SCHOOL REPORT CARD_2021-2022.pdf
 
Web 2.0
Web 2.0Web 2.0
Web 2.0
 
Src 2016 binmaley sof
Src 2016   binmaley sofSrc 2016   binmaley sof
Src 2016 binmaley sof
 
School report card 2013 Kenya
School report card  2013  KenyaSchool report card  2013  Kenya
School report card 2013 Kenya
 
Driving Academic Acceleration: ELA & Math Gap Analysis
Driving Academic Acceleration: ELA & Math Gap AnalysisDriving Academic Acceleration: ELA & Math Gap Analysis
Driving Academic Acceleration: ELA & Math Gap Analysis
 
Chronic-Absence-Background-Spring-2014.pptx
Chronic-Absence-Background-Spring-2014.pptxChronic-Absence-Background-Spring-2014.pptx
Chronic-Absence-Background-Spring-2014.pptx
 

Raw enrolment

  • 1. 23/3/14 Mr Davies, Your response to my concerns about remote students struggling to get back to school at the end of July is contradicted by the evidence of the E & A tables on the department’s website. There are 75 remote schools, but information on the department website does not name the 28 schools you refer to as very remote. As a consequence I have analysed all 75 schools, but I have not identified the sub-group of “very remote” you refer to. You claim a fall in remote school enrolments from February to August of 1.3%. You claim the figure is higher for “very remote” schools. My figure for all 75 remote schools, including the very remote schools, is 4%, and is based on years 2009 to 2013. In non-remote schools there is a gain in enrolment from February to August (2009 to 2013) of 91, which is .36% of the 25,023 non-remote school enrolments. The percentage of remote students attending less than 90% is much worse for August than for February. 26% of remote students are attending less than 90% in February; but in August this problem is much worse as indicated by a rise in students attending less than 90% of 661, with the total number of poor attenders reaching 36% of August enrolments. Compare this to non-remote schools which have 2% of students attending less than 90% in February, and 4% in August. I contend it is important the department target August in E & A initiatives and strategies. I provide the following four tables for your convenience. Murray Waycott
  • 2. 1. 75 remote & very remote schools - raw enrolment 2009 2010 2011 2012 2013 Average February Enrolments 75 Remote Schools* 8220 8193 8348 8170 8389 8284 August Enrolments 75 Remote Schools 8044 8155 7913 7835 7939 7978 Loss 176 38 435 335 450 306 % loss Feb to Aug 2% 0% 5% 4% 5% 4% *Includes 28 Very Remote schools. List of schools provided by the education department at http://www.teaching.nt.gov.au/remote/ but names of the 28 Very Remote schools is not available at this website. 2. 75 remote & very remote schools - effective enrolment (raw enrolment by average attendance) and insufficient attendance 2009 2010 2011 2012 2013 Average February Effective Enrolments 75 Remote Schools 5602 4876 5290 4926 5064 5171 August Effective Enrolments 75 Remote Schools 4673 4210 4170 4093 3834 4197 Loss 930 665 1120 833 1230 974 % loss Feb to Aug 17% 14% 21% 17% 24% 19% Attending <90% in Aug 2574 3050 2875 2882 3234 2840 Attending <90% as % Aug enr 32.0% 37.4% 36.3% 36.8% 40.7% 35.6% Attending <90% in Feb 1751 2433 2173 2359 2424 2174 Attending <90% as % Feb enr 20.9% 29.6% 26.5% 28.3% 29.7% 25.9%
  • 3. 3. 74 non-remote schools – raw enrolment 2009 2010 2011 2012 2013 Average February Enrolments 74 Non-remote Schools 25204 24577 24637 25479 25042 25023 August Enrolments 74 Non- remote Schools* 25520 24765 25010 25352 24922 25114 Loss -316 -188 -373 127 120 -91 % loss Feb to Aug -1.25% -0.76% -1.51% 0.50% 0.48% -0.36% 4. 74 non-remote schools - effective enrolment (raw enrolment by average attendance) and insufficient attendance 2009 2010 2011 2012 2013 Average February Enrolments 74 Non- remote Schools 22375 21867 22212 22837 22353 22350 August Enrolments 74 Non- remote Schools* 21994 21352 21875 21979 21621 21764 Loss 381 515 337 858 732 585 % loss Feb to Aug 1.70% 2.35% 1.52% 3.76% 3.27% 2.62% Attending <90% in Aug 1181 993 751 923 886 950 Attending <90% as % Aug enr 5% 4% 3% 4% 4% 4% Attending <90% in Feb 456 496 456 475 492 474 Attending <90% as % Feb enr 1.8% 2.0% 1.9% 1.9% 2.0% 1.9%