1. Roadway Departure – A Priority Emphasis Area for Illinois Strategic Highway Safety Plan
Priscilla Tobias, PE and Mouyid Islam, PhD
Illinois Department of Transportation and CH2M HIILL, Inc.
Introduction
Problem Statement
Session 728: Recent Research, Best Practices, and Implementation of Zero Death Goals and Plans, P15-6623 – D04
As per FHWA, RD crashes are non-intersection related
crashes resulting from –
crossing the center-line,
edge-line, and
leaving the traveled way.
RD crashes account for about 50% ~ 53% of total fatal
crashes resulting in 53% of total fatalities (2,518) and 33%
of total A-injuries (20,679). (IDOT crash extracts: 2008-
2012).
Objectives
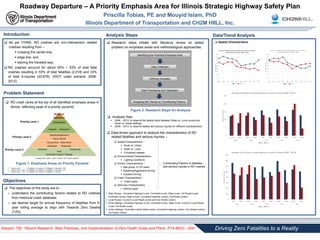
Analysis Steps Data/Trend Analysis
The objectives of this study are to –
o understand the contributing factors related to RD crashes
from historical crash database,
o set desired target for annual frequency of fatalities from 5-
year rolling average to align with Towards Zero Deaths
(TZD).
Data Collection
Data Processing and Integration
Identifying the Potential Emphasis Area
Defining Variables
Analyzing the Trends on Contributing Factors
Research steps initiate with literature review on stated
problem on emphasis areas and methodological approaches.
Figure 2: Research Steps for Analysis
Roadway
Departure
Unrestrained
Impaired Intersection
Speeding/Aggressive
Heavy Vehicle
Young Driver Older Driver
Pedestrian Motorcycle
Workzone Pedalcyclist
Train
Distracted/ Drowsy/ Fatigued
Priority Level 1
Priority Level 2
Priority Level 3
Priority Level 1: % Fatalities | % A-injuries | % (Fatalities + A-injuries) ≥ 30%
Priority Level 2: 30% > % Fatalities | % A-injuries | % (Fatalities + A-injuries) ≥ 10%
Priority Level 3: 10% > % Fatalities | % A-injuries | % (Fatalities + A-injuries)
Analysis Year: 2003 – 2012, Source: IDOT Crash Extracts
RD crash ranks at the top of all identified emphasis areas in
Illinois, reflecting peak of a priority pyramid.
Figure 1: Emphasis Areas on Priority Pyramid
0
50
100
150
200
250
Rural Urban Rural Urban Rural Urban Rural Urban Rural Urban
2009 2010 2011 2012 2013
NumberofFatalities
Number of Fatalities in Road Departure Crashes in Illinois (2009 - 2013)
Local State
0
200
400
600
800
1000
1200
1400
1600
Rural Urban Rural Urban Rural Urban Rural Urban Rural Urban
2009 2010 2011 2012 2013
NumberofA-Injuries
Number of A-Injuries in Road Departure Crashes in Illinois (2009 - 2013)
Local State
Analysis Year:
2004 – 2013: to observe the fatality trend between State vs. Local routes and
Rural vs. Urban settings.
2009 – 2013: to observe fatality and serious injuries for different characteristics
0
50
100
150
200
250
300
350
400
450
2004 2005 2006 2007 2008 2009 2010 2011 2012 2013
NumberofFatalities
Number of Fatalities in Road Departure Crashes in Rural and
Urban Settings in Illinois (2004 - 2013)
Rural Urban
0
50
100
150
200
250
300
350
400
450
2004 2005 2006 2007 2008 2009 2010 2011 2012 2013
NumberofFatalities
Number of Fatalities in Road Departure Crashes in State and
Local Routes in Illinois (2004 - 2013)
State Local
State Routes: Unmarked Highway (rural), Controlled (rural), State (rural), Toll Roads (rural),
Controlled (urban) State (urban), Unmarked Highway (urban), Toll Roads (urban)
Local Routes: County & Local Roads (rural) and City Streets (urban)
Rural Settings: Unmarked Highway (rural), Controlled (rural), State (rural), County & Local Roads
(rural), Toll Roads (rural)
Urban Settings: Controlled (urban) State (urban), Unmarked Highway (urban), City Streets (urban),
Toll Roads (urban)
Spatial Characteristics –
Rural vs. Urban
State vs. Local
Functional classes
Environmental Characteristics –
Lighting conditions
Drivers’ Characteristics –
Age group: 21-25 years
Speeding/Aggressive driving
Impaired driving
Crash Characteristics –
Crash types
Vehicular Characteristics
Vehicle types
Contributing Factors to fatalities
and serious injuries in RD crashes
Data-driven approach to analyze the characteristics of RD
related fatalities and serious injuries –
Spatial Characteristics
Driving Zero Fatalities to a Reality
2. Data/Trend Analysis
Contact: Priscilla.Tobias@illinois.gov, Mouyid.Islam@ch2m.com
Figure 3: Performance Measure Goal – Road Departure Fatalities
Conclusions
This study is exploratory in nature – data-driven approach.
This study offers an approach to analyze crashes resulting in fatalities
and serious injuries to understand the contributing factors to devise
preventive countermeasures.
Possible countermeasures to address the issues of RD crashes
include – high friction pavement, safety edge, cable median barrier,
centerline and shoulder rumble strips and focus on systemic
application of improvements to reduce RD crashes.
Priscilla Tobias, PE and Mouyid Islam, PhD
Illinois Department of Transportation and CH2M HIILL, Inc.
Roadway Departure – A Priority Emphasis Area for Illinois Strategic Highway Safety Plan
0
50
100
150
200
FixedObject
HeadOn
Overturned
SideswipeOpposite…
FixedObject
HeadOn
Overturned
SideswipeOpposite…
FixedObject
HeadOn
Overturned
SideswipeOpposite…
FixedObject
HeadOn
Overturned
SideswipeOpposite…
FixedObject
HeadOn
Overturned
SideswipeOpposite…
2009 2010 2011 2012 2013
NumberofFatalities
Number of Fatalities by Collision Types in Road Departure Crashes in
Illinois (2009 - 2013)
Rural Urban
0
400
800
1200
1600
FixedObject
HeadOn
Overturned
SideswipeOpposite…
FixedObject
HeadOn
Overturned
SideswipeOpposite…
FixedObject
HeadOn
Overturned
SideswipeOpposite…
FixedObject
HeadOn
Overturned
SideswipeOpposite…
FixedObject
HeadOn
Overturned
SideswipeOpposite…
2009 2010 2011 2012 2013
NumberofA-Injuries
Number of A-Injuries by Collision Types in Road Departure Crashes in
Illinois (2009 - 2013)
Rural Urban
0
50
100
150
200
250
2009 2010 2011 2012 2013
NumberofFatalities
Number of Fatalities by Impaired Driving in Road Departure Crashes
in Illinois (2009 - 2013)
Rural Urban
0
200
400
600
800
2009 2010 2011 2012 2013
NumberofA-Injuries
Number of A-Injuries by Impaired Driving in Road Departure Crashes in
Illinois (2009 - 2013)
Rural Urban
0
20
40
60
80
100
120
2009 2010 2011 2012 2013
NumberofFatalities
Number of Fatalities by Aggressive Driving in Road Departure Crashes
in Illinois (2009 - 2013)
Rural Urban
0
100
200
300
400
500
600
2009 2010 2011 2012 2013
NumberofA-Injuries
Number of A-Injuries by Aggressive Driving in Road Departure Crashes
in Illinois (2009 - 2013)
Rural Urban
0
10
20
30
40
50
60
70
2009 2010 2011 2012 2013
NumberofFatalities
Number of Young Driver Fatalities (21-25 yrs) in Road Departure Crashes in
Illinois (2009 - 2013)
Rural Urban
0
100
200
300
400
500
2009 2010 2011 2012 2013
NumberofA-Injuries
Number of Young Driver A-Injuries (21-25 yrs) in Road Departure
Crashes in Illinois (2009 - 2013)
Rural Urban
Performance Goal Setting
Drivers’ Characteristics
Environmental Characteristics Crash Characteristics
Vehicle Characteristics
0
40
80
120
160
200
Darkness
DarkbutLighted
Dawn
Daylight
Dusk
Darkness
DarkbutLighted
Dawn
Daylight
Dusk
Darkness
DarkbutLighted
Dawn
Daylight
Dusk
Darkness
Darkness,Lighted
Dawn
Daylight
Dusk
Darkness
DarkbutLighted
Dawn
Daylight
Dusk
2009 2010 2011 2012 2013
NumberofFatalities
Number of Fatalities in Road Departure Crashes in Lighting Conditions
in Illinois (2009 - 2013)
Rural Urban
0
400
800
1200
1600
Darkness
DarkbutLighted
Dawn
Daylight
Dusk
Darkness
DarkbutLighted
Dawn
Daylight
Dusk
Darkness
DarkbutLighted
Dawn
Daylight
Dusk
Darkness
Darkness,Lighted
Dawn
Daylight
Dusk
Darkness
DarkbutLighted
Dawn
Daylight
Dusk
2009 2010 2011 2012 2013
NumberofA-Injuries
Number of A-Injuries in Road Departure Crashes in Lighting Conditions in
Illinois (2009 - 2013)
Rural Urban
0
20
40
60
80
100
Interstate
FreewayandExpressway
OtherPrincipalArterial
MinorArterial
MajorCollector
MinorCollector
LocalRoadorStreet
Interstate
FreewayandExpressway
OtherPrincipalArterial
MinorArterial
MajorCollector
MinorCollector
LocalRoadorStreet
Interstate
FreewayandExpressway
OtherPrincipalArterial
MinorArterial
MajorCollector
MinorCollector
LocalRoadorStreet
Interstate
FreewayandExpressway
OtherPrincipalArterial
MinorArterial
MajorCollector
MinorCollector
LocalRoadorStreet
Interstate
FreewayandExpressway
OtherPrincipalArterial
MinorArterial
MajorCollector
MinorCollector
LocalRoadorStreet
2009 2010 2011 2012 2013
NumberofFatalities
Number of Fatalities by Functional Classes in Road Departure Crashes in
Illinois (2009 - 2013)
Rural Urban
0
200
400
600
800
Interstate
FreewayandExpressway
OtherPrincipalArterial
MinorArterial
MajorCollector
MinorCollector
LocalRoadorStreet
Interstate
FreewayandExpressway
OtherPrincipalArterial
MinorArterial
MajorCollector
MinorCollector
LocalRoadorStreet
Interstate
FreewayandExpressway
OtherPrincipalArterial
MinorArterial
MajorCollector
MinorCollector
LocalRoadorStreet
Interstate
FreewayandExpressway
OtherPrincipalArterial
MinorArterial
MajorCollector
MinorCollector
LocalRoadorStreet
Interstate
FreewayandExpressway
OtherPrincipalArterial
MinorArterial
MajorCollector
MinorCollector
LocalRoadorStreet
2009 2010 2011 2012 2013
NumberofA-Injuries
Number of A-Injuries by Functional Classes in Road Departure Crashes in Illinois
(2009 - 2013)
Rural Urban
741
698 701 710
696
582
474 485 481
496
535
709
677
633
589
544
504
494
0
100
200
300
400
500
600
700
800
2003
2004
2005
2006
2007
2008
2009
2010
2011
2012
2013
2014
2015
2016
2017
2018
2019
2020
2021
2022
2023
2024
2025
2026
2027
2028
2029
2030
NumberofFatalities
Road Departure Fatalities in Illinois for Performance Measure Goal – Desired Target
Fatalities 5-yr Rolling Average 5-yr Rolling Average - Desired Target
Desired Target: Average of 5-year Rolling Average of Fatalities
0
500
1000
1500
2000
2500
3000
2009 2010 2011 2012 2013
NumberofVehiclesInvolved
Number of Vehicles Involved in Road Departure Fatal and A-injury Crashes in Illinois (2009 - 2013)
Passenger Car Pickup SUV Motor Cycle* Van/Mini-Van Large Truck^ Other^^ Bus**
Motor Cycle: [Motor-driven cycle, Motor Cycle (>150 CC), ATV, Snowmobile]; Large Truck: [Tractor with semi-trailer, Tractor without Semi-Trailer, Single Unit Truck, Other Vehicle with
Trailer]; Bus: [Bus upto 15 passenger, Bus over 15 passenger]; Other: [Farm Equipment, Other]
Driving Zero Fatalities to a Reality
![Data/Trend Analysis
Contact: Priscilla.Tobias@illinois.gov, Mouyid.Islam@ch2m.com
Figure 3: Performance Measure Goal – Road Departure Fatalities
Conclusions
This study is exploratory in nature – data-driven approach.
This study offers an approach to analyze crashes resulting in fatalities
and serious injuries to understand the contributing factors to devise
preventive countermeasures.
Possible countermeasures to address the issues of RD crashes
include – high friction pavement, safety edge, cable median barrier,
centerline and shoulder rumble strips and focus on systemic
application of improvements to reduce RD crashes.
Priscilla Tobias, PE and Mouyid Islam, PhD
Illinois Department of Transportation and CH2M HIILL, Inc.
Roadway Departure – A Priority Emphasis Area for Illinois Strategic Highway Safety Plan
0
50
100
150
200
FixedObject
HeadOn
Overturned
SideswipeOpposite…
FixedObject
HeadOn
Overturned
SideswipeOpposite…
FixedObject
HeadOn
Overturned
SideswipeOpposite…
FixedObject
HeadOn
Overturned
SideswipeOpposite…
FixedObject
HeadOn
Overturned
SideswipeOpposite…
2009 2010 2011 2012 2013
NumberofFatalities
Number of Fatalities by Collision Types in Road Departure Crashes in
Illinois (2009 - 2013)
Rural Urban
0
400
800
1200
1600
FixedObject
HeadOn
Overturned
SideswipeOpposite…
FixedObject
HeadOn
Overturned
SideswipeOpposite…
FixedObject
HeadOn
Overturned
SideswipeOpposite…
FixedObject
HeadOn
Overturned
SideswipeOpposite…
FixedObject
HeadOn
Overturned
SideswipeOpposite…
2009 2010 2011 2012 2013
NumberofA-Injuries
Number of A-Injuries by Collision Types in Road Departure Crashes in
Illinois (2009 - 2013)
Rural Urban
0
50
100
150
200
250
2009 2010 2011 2012 2013
NumberofFatalities
Number of Fatalities by Impaired Driving in Road Departure Crashes
in Illinois (2009 - 2013)
Rural Urban
0
200
400
600
800
2009 2010 2011 2012 2013
NumberofA-Injuries
Number of A-Injuries by Impaired Driving in Road Departure Crashes in
Illinois (2009 - 2013)
Rural Urban
0
20
40
60
80
100
120
2009 2010 2011 2012 2013
NumberofFatalities
Number of Fatalities by Aggressive Driving in Road Departure Crashes
in Illinois (2009 - 2013)
Rural Urban
0
100
200
300
400
500
600
2009 2010 2011 2012 2013
NumberofA-Injuries
Number of A-Injuries by Aggressive Driving in Road Departure Crashes
in Illinois (2009 - 2013)
Rural Urban
0
10
20
30
40
50
60
70
2009 2010 2011 2012 2013
NumberofFatalities
Number of Young Driver Fatalities (21-25 yrs) in Road Departure Crashes in
Illinois (2009 - 2013)
Rural Urban
0
100
200
300
400
500
2009 2010 2011 2012 2013
NumberofA-Injuries
Number of Young Driver A-Injuries (21-25 yrs) in Road Departure
Crashes in Illinois (2009 - 2013)
Rural Urban
Performance Goal Setting
Drivers’ Characteristics
Environmental Characteristics Crash Characteristics
Vehicle Characteristics
0
40
80
120
160
200
Darkness
DarkbutLighted
Dawn
Daylight
Dusk
Darkness
DarkbutLighted
Dawn
Daylight
Dusk
Darkness
DarkbutLighted
Dawn
Daylight
Dusk
Darkness
Darkness,Lighted
Dawn
Daylight
Dusk
Darkness
DarkbutLighted
Dawn
Daylight
Dusk
2009 2010 2011 2012 2013
NumberofFatalities
Number of Fatalities in Road Departure Crashes in Lighting Conditions
in Illinois (2009 - 2013)
Rural Urban
0
400
800
1200
1600
Darkness
DarkbutLighted
Dawn
Daylight
Dusk
Darkness
DarkbutLighted
Dawn
Daylight
Dusk
Darkness
DarkbutLighted
Dawn
Daylight
Dusk
Darkness
Darkness,Lighted
Dawn
Daylight
Dusk
Darkness
DarkbutLighted
Dawn
Daylight
Dusk
2009 2010 2011 2012 2013
NumberofA-Injuries
Number of A-Injuries in Road Departure Crashes in Lighting Conditions in
Illinois (2009 - 2013)
Rural Urban
0
20
40
60
80
100
Interstate
FreewayandExpressway
OtherPrincipalArterial
MinorArterial
MajorCollector
MinorCollector
LocalRoadorStreet
Interstate
FreewayandExpressway
OtherPrincipalArterial
MinorArterial
MajorCollector
MinorCollector
LocalRoadorStreet
Interstate
FreewayandExpressway
OtherPrincipalArterial
MinorArterial
MajorCollector
MinorCollector
LocalRoadorStreet
Interstate
FreewayandExpressway
OtherPrincipalArterial
MinorArterial
MajorCollector
MinorCollector
LocalRoadorStreet
Interstate
FreewayandExpressway
OtherPrincipalArterial
MinorArterial
MajorCollector
MinorCollector
LocalRoadorStreet
2009 2010 2011 2012 2013
NumberofFatalities
Number of Fatalities by Functional Classes in Road Departure Crashes in
Illinois (2009 - 2013)
Rural Urban
0
200
400
600
800
Interstate
FreewayandExpressway
OtherPrincipalArterial
MinorArterial
MajorCollector
MinorCollector
LocalRoadorStreet
Interstate
FreewayandExpressway
OtherPrincipalArterial
MinorArterial
MajorCollector
MinorCollector
LocalRoadorStreet
Interstate
FreewayandExpressway
OtherPrincipalArterial
MinorArterial
MajorCollector
MinorCollector
LocalRoadorStreet
Interstate
FreewayandExpressway
OtherPrincipalArterial
MinorArterial
MajorCollector
MinorCollector
LocalRoadorStreet
Interstate
FreewayandExpressway
OtherPrincipalArterial
MinorArterial
MajorCollector
MinorCollector
LocalRoadorStreet
2009 2010 2011 2012 2013
NumberofA-Injuries
Number of A-Injuries by Functional Classes in Road Departure Crashes in Illinois
(2009 - 2013)
Rural Urban
741
698 701 710
696
582
474 485 481
496
535
709
677
633
589
544
504
494
0
100
200
300
400
500
600
700
800
2003
2004
2005
2006
2007
2008
2009
2010
2011
2012
2013
2014
2015
2016
2017
2018
2019
2020
2021
2022
2023
2024
2025
2026
2027
2028
2029
2030
NumberofFatalities
Road Departure Fatalities in Illinois for Performance Measure Goal – Desired Target
Fatalities 5-yr Rolling Average 5-yr Rolling Average - Desired Target
Desired Target: Average of 5-year Rolling Average of Fatalities
0
500
1000
1500
2000
2500
3000
2009 2010 2011 2012 2013
NumberofVehiclesInvolved
Number of Vehicles Involved in Road Departure Fatal and A-injury Crashes in Illinois (2009 - 2013)
Passenger Car Pickup SUV Motor Cycle* Van/Mini-Van Large Truck^ Other^^ Bus**
Motor Cycle: [Motor-driven cycle, Motor Cycle (>150 CC), ATV, Snowmobile]; Large Truck: [Tractor with semi-trailer, Tractor without Semi-Trailer, Single Unit Truck, Other Vehicle with
Trailer]; Bus: [Bus upto 15 passenger, Bus over 15 passenger]; Other: [Farm Equipment, Other]
Driving Zero Fatalities to a Reality](data:image/gif;base64,R0lGODlhAQABAIAAAAAAAP///yH5BAEAAAAALAAAAAABAAEAAAIBRAA7)