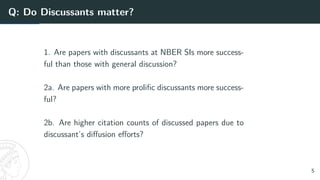
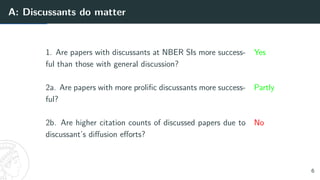
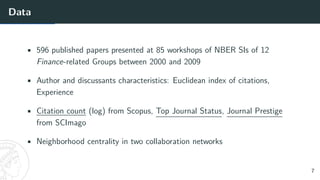
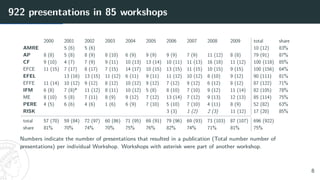
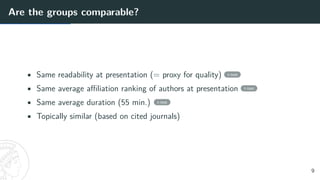
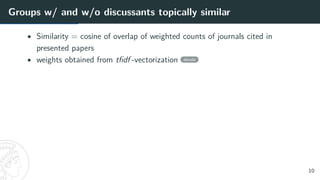
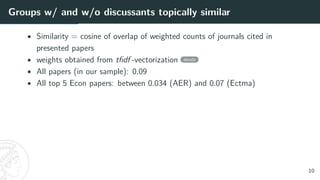
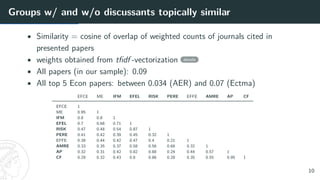
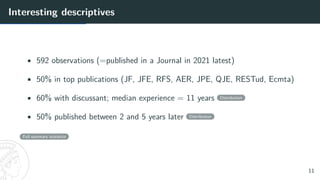
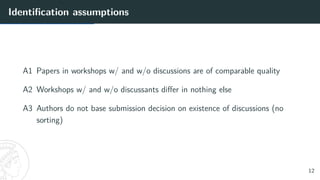
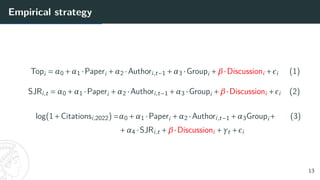
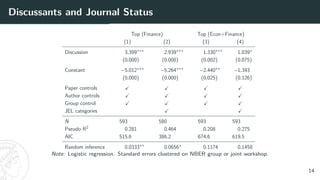
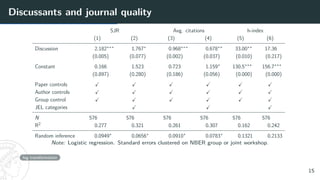
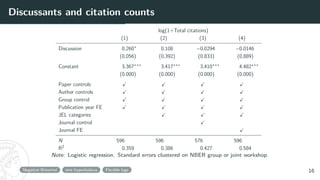
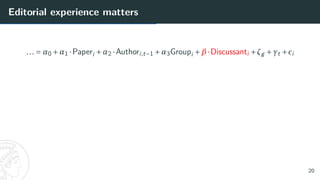
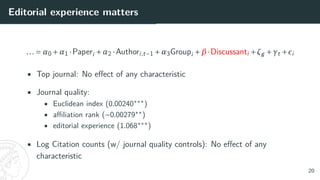
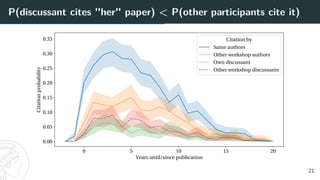
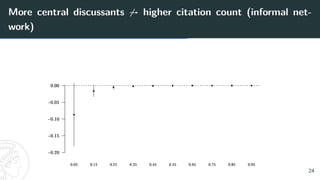
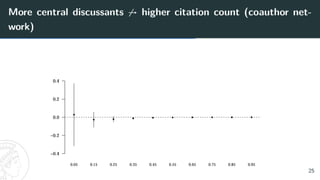
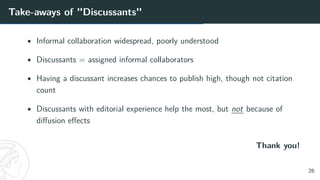
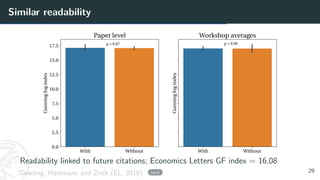
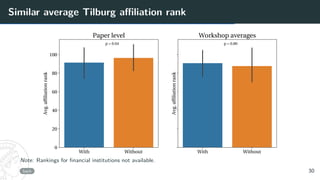
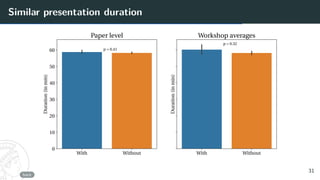
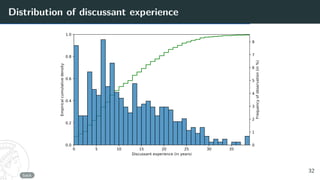
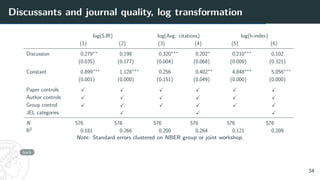
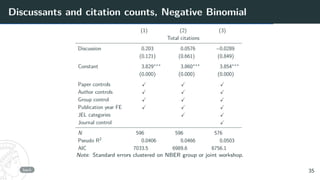
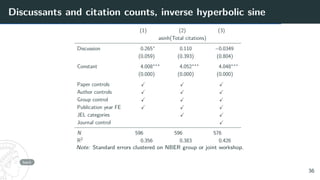
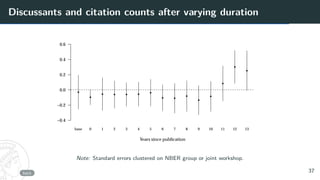
Discussants
Michael E. Rose1 Daniel C. Opolot2 Co-Pierre Georg2
1Max Planck Institute for Innovation and Competition, Munich, Germany
2University of Cape Town, Cape Town, South Africa
1
Science is a social endeavor
• Working with co-authors the norm in science Wuchty et al. (Science 2007);
Chung et al. (QREF, 2009); Ductor (OBES, 2015)
• There is also informal collaboration Laband and Tollison (JPE, 2002)
• Editors
• Referees
• Doctoral Advisers
• Colleagues everywhere
2
Science is a social endeavor
• Working with co-authors the norm in science Wuchty et al. (Science 2007);
Chung et al. (QREF, 2009); Ductor (OBES, 2015)
• There is also informal collaboration Laband and Tollison (JPE, 2002)
• Editors
• Referees
• Doctoral Advisers
• Colleagues everywhere
=⇒ Is informal collaboration part of the academic production function?
2
Studies on academic collaboration and "paper" as a unit
formal informal
person Azoulay, Graff Zivin and
Wang (QJE, 2010)
Oettl (MS, 2012)
paper Ductor (OBES, 2015) Laband and Tollison (JPE,
2002) (aggregate counts only,
no causal attempt)
3
Laboratory: Discussants at NBER Summer Institutes
• Annual, highly prestigious workshop series
• Workshops organized by groups and programs
V Some workshops always have discussants, the others never do
• Focus on Finance for topical homogeneity
4
Q: Do Discussants matter?
1. Are papers with discussants at NBER SIs more success-
ful than those with general discussion?
2a. Are papers with more prolific discussants more success-
ful?
2b. Are higher citation counts of discussed papers due to
discussant’s diffusion efforts?
5
A: Discussants do matter
1. Are papers with discussants at NBER SIs more success-
ful than those with general discussion?
Yes
2a. Are papers with more prolific discussants more success-
ful?
Partly
2b. Are higher citation counts of discussed papers due to
discussant’s diffusion efforts?
No
6
Data
• 596 published papers presented at 85 workshops of NBER SIs of 12
Finance-related Groups between 2000 and 2009
• Author and discussants characteristics: Euclidean index of citations,
Experience
• Citation count (log) from Scopus, Top Journal Status, Journal Prestige
from SCImago
• Neighborhood centrality in two collaboration networks
7
922 presentations in 85 workshops
2000 2001 2002 2003 2004 2005 2006 2007 2008 2009 total share
AMRE 5 (6) 5 (6) 10 (12) 83%
AP 8 (8) 5 (8) 8 (9) 8 (10) 6 (9) 9 (9) 9 (9) 7 (9) 11 (12) 8 (8) 79 (91) 87%
CF 9 (10) 4 (7) 7 (9) 9 (11) 10 (13) 13 (14) 10 (11) 11 (13) 16 (18) 11 (12) 100 (118) 85%
EFCE 11 (15) 7 (17) 8 (17) 7 (15) 14 (17) 10 (15) 13 (15) 11 (15) 10 (15) 9 (15) 100 (156) 64%
EFEL 13 (16) 13 (15) 11 (12) 6 (11) 9 (11) 11 (12) 10 (12) 8 (10) 9 (12) 90 (111) 81%
EFFE 11 (14) 10 (12) 9 (12) 8 (12) 10 (12) 9 (12) 7 (12) 9 (12) 6 (12) 8 (12) 87 (122) 71%
IFM 6 (8) 7 (8)* 11 (12) 8 (11) 10 (12) 5 (8) 8 (10) 7 (10) 9 (12) 11 (14) 82 (105) 78%
ME 8 (10) 5 (8) 7 (11) 8 (9) 9 (12) 7 (12) 13 (14) 7 (12) 9 (13) 12 (13) 85 (114) 75%
PERE 4 (5) 6 (6) 4 (6) 1 (6) 6 (9) 7 (10) 5 (10) 7 (10) 4 (11) 8 (9) 52 (82) 63%
RISK 3 (3) 1 (2) 2 (3) 11 (12) 17 (20) 85%
total 57 (70) 59 (84) 72 (97) 60 (86) 71 (95) 69 (91) 79 (96) 69 (93) 73 (103) 87 (107) 696 (922)
share 81% 70% 74% 70% 75% 76% 82% 74% 71% 81% 75%
Numbers indicate the number of presentations that resulted in a publication (Total number number of
presentations) per individual Workshop. Workshops with asterisk were part of another workshop.
8
Are the groups comparable?
• Same readability at presentation (= proxy for quality) t-test
• Same average affiliation ranking of authors at presentation t-test
• Same average duration (55 min.) t-test
• Topically similar (based on cited journals)
9
Groups w/ and w/o discussants topically similar
• Similarity = cosine of overlap of weighted counts of journals cited in
presented papers
• weights obtained from tfidf -vectorization details
10
Groups w/ and w/o discussants topically similar
• Similarity = cosine of overlap of weighted counts of journals cited in
presented papers
• weights obtained from tfidf -vectorization details
• All papers (in our sample): 0.09
• All top 5 Econ papers: between 0.034 (AER) and 0.07 (Ectma)
10
Groups w/ and w/o discussants topically similar
• Similarity = cosine of overlap of weighted counts of journals cited in
presented papers
• weights obtained from tfidf -vectorization details
• All papers (in our sample): 0.09
• All top 5 Econ papers: between 0.034 (AER) and 0.07 (Ectma)
EFCE ME IFM EFEL RISK PERE EFFE AMRE AP CF
EFCE 1
ME 0.95 1
IFM 0.8 0.8 1
EFEL 0.7 0.68 0.71 1
RISK 0.47 0.48 0.54 0.87 1
PERE 0.41 0.42 0.39 0.45 0.32 1
EFFE 0.39 0.44 0.42 0.47 0.4 0.21 1
AMRE 0.33 0.35 0.37 0.58 0.56 0.68 0.32 1
AP 0.32 0.31 0.42 0.82 0.88 0.24 0.44 0.57 1
CF 0.29 0.32 0.43 0.8 0.86 0.28 0.35 0.55 0.95 1
10
1. Are papers with discussants at NBER SIs more successful
than those with general discussion?
10
Interesting descriptives
• 592 observations (=published in a Journal in 2021 latest)
• 50% in top publications (JF, JFE, RFS, AER, JPE, QJE, RESTud, Ecmta)
• 60% with discussant; median experience = 11 years Distribution
• 50% published between 2 and 5 years later Distribution
Full summary statistics
11
Identification assumptions
A1 Papers in workshops w/ and w/o discussions are of comparable quality
A2 Workshops w/ and w/o discussants differ in nothing else
A3 Authors do not base submission decision on existence of discussions (no
sorting)
12
Empirical strategy
Topi = α0 +α1 ·Paperi +α2 ·Authori,t−1 +α3 ·Groupi +β·Discussioni +²i (1)
SJRi,t = α0 +α1 ·Paperi +α2 ·Authori,t−1 +α3 ·Groupi +β·Discussioni +²i (2)
log(1+Citationsi,2022) =α0 +α1 ·Paperi +α2 ·Authori,t−1 +α3Groupi+ (3)
+α4 ·SJRi,t +β·Discussioni +γt +²i
13
Discussants and Journal Status
Top (Finance) Top (Econ+Finance)
(1) (2) (3) (4)
Discussion 3.399∗∗∗
2.939∗∗∗
1.330∗∗∗
1.039∗
(0.000) (0.000) (0.002) (0.075)
Constant −5.012∗∗∗
−5.264∗∗∗
−2.440∗∗
−1.393
(0.000) (0.000) (0.025) (0.126)
Paper controls X X X X
Author controls X X X X
Group control X X X X
JEL categories X X
N 593 580 593 593
Pseudo R2 0.281 0.464 0.208 0.275
AIC 515.6 386.2 674.6 619.5
Random inference 0.0333∗∗
0.0656∗
0.1174 0.1458
Note: Logistic regression. Standard errors clustered on NBER group or joint workshop.
14
Discussants and journal quality
SJR Avg. citations h-index
(1) (2) (3) (4) (5) (6)
Discussion 2.182∗∗∗
1.767∗
0.968∗∗∗
0.678∗∗
33.00∗∗
17.36
(0.005) (0.077) (0.002) (0.037) (0.010) (0.217)
Constant 0.166 1.523 0.723 1.159∗
130.5∗∗∗
156.7∗∗∗
(0.897) (0.280) (0.186) (0.056) (0.000) (0.000)
Paper controls X X X X X X
Author controls X X X X X X
Group control X X X X X X
JEL categories X X X
N 576 576 576 576 576 576
R2 0.277 0.321 0.261 0.307 0.162 0.242
Random inference 0.0949∗
0.0656∗
0.0910∗
0.0783∗
0.1321 0.2133
Note: Logistic regression. Standard errors clustered on NBER group or joint workshop.
log transformation
15
Discussants and citation counts
log(1+Total citations)
(1) (2) (3) (4)
Discussion 0.260∗
0.108 −0.0294 −0.0146
(0.056) (0.392) (0.833) (0.889)
Constant 3.367∗∗∗
3.417∗∗∗
3.410∗∗∗
4.482∗∗∗
(0.000) (0.000) (0.000) (0.000)
Paper controls X X X X
Author controls X X X X
Group control X X X X
Publication year FE X X X X
JEL categories X X X
Journal control X
Journal FE X
N 596 596 576 596
R2 0.359 0.386 0.427 0.584
Note: Logistic regression. Standard errors clustered on NBER group or joint workshop.
Negative Binomial sine hyperbolicus Flexible lags 16
Recap
• Discussants help bring the paper to better journal on average
• . . . but papers not better cited on average given the journal quality
⇒ Papers get published where they belong
Next: What drives this?
17
2b. Are higher citation counts of discussed papers due to
discussant’s diffusion efforts?
2b. Are higher citation counts of discussed papers due to
discussant’s diffusion efforts?
17
Identification assumptions
A4 Authors do not decide/suggest their discussants
A5 Workshop organizers assign discussants primarily by topical fit
A6 No sorting by discussants
Survey results Ass. matching on seniority Ass. matching on characteristics Ass. matching on centrality
18
Discussants characteristics
Probe 350 papers with known discussants
• Euclidean index of citations in year of discussion
• Experience
• Gender (via genderize.io)
• Affiliation rank
• Practitioner (central bank, law firm, government)
• Editorial experience (obtained from CVs)
in year of discussion
19
Editorial experience matters
... = α0 +α1 ·Paperi +α2 ·Authori,t−1 +α3Groupi +β·Discussanti +ζg +γt +²i
20
Editorial experience matters
... = α0 +α1 ·Paperi +α2 ·Authori,t−1 +α3Groupi +β·Discussanti +ζg +γt +²i
• Top journal: No effect of any characteristic
• Journal quality:
• Euclidean index (0.00240∗∗∗
)
• affiliation rank (−0.00279∗∗
)
• editorial experience (1.068∗∗∗
)
• Log Citation counts (w/ journal quality controls): No effect of any
characteristic
20
P(discussant cites "her" paper) < P(other participants cite it)
0 5 10 15 20
Yearsuntil/sincepublication
0.00
0.05
0.10
0.15
0.20
0.25
0.30
0.35
Citation
probability Citationby
Sameauthors
Otherworkshopauthors
Owndiscussant
Otherworkshopdiscussants
21
Neighborhood Centrality
What’s the number of all neighbors of a researcher i within a given radius τ,
while discounting for distance with given information quality filter δ?
Neighborhoodi(δ) =
∞
X
τ=1
δτ−1
kiτ
→ Measures ability to spread information
22
Neighborhood centrality in two networks
• Formal network linking authors on a paper in 370 Economics journalsa
• Informal network (CoFE) linking authors and acknowledged commenters on
papers from 6 Finance journalsb Rose and Georg (RP 2021)
aJournals ranked at least C by Combes and Linnemer (2010) in the following categories:
General Economics, C, D, E, F, G, H, K, and R
bJF, RFS, JFE, JFI, JMCB, JBF
23
Neighborhood centrality in two networks
• Formal network linking authors on a paper in 370 Economics journalsa
• Informal network (CoFE) linking authors and acknowledged commenters on
papers from 6 Finance journalsb Rose and Georg (RP 2021)
• Papers from 2000-2011, network in t uses publications from t −1,t,t +1
aJournals ranked at least C by Combes and Linnemer (2010) in the following categories:
General Economics, C, D, E, F, G, H, K, and R
bJF, RFS, JFE, JFI, JMCB, JBF
23
More central discussants 6→ higher citation count (informal net-
work)
−0.20
−0.15
−0.10
−0.05
0.00
0.05 0.15 0.25 0.35 0.45 0.55 0.65 0.75 0.85 0.95
●
●
●
● ● ● ● ● ● ●
24
More central discussants 6→ higher citation count (coauthor net-
work)
−0.4
−0.2
0.0
0.2
0.4
0.05 0.15 0.25 0.35 0.45 0.55 0.65 0.75 0.85 0.95
●
● ● ● ● ● ● ● ● ●
25
Take-aways of "Discussants"
• Informal collaboration widespread, poorly understood
• Discussants = assigned informal collaborators
• Having a discussant increases chances to publish high, though not citation
count
• Discussants with editorial experience help the most, but not because of
diffusion effects
Thank you!
26
Appendix
26
Summary statistics of Journal sample
N Mean Median Std.Dev. Min Max
Total citations 596 170.50 93.00 263.80 0.00 3418.00
Top publication 596 0.51 1.00 0.50 0.00 1.00
SJR 576 8.09 6.89 5.14 0.16 22.54
# of pages 596 29.62 29.50 11.56 5.00 87.00
# of authors 596 2.18 2.00 0.80 1.00 5.00
Age 596 3.52 3.00 2.05 −1.00 14.00
Author total Euclid 596 431.96 212.83 710.20 0.00 8311.96
Youngest author experience 596 6.89 5.00 6.68 0.00 54.00
Oldest author experience 596 15.14 14.00 9.76 0.00 54.00
Discussion 596 0.63 1.00 0.48 0.00 1.00
27
Summary statistics of Journal sample
N Mean Median Std.Dev. Min Max
Total citations 596 170.50 93.00 263.80 0.00 3418.00
Top publication 596 0.51 1.00 0.50 0.00 1.00
SJR 576 8.09 6.89 5.14 0.16 22.54
# of pages 596 29.62 29.50 11.56 5.00 87.00
# of authors 596 2.18 2.00 0.80 1.00 5.00
Age 596 3.52 3.00 2.05 −1.00 14.00
Author total Euclid 596 431.96 212.83 710.20 0.00 8311.96
Youngest author experience 596 6.89 5.00 6.68 0.00 54.00
Oldest author experience 596 15.14 14.00 9.76 0.00 54.00
Discussion 596 0.63 1.00 0.48 0.00 1.00
p
742 +182 +402 +742 +1802 = 213.8
back
27
Distribution of publication lag
0 2 4 6 8 10 12 14
Yearsuntilpublication
back
28
Similar readability
With Without
0.0
2.5
5.0
7.5
10.0
12.5
15.0
17.5
Gunning
fog
index p=0.87
Paperlevel
With Without
Gunning
fog
index
p=0.96
Workshopaverages
Readability linked to future citations; Economics Letters GF index = 16.08
Dowling, Hammami and Zreik (EL, 2018) back 29
Similar average Tilburg affiliation rank
With Without
0
20
40
60
80
100
Avg.
affiliation
rank p=0.64
Paperlevel
With Without
Avg.
affiliation
rank
p=0.80
Workshopaverages
Note: Rankings for financial institutions not available.
back 30
Similar presentation duration
With Without
0
10
20
30
40
50
60
Duration
(in
min) p=0.41
Paperlevel
With Without
Duration
(in
min)
p=0.32
Workshopaverages
back
31
Distribution of discussant experience
0 5 10 15 20 25 30 35
Discussant experience (in years)
0.0
0.2
0.4
0.6
0.8
1.0
Empirical
cumulative
density
0
1
2
3
4
5
6
7
8
Frequency
of
observation
(in
%)
back
32
tfidf-vectorization to measure topical similarity
• Paper 1 cites journals A, B, C, D in entire period
• Paper 2 cites journals C, D, E, F
• Paper 3 cites journals C, F
33
tfidf-vectorization to measure topical similarity
• Paper 1 cites journals A, B, C, D in entire period
• Paper 2 cites journals C, D, E, F
• Paper 3 cites journals C, F











1 0 0
1 0 0
1 1 1
1 1 0
0 1 0
0 1 1











tfidf
−
−
−
−
−
−
−
−
→
vectorization











0.58 0 0
0.58 0 0
0.34 0.37 0.61
0.44 0.48 0
0 0.63 0
0 0.48 0.79











Cosine similarity between e.g. 1 and 2: 0.34
back
33
Discussants and journal quality, log transformation
log(SJR) log(Avg. citations) log(h-index)
(1) (2) (3) (4) (5) (6)
Discussion 0.279∗∗
0.198 0.320∗∗∗
0.202∗
0.210∗∗∗
0.102
(0.035) (0.177) (0.004) (0.068) (0.009) (0.321)
Constant 0.899∗∗∗
1.128∗∗∗
0.256 0.402∗∗
4.848∗∗∗
5.056∗∗∗
(0.001) (0.000) (0.151) (0.049) (0.000) (0.000)
Paper controls X X X X X X
Author controls X X X X X X
Group control X X X X X X
JEL categories X X X
N 576 576 576 576 576 576
R2 0.181 0.266 0.200 0.264 0.121 0.209
Note: Standard errors clustered on NBER group or joint workshop.
back
34
Discussants and citation counts, Negative Binomial
(1) (2) (3)
Total citations
Discussion 0.203 0.0576 −0.0289
(0.121) (0.661) (0.849)
Constant 3.829∗∗∗
3.860∗∗∗
3.854∗∗∗
(0.000) (0.000) (0.000)
Paper controls X X X
Author controls X X X
Group control X X X
Publication year FE X X X
JEL categories X X
Journal control X
N 596 596 576
Pseudo R2 0.0406 0.0466 0.0503
AIC 7033.5 6989.6 6756.1
Note: Standard errors clustered on NBER group or joint workshop.
back 35
Discussants and citation counts, inverse hyperbolic sine
(1) (2) (3)
asinh(Total citations)
Discussion 0.265∗
0.110 −0.0349
(0.059) (0.393) (0.804)
Constant 4.008∗∗∗
4.052∗∗∗
4.048∗∗∗
(0.000) (0.000) (0.000)
Paper controls X X X
Author controls X X X
Group control X X X
Publication year FE X X X
JEL categories X X
Journal control X
N 596 596 576
R2 0.356 0.383 0.426
Note: Standard errors clustered on NBER group or joint workshop.
back
36
Discussants and citation counts after varying duration
Years since publication
−0.4
−0.2
0.0
0.2
0.4
0.6
base 0 1 2 3 4 5 6 7 8 9 10 11 12 13
●
●
● ● ● ●
●
● ●
●
●
●
●
●
●
Note: Standard errors clustered on NBER group or joint workshop.
back 37
Workshop organizers look for topical fit and ability to present
Excerpts from 15 respondents responsible for 42 workshops:
• Discussants should form "a basis for a lively, productive debate between
authors, discussants, and audience."
• Discussants should not "too close to the author and if possible coming from
a different perspective"
• They should have "No fear of authors (i.e., probably don’t get a very junior
person to discuss a big shot, unless you know the junior person is fearless)."
• There are "often authors of good papers that were not chosen for
presentation" which qualify as discussant
back
38
Do senior authors get senior discussants?
0 5 10 15 20 25 30
Authors' mean experience
0
5
10
15
20
25
30
35
40
Discussant
experience
b = 0.13
= 0.11
0 10 20 30 40 50
Authors' max. experience
b = 0.14
= 0.096
AMRE
AP
CF
EFEL
IFM
PERE
RISK
back
39
No assortative matching with prolific discussants
Dis. experience Top-30 Univ. Dis. Euclid
neg. bin. logistic OLS
Author max. Euclid −0.00005 0.001 −0.054
(0.730) (0.172) (0.216)
Author max. experience 0.004 −0.023 −2.114
(0.590) (0.276) (0.330)
Author max. experience2 0.00004 0.0002 0.067∗∗∗
(0.588) (0.416) (0.004)
# of authors −0.031 0.220 −1.173
(0.556) (0.148) (0.943)
Discussion year FE X X
NBER group FE X X
N 441 401 441
Adjusted R2 0.206
Akaike Inf. Crit. 3,058.030 526.004
Note: Standard errors clustered on NBER group or joint workshop. Constant not reported.
back
40
No assortative matching with central discussants
Dis. neighborhood
coauthor informal
Author max. Euclid −0.004 −0.019
p = 0.703 p = 0.541
Author max. experience −0.282 −2.481
p = 0.539 p = 0.116
Author max. experience2 0.006 0.029∗
p = 0.194 p = 0.087
# of authors 4.141 15.607
p = 0.230 p = 0.188
Discussion year FE X X
NBER group FE X X
N 441 441
Adjusted R2 0.236 0.387
Note: Standard errors clustered on NBER group or joint workshop.
back
41

Discussants

  • 1.
    Discussants Michael E. Rose1Daniel C. Opolot2 Co-Pierre Georg2 1Max Planck Institute for Innovation and Competition, Munich, Germany 2University of Cape Town, Cape Town, South Africa 1
  • 2.
    Science is asocial endeavor • Working with co-authors the norm in science Wuchty et al. (Science 2007); Chung et al. (QREF, 2009); Ductor (OBES, 2015) • There is also informal collaboration Laband and Tollison (JPE, 2002) • Editors • Referees • Doctoral Advisers • Colleagues everywhere 2
  • 3.
    Science is asocial endeavor • Working with co-authors the norm in science Wuchty et al. (Science 2007); Chung et al. (QREF, 2009); Ductor (OBES, 2015) • There is also informal collaboration Laband and Tollison (JPE, 2002) • Editors • Referees • Doctoral Advisers • Colleagues everywhere =⇒ Is informal collaboration part of the academic production function? 2
  • 4.
    Studies on academiccollaboration and "paper" as a unit formal informal person Azoulay, Graff Zivin and Wang (QJE, 2010) Oettl (MS, 2012) paper Ductor (OBES, 2015) Laband and Tollison (JPE, 2002) (aggregate counts only, no causal attempt) 3
  • 5.
    Laboratory: Discussants atNBER Summer Institutes • Annual, highly prestigious workshop series • Workshops organized by groups and programs V Some workshops always have discussants, the others never do • Focus on Finance for topical homogeneity 4
  • 6.
    Q: Do Discussantsmatter? 1. Are papers with discussants at NBER SIs more success- ful than those with general discussion? 2a. Are papers with more prolific discussants more success- ful? 2b. Are higher citation counts of discussed papers due to discussant’s diffusion efforts? 5
  • 7.
    A: Discussants domatter 1. Are papers with discussants at NBER SIs more success- ful than those with general discussion? Yes 2a. Are papers with more prolific discussants more success- ful? Partly 2b. Are higher citation counts of discussed papers due to discussant’s diffusion efforts? No 6
  • 8.
    Data • 596 publishedpapers presented at 85 workshops of NBER SIs of 12 Finance-related Groups between 2000 and 2009 • Author and discussants characteristics: Euclidean index of citations, Experience • Citation count (log) from Scopus, Top Journal Status, Journal Prestige from SCImago • Neighborhood centrality in two collaboration networks 7
  • 9.
    922 presentations in85 workshops 2000 2001 2002 2003 2004 2005 2006 2007 2008 2009 total share AMRE 5 (6) 5 (6) 10 (12) 83% AP 8 (8) 5 (8) 8 (9) 8 (10) 6 (9) 9 (9) 9 (9) 7 (9) 11 (12) 8 (8) 79 (91) 87% CF 9 (10) 4 (7) 7 (9) 9 (11) 10 (13) 13 (14) 10 (11) 11 (13) 16 (18) 11 (12) 100 (118) 85% EFCE 11 (15) 7 (17) 8 (17) 7 (15) 14 (17) 10 (15) 13 (15) 11 (15) 10 (15) 9 (15) 100 (156) 64% EFEL 13 (16) 13 (15) 11 (12) 6 (11) 9 (11) 11 (12) 10 (12) 8 (10) 9 (12) 90 (111) 81% EFFE 11 (14) 10 (12) 9 (12) 8 (12) 10 (12) 9 (12) 7 (12) 9 (12) 6 (12) 8 (12) 87 (122) 71% IFM 6 (8) 7 (8)* 11 (12) 8 (11) 10 (12) 5 (8) 8 (10) 7 (10) 9 (12) 11 (14) 82 (105) 78% ME 8 (10) 5 (8) 7 (11) 8 (9) 9 (12) 7 (12) 13 (14) 7 (12) 9 (13) 12 (13) 85 (114) 75% PERE 4 (5) 6 (6) 4 (6) 1 (6) 6 (9) 7 (10) 5 (10) 7 (10) 4 (11) 8 (9) 52 (82) 63% RISK 3 (3) 1 (2) 2 (3) 11 (12) 17 (20) 85% total 57 (70) 59 (84) 72 (97) 60 (86) 71 (95) 69 (91) 79 (96) 69 (93) 73 (103) 87 (107) 696 (922) share 81% 70% 74% 70% 75% 76% 82% 74% 71% 81% 75% Numbers indicate the number of presentations that resulted in a publication (Total number number of presentations) per individual Workshop. Workshops with asterisk were part of another workshop. 8
  • 10.
    Are the groupscomparable? • Same readability at presentation (= proxy for quality) t-test • Same average affiliation ranking of authors at presentation t-test • Same average duration (55 min.) t-test • Topically similar (based on cited journals) 9
  • 11.
    Groups w/ andw/o discussants topically similar • Similarity = cosine of overlap of weighted counts of journals cited in presented papers • weights obtained from tfidf -vectorization details 10
  • 12.
    Groups w/ andw/o discussants topically similar • Similarity = cosine of overlap of weighted counts of journals cited in presented papers • weights obtained from tfidf -vectorization details • All papers (in our sample): 0.09 • All top 5 Econ papers: between 0.034 (AER) and 0.07 (Ectma) 10
  • 13.
    Groups w/ andw/o discussants topically similar • Similarity = cosine of overlap of weighted counts of journals cited in presented papers • weights obtained from tfidf -vectorization details • All papers (in our sample): 0.09 • All top 5 Econ papers: between 0.034 (AER) and 0.07 (Ectma) EFCE ME IFM EFEL RISK PERE EFFE AMRE AP CF EFCE 1 ME 0.95 1 IFM 0.8 0.8 1 EFEL 0.7 0.68 0.71 1 RISK 0.47 0.48 0.54 0.87 1 PERE 0.41 0.42 0.39 0.45 0.32 1 EFFE 0.39 0.44 0.42 0.47 0.4 0.21 1 AMRE 0.33 0.35 0.37 0.58 0.56 0.68 0.32 1 AP 0.32 0.31 0.42 0.82 0.88 0.24 0.44 0.57 1 CF 0.29 0.32 0.43 0.8 0.86 0.28 0.35 0.55 0.95 1 10
  • 14.
    1. Are paperswith discussants at NBER SIs more successful than those with general discussion? 10
  • 15.
    Interesting descriptives • 592observations (=published in a Journal in 2021 latest) • 50% in top publications (JF, JFE, RFS, AER, JPE, QJE, RESTud, Ecmta) • 60% with discussant; median experience = 11 years Distribution • 50% published between 2 and 5 years later Distribution Full summary statistics 11
  • 16.
    Identification assumptions A1 Papersin workshops w/ and w/o discussions are of comparable quality A2 Workshops w/ and w/o discussants differ in nothing else A3 Authors do not base submission decision on existence of discussions (no sorting) 12
  • 17.
    Empirical strategy Topi =α0 +α1 ·Paperi +α2 ·Authori,t−1 +α3 ·Groupi +β·Discussioni +²i (1) SJRi,t = α0 +α1 ·Paperi +α2 ·Authori,t−1 +α3 ·Groupi +β·Discussioni +²i (2) log(1+Citationsi,2022) =α0 +α1 ·Paperi +α2 ·Authori,t−1 +α3Groupi+ (3) +α4 ·SJRi,t +β·Discussioni +γt +²i 13
  • 18.
    Discussants and JournalStatus Top (Finance) Top (Econ+Finance) (1) (2) (3) (4) Discussion 3.399∗∗∗ 2.939∗∗∗ 1.330∗∗∗ 1.039∗ (0.000) (0.000) (0.002) (0.075) Constant −5.012∗∗∗ −5.264∗∗∗ −2.440∗∗ −1.393 (0.000) (0.000) (0.025) (0.126) Paper controls X X X X Author controls X X X X Group control X X X X JEL categories X X N 593 580 593 593 Pseudo R2 0.281 0.464 0.208 0.275 AIC 515.6 386.2 674.6 619.5 Random inference 0.0333∗∗ 0.0656∗ 0.1174 0.1458 Note: Logistic regression. Standard errors clustered on NBER group or joint workshop. 14
  • 19.
    Discussants and journalquality SJR Avg. citations h-index (1) (2) (3) (4) (5) (6) Discussion 2.182∗∗∗ 1.767∗ 0.968∗∗∗ 0.678∗∗ 33.00∗∗ 17.36 (0.005) (0.077) (0.002) (0.037) (0.010) (0.217) Constant 0.166 1.523 0.723 1.159∗ 130.5∗∗∗ 156.7∗∗∗ (0.897) (0.280) (0.186) (0.056) (0.000) (0.000) Paper controls X X X X X X Author controls X X X X X X Group control X X X X X X JEL categories X X X N 576 576 576 576 576 576 R2 0.277 0.321 0.261 0.307 0.162 0.242 Random inference 0.0949∗ 0.0656∗ 0.0910∗ 0.0783∗ 0.1321 0.2133 Note: Logistic regression. Standard errors clustered on NBER group or joint workshop. log transformation 15
  • 20.
    Discussants and citationcounts log(1+Total citations) (1) (2) (3) (4) Discussion 0.260∗ 0.108 −0.0294 −0.0146 (0.056) (0.392) (0.833) (0.889) Constant 3.367∗∗∗ 3.417∗∗∗ 3.410∗∗∗ 4.482∗∗∗ (0.000) (0.000) (0.000) (0.000) Paper controls X X X X Author controls X X X X Group control X X X X Publication year FE X X X X JEL categories X X X Journal control X Journal FE X N 596 596 576 596 R2 0.359 0.386 0.427 0.584 Note: Logistic regression. Standard errors clustered on NBER group or joint workshop. Negative Binomial sine hyperbolicus Flexible lags 16
  • 21.
    Recap • Discussants helpbring the paper to better journal on average • . . . but papers not better cited on average given the journal quality ⇒ Papers get published where they belong Next: What drives this? 17
  • 22.
    2b. Are highercitation counts of discussed papers due to discussant’s diffusion efforts? 2b. Are higher citation counts of discussed papers due to discussant’s diffusion efforts? 17
  • 23.
    Identification assumptions A4 Authorsdo not decide/suggest their discussants A5 Workshop organizers assign discussants primarily by topical fit A6 No sorting by discussants Survey results Ass. matching on seniority Ass. matching on characteristics Ass. matching on centrality 18
  • 24.
    Discussants characteristics Probe 350papers with known discussants • Euclidean index of citations in year of discussion • Experience • Gender (via genderize.io) • Affiliation rank • Practitioner (central bank, law firm, government) • Editorial experience (obtained from CVs) in year of discussion 19
  • 25.
    Editorial experience matters ...= α0 +α1 ·Paperi +α2 ·Authori,t−1 +α3Groupi +β·Discussanti +ζg +γt +²i 20
  • 26.
    Editorial experience matters ...= α0 +α1 ·Paperi +α2 ·Authori,t−1 +α3Groupi +β·Discussanti +ζg +γt +²i • Top journal: No effect of any characteristic • Journal quality: • Euclidean index (0.00240∗∗∗ ) • affiliation rank (−0.00279∗∗ ) • editorial experience (1.068∗∗∗ ) • Log Citation counts (w/ journal quality controls): No effect of any characteristic 20
  • 27.
    P(discussant cites "her"paper) < P(other participants cite it) 0 5 10 15 20 Yearsuntil/sincepublication 0.00 0.05 0.10 0.15 0.20 0.25 0.30 0.35 Citation probability Citationby Sameauthors Otherworkshopauthors Owndiscussant Otherworkshopdiscussants 21
  • 28.
    Neighborhood Centrality What’s thenumber of all neighbors of a researcher i within a given radius τ, while discounting for distance with given information quality filter δ? Neighborhoodi(δ) = ∞ X τ=1 δτ−1 kiτ → Measures ability to spread information 22
  • 29.
    Neighborhood centrality intwo networks • Formal network linking authors on a paper in 370 Economics journalsa • Informal network (CoFE) linking authors and acknowledged commenters on papers from 6 Finance journalsb Rose and Georg (RP 2021) aJournals ranked at least C by Combes and Linnemer (2010) in the following categories: General Economics, C, D, E, F, G, H, K, and R bJF, RFS, JFE, JFI, JMCB, JBF 23
  • 30.
    Neighborhood centrality intwo networks • Formal network linking authors on a paper in 370 Economics journalsa • Informal network (CoFE) linking authors and acknowledged commenters on papers from 6 Finance journalsb Rose and Georg (RP 2021) • Papers from 2000-2011, network in t uses publications from t −1,t,t +1 aJournals ranked at least C by Combes and Linnemer (2010) in the following categories: General Economics, C, D, E, F, G, H, K, and R bJF, RFS, JFE, JFI, JMCB, JBF 23
  • 31.
    More central discussants6→ higher citation count (informal net- work) −0.20 −0.15 −0.10 −0.05 0.00 0.05 0.15 0.25 0.35 0.45 0.55 0.65 0.75 0.85 0.95 ● ● ● ● ● ● ● ● ● ● 24
  • 32.
    More central discussants6→ higher citation count (coauthor net- work) −0.4 −0.2 0.0 0.2 0.4 0.05 0.15 0.25 0.35 0.45 0.55 0.65 0.75 0.85 0.95 ● ● ● ● ● ● ● ● ● ● 25
  • 33.
    Take-aways of "Discussants" •Informal collaboration widespread, poorly understood • Discussants = assigned informal collaborators • Having a discussant increases chances to publish high, though not citation count • Discussants with editorial experience help the most, but not because of diffusion effects Thank you! 26
  • 34.
  • 35.
    Summary statistics ofJournal sample N Mean Median Std.Dev. Min Max Total citations 596 170.50 93.00 263.80 0.00 3418.00 Top publication 596 0.51 1.00 0.50 0.00 1.00 SJR 576 8.09 6.89 5.14 0.16 22.54 # of pages 596 29.62 29.50 11.56 5.00 87.00 # of authors 596 2.18 2.00 0.80 1.00 5.00 Age 596 3.52 3.00 2.05 −1.00 14.00 Author total Euclid 596 431.96 212.83 710.20 0.00 8311.96 Youngest author experience 596 6.89 5.00 6.68 0.00 54.00 Oldest author experience 596 15.14 14.00 9.76 0.00 54.00 Discussion 596 0.63 1.00 0.48 0.00 1.00 27
  • 36.
    Summary statistics ofJournal sample N Mean Median Std.Dev. Min Max Total citations 596 170.50 93.00 263.80 0.00 3418.00 Top publication 596 0.51 1.00 0.50 0.00 1.00 SJR 576 8.09 6.89 5.14 0.16 22.54 # of pages 596 29.62 29.50 11.56 5.00 87.00 # of authors 596 2.18 2.00 0.80 1.00 5.00 Age 596 3.52 3.00 2.05 −1.00 14.00 Author total Euclid 596 431.96 212.83 710.20 0.00 8311.96 Youngest author experience 596 6.89 5.00 6.68 0.00 54.00 Oldest author experience 596 15.14 14.00 9.76 0.00 54.00 Discussion 596 0.63 1.00 0.48 0.00 1.00 p 742 +182 +402 +742 +1802 = 213.8 back 27
  • 37.
    Distribution of publicationlag 0 2 4 6 8 10 12 14 Yearsuntilpublication back 28
  • 38.
    Similar readability With Without 0.0 2.5 5.0 7.5 10.0 12.5 15.0 17.5 Gunning fog indexp=0.87 Paperlevel With Without Gunning fog index p=0.96 Workshopaverages Readability linked to future citations; Economics Letters GF index = 16.08 Dowling, Hammami and Zreik (EL, 2018) back 29
  • 39.
    Similar average Tilburgaffiliation rank With Without 0 20 40 60 80 100 Avg. affiliation rank p=0.64 Paperlevel With Without Avg. affiliation rank p=0.80 Workshopaverages Note: Rankings for financial institutions not available. back 30
  • 40.
    Similar presentation duration WithWithout 0 10 20 30 40 50 60 Duration (in min) p=0.41 Paperlevel With Without Duration (in min) p=0.32 Workshopaverages back 31
  • 41.
    Distribution of discussantexperience 0 5 10 15 20 25 30 35 Discussant experience (in years) 0.0 0.2 0.4 0.6 0.8 1.0 Empirical cumulative density 0 1 2 3 4 5 6 7 8 Frequency of observation (in %) back 32
  • 42.
    tfidf-vectorization to measuretopical similarity • Paper 1 cites journals A, B, C, D in entire period • Paper 2 cites journals C, D, E, F • Paper 3 cites journals C, F 33
  • 43.
    tfidf-vectorization to measuretopical similarity • Paper 1 cites journals A, B, C, D in entire period • Paper 2 cites journals C, D, E, F • Paper 3 cites journals C, F            1 0 0 1 0 0 1 1 1 1 1 0 0 1 0 0 1 1            tfidf − − − − − − − − → vectorization            0.58 0 0 0.58 0 0 0.34 0.37 0.61 0.44 0.48 0 0 0.63 0 0 0.48 0.79            33
  • 44.
    tfidf-vectorization to measuretopical similarity • Paper 1 cites journals A, B, C, D in entire period • Paper 2 cites journals C, D, E, F • Paper 3 cites journals C, F            1 0 0 1 0 0 1 1 1 1 1 0 0 1 0 0 1 1            tfidf − − − − − − − − → vectorization            0.58 0 0 0.58 0 0 0.34 0.37 0.61 0.44 0.48 0 0 0.63 0 0 0.48 0.79            Cosine similarity between e.g. 1 and 2: 0.34 back 33
  • 45.
    Discussants and journalquality, log transformation log(SJR) log(Avg. citations) log(h-index) (1) (2) (3) (4) (5) (6) Discussion 0.279∗∗ 0.198 0.320∗∗∗ 0.202∗ 0.210∗∗∗ 0.102 (0.035) (0.177) (0.004) (0.068) (0.009) (0.321) Constant 0.899∗∗∗ 1.128∗∗∗ 0.256 0.402∗∗ 4.848∗∗∗ 5.056∗∗∗ (0.001) (0.000) (0.151) (0.049) (0.000) (0.000) Paper controls X X X X X X Author controls X X X X X X Group control X X X X X X JEL categories X X X N 576 576 576 576 576 576 R2 0.181 0.266 0.200 0.264 0.121 0.209 Note: Standard errors clustered on NBER group or joint workshop. back 34
  • 46.
    Discussants and citationcounts, Negative Binomial (1) (2) (3) Total citations Discussion 0.203 0.0576 −0.0289 (0.121) (0.661) (0.849) Constant 3.829∗∗∗ 3.860∗∗∗ 3.854∗∗∗ (0.000) (0.000) (0.000) Paper controls X X X Author controls X X X Group control X X X Publication year FE X X X JEL categories X X Journal control X N 596 596 576 Pseudo R2 0.0406 0.0466 0.0503 AIC 7033.5 6989.6 6756.1 Note: Standard errors clustered on NBER group or joint workshop. back 35
  • 47.
    Discussants and citationcounts, inverse hyperbolic sine (1) (2) (3) asinh(Total citations) Discussion 0.265∗ 0.110 −0.0349 (0.059) (0.393) (0.804) Constant 4.008∗∗∗ 4.052∗∗∗ 4.048∗∗∗ (0.000) (0.000) (0.000) Paper controls X X X Author controls X X X Group control X X X Publication year FE X X X JEL categories X X Journal control X N 596 596 576 R2 0.356 0.383 0.426 Note: Standard errors clustered on NBER group or joint workshop. back 36
  • 48.
    Discussants and citationcounts after varying duration Years since publication −0.4 −0.2 0.0 0.2 0.4 0.6 base 0 1 2 3 4 5 6 7 8 9 10 11 12 13 ● ● ● ● ● ● ● ● ● ● ● ● ● ● ● Note: Standard errors clustered on NBER group or joint workshop. back 37
  • 49.
    Workshop organizers lookfor topical fit and ability to present Excerpts from 15 respondents responsible for 42 workshops: • Discussants should form "a basis for a lively, productive debate between authors, discussants, and audience." • Discussants should not "too close to the author and if possible coming from a different perspective" • They should have "No fear of authors (i.e., probably don’t get a very junior person to discuss a big shot, unless you know the junior person is fearless)." • There are "often authors of good papers that were not chosen for presentation" which qualify as discussant back 38
  • 50.
    Do senior authorsget senior discussants? 0 5 10 15 20 25 30 Authors' mean experience 0 5 10 15 20 25 30 35 40 Discussant experience b = 0.13 = 0.11 0 10 20 30 40 50 Authors' max. experience b = 0.14 = 0.096 AMRE AP CF EFEL IFM PERE RISK back 39
  • 51.
    No assortative matchingwith prolific discussants Dis. experience Top-30 Univ. Dis. Euclid neg. bin. logistic OLS Author max. Euclid −0.00005 0.001 −0.054 (0.730) (0.172) (0.216) Author max. experience 0.004 −0.023 −2.114 (0.590) (0.276) (0.330) Author max. experience2 0.00004 0.0002 0.067∗∗∗ (0.588) (0.416) (0.004) # of authors −0.031 0.220 −1.173 (0.556) (0.148) (0.943) Discussion year FE X X NBER group FE X X N 441 401 441 Adjusted R2 0.206 Akaike Inf. Crit. 3,058.030 526.004 Note: Standard errors clustered on NBER group or joint workshop. Constant not reported. back 40
  • 52.
    No assortative matchingwith central discussants Dis. neighborhood coauthor informal Author max. Euclid −0.004 −0.019 p = 0.703 p = 0.541 Author max. experience −0.282 −2.481 p = 0.539 p = 0.116 Author max. experience2 0.006 0.029∗ p = 0.194 p = 0.087 # of authors 4.141 15.607 p = 0.230 p = 0.188 Discussion year FE X X NBER group FE X X N 441 441 Adjusted R2 0.236 0.387 Note: Standard errors clustered on NBER group or joint workshop. back 41