GBI2016_Cantone
•
1 like•73 views

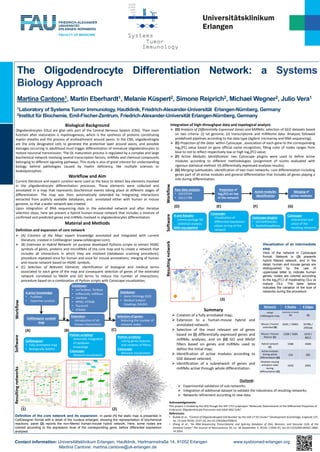
This document describes a study that used a systems biology approach to create a network model of the oligodendrocyte differentiation process. Researchers created an initial curated map and then expanded it into a human-mouse hybrid network by integrating interaction data from public databases. They filtered this network by selecting genes associated with oligodendrocyte differentiation based on expression data analysis and gene ontology terms. Researchers then identified active modules within the network and merged them to define subnetworks of genes and miRNAs involved in oligodendrocyte differentiation.

Recommended
More Related Content
What's hot
What's hot (20)
Similar to GBI2016_Cantone
Similar to GBI2016_Cantone (20)
GBI2016_Cantone
- 1. Contact information: Universitätsklinikum Erlangen, Hautklinik, Hartmannstraße 14, 91052 Erlangen www.sysbiomed-erlangen.org Martina Cantone: martina.cantone@uk-erlangen.de The Oligodendrocyte Differentiation Network: a Systems Biology Approach Martina Cantone1, Martin Eberhardt1, Melanie Küspert2, Simone Reiprich2, Michael Wegner2, Julio Vera1 1Laboratory of Systems Tumor Immunology, Hautklinik, Friedrich-Alexander-Universität Erlangen-Nürnberg, Germany 2Institut für Biochemie, Emil-Fischer-Zentrum, Friedrich-Alexander-Universität Erlangen-Nürnberg, Germany Biological Background Oligodendrocytes (OLs) are glial cells part of the Central Nervous System (CNS). Their main function after maturation is myelinogenesis, which is the synthesis of proteins constituting myelin sheaths and the process of ensheathment around axons. In the CNS, oligodendroglia are the only designated cells to generate the protective layer around axons, and possible damages occurring in adulthood must trigger differentiation of immature oligodendrocytes to restore neuronal transmission. The OL maturation process is regulated by a complex and large biochemical network involving several transcription factors, miRNAs and chemical compounds belonging to different signaling pathways. This study is also of great interest for understanding biology behind pathologies caused by myelin deficiency, like multiple sclerosis or leukodystrophies . Workflow and Aim Current literature and expert curation were used as the basis to detect key elements involved in the oligodendrocyte differentiation processes. These elements were collected and annotated in a map that represents biochemical events taking place at different stages of differentiation. The map was then automatically extended by integrating interactions extracted from publicly available databases, and annotated either with human or mouse genome, so that a wider network was created. Upon integration of RNA sequencing data in the extended network and after iterative selection steps, here we present a hybrid human-mouse network that includes a mixture of confirmed and predicted genes and miRNAs involved in oligodendrocytes differentiation. Material and Methods Definition and expansion of core network (A) Creation of the Map: expert knowledge annotated and integrated with current literature; created in CellDesigner (www.celldesigner.com); (B) Extension to Hybrid Network: on purpose developed Pythons scripts to extract HGNC symbols of genes, proteins and microRNAs of the core map and to create a network that includes all interactions in which they are involved (databases scanning procedure); procedure repeated once for human and once for mouse annotations; merging of human and mouse network based on HGNC symbols; (C) Selection of Relevant Elements: identification of biological and medical terms associated to each gene of the map and consequent selection of genes of the extended network correlated to MeSH and GO terms to reduce the number of interactions; procedure based on a combination of Python scripts with Cytoscape visualization; A priori knowledge: • PubMed • Expertise curation CellDesigner: • Fully annotated map • Biologically faithful (A) Extension: Introduction of all known interactions (B) CellDesigner curated map Databases: • mirTarBase; TarBase • miRecords; miRBase • starBase • HPRD; HTRIdb • TransmiR • STRING Python scripting: Automatic integration of database knowledge Cytoscape: Network visualization Selection of genes: Reducing the number of network nodes Python scripting: Listing genes features and creation of filters; Cytoscape: Network visualization SoftwareWorkflow Databases: • Gene Ontology (GO) • Medical Subject Headings (MeSH) (C) Resultingnetworks (1) Integration of high-throughput data and topological analysis (D) Analysis of Differentially Expressed Genes and MiRNAs: selection of GEO datasets based on two criteria: (i) rat genome; (ii) transcriptome and miRNome data. Analyses followed predefined pipelines according to the data type (Agilent microarray and RNA sequencing); (E) Projection of the Data: within Cytoscape , association of each gene to the corresponding log2(FC) value based on gene official name recognition; filling color of nodes ranges from blue to red to reflect respectively low or high log2(FC) value; (F) Active Modules Identification: two Cytoscape plugins were used to define active modules according to different methodologies (assignment of scores evaluated with rigorous statistical method VS differentially expressed analyses results); (G) Merging submodules: identification of two main networks: core differentiation including genes part of all active modules and general differentiation that includes all genes playing a role during differentiation. Raw data analysis: • GSE52564 • GSE21798 R and Rstudio: Limma package for statistical analysis RNA-seq pipeline SoftwareWorkflowResultingnetwork Acknowledgements: This project is funded by the DFG though the SPP 1757 subproject “Molecular Determinants of the Differential Properties of Embryonic Oligodendrocyte Precursors and Adult NG2 Cells”. References: • Budde et al., “Control of Oligodendroglial Cell Number by the miR-17-92 Cluster” Development (Cambridge, England) 137, no. 13 (July 2010): 2127–32, doi:10.1242/dev.050633; • Zhang et al., “An RNA-Sequencing Transcriptome and Splicing Database of Glia, Neurons, and Vascular Cells of the Cerebral Cortex” The Journal of Neuroscience 34, no. 36 (September 3, 2014): 11929–47, doi:10.1523/JNEUROSCI.1860- 14.2014. Projection of log2(FC) on top of the network (D) (E) Active modules identification Merging of active modules Cytoscape plugins: • jActiveModules • KeyPathwayMiner Cytoscape: Intersection and union of the resulting networks (F) (3) (G) (2) Cytoscape: Visualization of differential expression values on top of the network Visualization of an intermediate step. View of the network in Cytoscape format. Network in (3) presents hybrid filtered network, and in the detail, human and mouse genes are distinguished by the use of uppercase letter to indicate human genes; nodes are colored according to the log2(FC) of myelinating OLs vs mature OLs. The table below indicates the variation of the size of networks during the procedure. Summary Creation of a fully annotated map; Extension to a human-mouse hybrid and annotated network; Selection of the most relevant set of genes based on (i) differentially expressed genes and miRNAs analyses, and on (ii) GO and MeSH filters based on genes and miRNAs used to define the initial map; Identification of active modules according to GSE dataset selected; Identification of a subnetwork of genes and miRNAs active through whole differentiation. Network # Nodes # Edges Initial CellDesigner map (replicates included) 95 98 Mouse / Human extended (B) 6391 / 19461 32786 / 299346 Mouse / Human filtered (C) 1328 / 3365 1219 / 8812 Hybrid network (E) 1584 4340 Active modules during whole differentiation (G) 154 282 Modules varying activation state during differentiation (G) 1042 2691 Outlook: Experimental validation of sub-networks; Integration of additional dataset to validate the robustness of resulting networks; Networks refinement according to new data. Definition of the core network and its expansion. In panel (1) the static map is presented in CellDesigner format with a detail of the nucleus enlarged, showing the representation of biochemical reactions; panel (2) reports the non-filtered human-mouse hybrid network. Here, some nodes are colored according to the expression level of the corresponding gene, before differential expression analyses.