Soil Infiltration, Runoff, and ErosionSoil1. Soil is crucia.docx
2014 SCE Poster
1. Soil Compaction in Relation to Infiltration and Water Holding Capacity
A. Amick, University of Arizona, M. Childs, University of Arizona, W. Hardin, University of Arizona, and L. Stewart, Arizona State University
Background
The soils on this planet hold the nutrients that sustain
life. It is important to understand soil in order for future
generations to enjoy the same soils we do. That being
said, we chose to research soil infiltration, compaction
and water holding capacity of the soils that we encounter
every day. Flash floods are a prime example of this
scenario because they happen time after time during
Arizona’s monsoon season. Scientists by the name of
Olson, Gulliver, Nieber, and Kayhanian furthered our
interest by stating that, “the change typically increases
runoff during runoff events and consequently may add to
flooding”. By further studying the relationship between
water and soil, people may be able to determine whether
or not to plant, establish housing, or travel near certain
washes. If this is not determined then floods will destroy
root systems, homes, and high traffic areas. Does soil
compaction relate to water infiltration and water holding
capacity? Based on Yergeau and Obropta’s article
“Preliminary Field Evaluation of Soil Compaction in Rain
Gardens” soil texture was found to have an influence on
compaction levels. We believe that a more compact soil
will resist infiltration more better, but have a high water
holding capacity, whereas, a less compact soil will be
easily infiltrated and will have a decreased ability to hold
water.
Discussion
For this experiment, the data collection was not perfect. This is
reflective in the quality of the data recorded. Overall the data
shows that the infiltration increases and water holding capacity
decreases as compaction of soil decreases. However, when
recording this data a lot of minor incidents effected the data.
When site 1 was being infiltrated a large rock was inside the tube
and had blocked a lot of the water from infiltrating and prevented
accurate measurement. When site 2 was measured for infiltration
it went much too fast. After speaking with our instructor it is
thought that maybe the water was carried out faster by an
underground root system or perhaps a burrow of sorts. For site 6,
the saturation of the outer ring was not complete before the
inside ring was saturated. When the saturation was recorded it
was significantly worse. After speaking with our instructor it is
theorized that the water hit a compact layer underneath the soil
and prevented saturation. When it comes to compaction, site #2
was different than the other 2 forested areas when it comes to
compaction. This is theorized again because of some underground
system. The soil textures and their water holding capacity did not
follow the hypothesis fully as expected. This may be because the
soil texture was not classified correctly by the group, or because
the literature chart didn’t acknowledge all of the textures found.
Another problem is that of human reading error. When infiltration
was measured a meter stick was used to measure water loss. This
was read by each person differently, thus different results
occurred. Despite the errors in this experiment the data can be
used for real world application. If the procedures listed for this
experiment are follow in arid regions, it can be determined if it’s a
flood area or not. This will let people know where to plant species
of plant for repopulation or erosion control. A potential research
topic that could come from this is how much humans compact soil
and whether or not this contributes to flooding. So they could
measure what this group did, but compare wild soil, to soil in high
human traffic areas.
Research Methods
Before gathering data, our team selected six different sites
that encompass a range of soil compactions which were
ultimately determined by a Pickey-John Soil Compaction
Tester. We decided to incorporate testing sites in both
forested and meadow areas in order to have a definite
difference in compaction measures and the type of soil
and vegetation present. We began by situating an
infiltrometer set up that was manufactured with a 12 inch
in diameter stove pipe and a 5 inch in diameter PVC pipe,
according to the Globe protocol. This let us determine how
fast water infiltrated into the soil. A meter stick was used
to measure how far the water line decreased in three
minute intervals. After collecting the infiltration data, we
used an Adventech Soil Testing Sieve to sift through 4
centimeters of soil near each testing site to determine the
texture and color of each soil sample. This was done by
utilizing a Munsell Color Chart to classify the specific
chroma and hue of the sample and a USDA texture chart
for classification. After collecting our data, we analyzed it
in comparison to our original hypothesis.. Once done, we
received input from our instructor.
Acknowledgements
We would like to thank Diana Elder for her guidance throughout
our experiment and providing necessary equipment. Another
thank we would like to send out is to Katie Marascio who helped
manage our team and with Microsoft Excel. Lastly, thank you
Flagstaff Arboretum for the use of their grounds for research.
Bibliography:
Olson, N. C., Gulliver, J. S., Nieber, J. L., & Kayhanian, M. (2013). Remediation to improve infiltration into compact soils. Journal of environmental management, 117, 85-95.
Steven E. Yergeau and Christopher C. Obropta (2013). ”Preliminary Field Evaluation of Soil Compaction in Rain Gardens.” J. Environ. Eng., 139(9), 1233–1236.
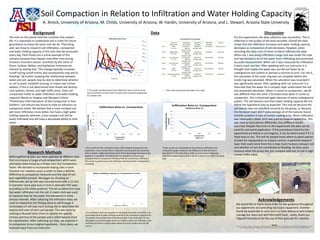
Soil Classifications and Averages
Color and
Classification
Coordinates
and Elevation
Compaction
Averages
Infiltration
Averages
Texture
Forest Site 1 Black
5 Yr 2.1/1
12 S 0433124
3891311
Elevation: 2169
200 lb/in^2
Average: 186.6
.53 cm/3mins Sandy Clay Loam
Site 2 Reddish Black
5 Yr 2.5/1
12 S 0433124
3891311
Elevation: 2169
150 lb/in^2
Average: 186.6
2 cm/3mins Sandy Clay
Site 3 Very Dark Gray
5 Yr 3/1
12 S 0433194
3891343
Elevation: 2171
260 lb/in^2
Average: 186.6
.35 cm/3mins Silty Clay
Meadow Site 4 Very Dark Gray
5 Yr 3/1
12 S 0433242
3891371
Elevation: 2159
210 lb/in^2
Average: 156.6
.85 cm/3mins Silty Clay
Site 5 Black
5 Yr 2.5/1
12 S 0433255
3891387
Elevation: 2170
110 lb/in^2
Average: 156.6
1.05 cm/3mins Silty Clay
Site 6 Dark Reddish Brown
5 Yr 3/2
12 S 0433267
3891379
Elevation: 2160
150 lb/in^2
Average: 156.6
.35 cm/3mins Loamy Sand
Data
• In correlation with our hypothesis, this graph illustrates that there is an
increasing trend of water holding capacity as the compaction gets denser.
The denser the soil the more theoretical water it can hold when it rains.
Although it can hold a larger amount of water, it does not infiltrate as fast
and there for there is excess water above the soil’s surface and run-off
occurs.
• Our results for this correlation were a little skewed compared to our
hypothesis. If you remove Site 2’s data (the second point) you would be
able to depict a slight decreasing trend. If the decreasing trend was more
apparent, it would be consistent with our hypothesis because we
proposed that as compaction increased the soil would resist infiltration.
This result is present since the infiltration rate decreased as compaction
increased.
• This graph visually presents the infiltration rates of all six of our
sites increments of every three minutes and its natural progression
to a slower rate.
These results are comparable to the previous infiltration and
compaction graph. However, the difference is that site two is
excluded from the data plot in order to show how it negatively
affected the data because there was an unseen error while recording
data.
• This chart summarizes the bulk of our data.