IRJET- Experimental Study on Pro-Green Intensive Roof System in an Instit...
Green Roof Poster
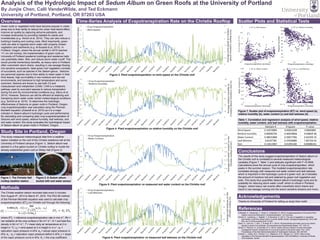
1. Overview Time-Series Analysis of Evapotranspiration Rate on the Christie Rooftop
Conclusions
Green roofs or vegetated roofs have become popular in urban
areas due to their ability to reduce the urban heat island effect,
improve air quality by capturing airborne pollutants, and
increase biodiversity by providing habitats for plants and
invertebrates (e.g. Versini et al. 2014). They can also reduce a
building’s heating and cooling costs. Most importantly, green
roofs are able to regulate storm water with properly chosen
vegetation and sediments (e.g. Al-Busaidi et al. 2013). In
Portland, Oregon, where the annual rainfall in 2015 reached
111 cm (44 inches), the implementation of green roofs on
University of Portland academic buildings and residence halls
can potentially retain, filter, and reduce storm water runoff. This
would provide tremendous benefits, as heavy rains in Portland
often overwhelm storm drains, resulting in raw sewage flowing
into sensitive ecosystems. Ideal green roof vegetation consists
of succulents, such as species in the Sedum genus. Sedums
are perennial species due to their ability to retain water in their
thick leaves, high survivability in low moisture and low soil
environments, and tolerance to high temperature and sunny
summers. Sedums are known to use both C3 and
crassulacean acid metabolism (CAM). CAM is a metabolic
pathway used by succulent species to reduce transpiration
during hot and dry environmental conditions (e.g. Starry et al.
2014). However, Sedums can still be efficient at retaining and
transpiring storm water under certain meteorological conditions
(e.g. Schroll et al. 2010). To determine the hydrologic
effectiveness of Sedums on green roofs in Portland, Oregon,
crop evapotranspiration was calculated using the Penman-
Monteith equation (Zotarelli et al. 2010) as it is a major
indicator in Sedum album’s hydrologic cycle and performance.
By calculating and comparing daily crop evapotranspiration of
Sedums with wind speed, relative humidity, leaf wetness, and
soil water content, this study evaluates the hydrological impact
of Sedum album on green roofs in Portland, Oregon.
Study Site in Portland, Oregon
Figure 3. Plant evapotranspiration vs wind speed on the Christie roof
The results of this study suggest evapotranspiration of Sedum album on
the Christie roof is correlated to several measured meteorological
variables (Figure 7, Table 1) and statically significant with P <0.0005.
Calculations show the annual cycle of crop evapotranspiration, which
peaks in the summer season. The modeled evapotranspiration rate
correlates strongly with measured soil water content and leaf wetness,
which is important in the hydrologic cycle of a green roof, as it indicates
the amount of moisture lost and retained by green roof vegetation and
soils. This study thus quantifies Sedum album’s hydrologic cycle and its
suitability for reducing storm water runoff, which is critical in Portland,
Oregon, where heavy rain events often overwhelm storm drains and
result in raw sewage running into the area’s sensitive streams and rivers.
Analysis of the Hydrologic Impact of Sedum Album on Green Roofs at the University of Portland
By Junjie Chen, Calli VanderWilde, and Ted Eckmann
University of Portland, Portland, OR 97203 USA
Scatter Plots and Statistical Tests
The Christe weather station recorded data every 5 minutes
from August 4th, 2014 to March 4th, 2016. The FAO-56 method
of the Penman-Monteith equation was used to calculate crop
evapotranspiration (ETC) on Christie roof through the following:
References
Al-Busaidi, A., Yamamoto, T., Tanak, S., & Moritani, S. (2013). Evapotranspiration of Succulent Plant
(Sedum aizoonvar.floibundum). Evapotranspiration - An Overview.
Schroll, E., Lambrinos, J., Righetti, T., & Sandrock, D. (2011). The role of vegetation in regulating
stormwater runoff from green roofs in a winter rainfall climate. Ecological Engineering, 37(4), 595-
600. doi:10.1016/j.ecoleng.2010.12.020
Starry, O., Lea-Cox, J., Kim, J., & Iersel, M. V. (2014). Photosynthesis and water use by two Sedum
species in green roof substrate. Environmental and Experimental Botany, 107, 105-112.
Versini, P., Petrucci, G., & Gouvello, B. D. (2014). Green-roof as a solution to solve stormwater
management issues? Assessment on a long time period at the parcel scale. Proc. IAHS
Proceedings of the International Association of Hydrological Sciences, 364, 538-544.
Zotarelli, L., Dukes, M.D., Romero, C.C., Migliaccio, K.W., Morgan, K.T. (2010). Step by step
calculation of the Penman-Monteith Evapotranspiration (FAO-56 Method). University of Florida
IFAS Extention, AE459
Figure 4. Plant evapotranspiration vs relative humidity on the Christie roof
0
0.05
0.1
0.15
0.2
0.25
0.3
0.35
0.4
0.45
0
0.2
0.4
0.6
0.8
1
1.2
1.4
Averagesoilwatercontentonthe
Christierooftop(m3/m3)
CropEvapotranspiration(mm/day)
Crop Evapotranspiration
Water Content
Figure 5. Plant evapotranspiration vs measured soil water content on the Christie roof
Figure 6. Plant evapotranspiration vs measured leaf wetness on the Christie roof
0
0.5
1
1.5
2
2.5
3
0
0.2
0.4
0.6
0.8
1
1.2
1.4
1.6
1.8
Averagewindspeedat3meters
aboveChristie’srooftop(m/s)
CropEvapotranspiration(mm/day)
Crop Evapotranspiration
Wind Speed
Methods
0
20
40
60
80
100
120
0
0.2
0.4
0.6
0.8
1
1.2
1.4
1.6
1.8
Averagerelativehumidityat
2metersaboveChristie’sroof(%)
CropEvapotranspiration(mm/day)
Crop Evapotranspiration
Relative Humidity
0
20
40
60
80
100
120
0
0.2
0.4
0.6
0.8
1
1.2
1.4
1.6
1.8
Averageleafwetnessonthe
Christierooftop(%)
CropEvapotranspiration(mm/day)
Crop Evapotranspiration
Leaf Wetness
0
10
20
30
40
50
60
70
80
90
100
-0.1 0.4 0.9
RelativeHumidity
Evapotranspiration (mm/day)
b. ET vs. Relative Humidity
-5
15
35
55
75
95
-0.2 0.3 0.8
LeafWetness(%)
Evapotranspiration (mm/day)
d. ET vs. Leaf Wetness
0
0.5
1
1.5
2
2.5
3
-0.1 0.4 0.9
WindSpeed(m3/m3)
Evapotranspiration (mm/day)
a. ET vs. Wind Speed
0
0.05
0.1
0.15
0.2
0.25
0.3
0.35
0.4
0.45
-0.1 0.4 0.9
WaterContent(%)
Evapotranspiration (mm/day)
c. ET vs. Water Content
Figure 1. The Christie Hall
rooftop weather station
This study measured meteorological data from a weather
station installed on the roof of the Christie residence hall at the
University of Portland campus (Figure 1). Sedum album was
planted in a five gallon bucket on Christie rooftop to model the
already established green roof on Shiley Hall (Figure 2).
Figure 2. A Sedum album
bucket with soil water sensor
where ET0 = reference evapotranspiration rate in mm d-1, Rn =
net radiation at the crop surface in MJ m-2 d-1; G = soil heat flux
density in MJ m-2 d-1; T = mean daily air temperature at 2 m
height in °C; u2 = wind speed at 2 m height in m s-1; es =
saturation vapor pressure in kPa; ea = actual vapor pressure in
kPa; es - ea = saturation vapor pressure deficit in kPa; γ = slope
of the vapor pressure curve in kPa. Kc = the crop coefficient.
𝐸𝑇𝐶 = 𝐾𝐶 𝐸𝑇0
Table 1. Correlation and regression analysis of wind speed, relative
humidity, water content, and leaf wetness with evapotranspiration.
Figure 7. Scatter plot of evapotranspiration (ET) vs. wind speed (a),
relative humidity (b), water content (c) and leaf wetness (d).
Multiple R R Square P-value
Wind Speed 0.143576805 0.020614299 0.00043805
Relative Humidity 0.685002792 0.469228826 9.45862E-84
Water Content 0.580152894 0.336577381 6.63145E-55
Leaf Wetness 0.61327782 0.376109685 7.46715E-63
Rain 0.118115967 0.013951382 0.003881451
Acknowledgements
Thanks to University of Portland for letting us study their roofs!