
Recommended
Recommended
More Related Content
Similar to IEEE TRANSACTIONS ON SYSTEMS, MAN, AND CYBERNETICS SYSTEMS, V
Similar to IEEE TRANSACTIONS ON SYSTEMS, MAN, AND CYBERNETICS SYSTEMS, V (20)
More from MalikPinckney86
More from MalikPinckney86 (20)
Recently uploaded
Recently uploaded (20)
IEEE TRANSACTIONS ON SYSTEMS, MAN, AND CYBERNETICS SYSTEMS, V
- 1. IEEE TRANSACTIONS ON SYSTEMS, MAN, AND CYBERNETICS: SYSTEMS, VOL. 46, NO. 10, OCTOBER 2016 1429 Multimodel-Based Incident Prediction and Risk Assessment in Dynamic Cybersecurity Protection for Industrial Control Systems Qi Zhang, Chunjie Zhou, Naixue Xiong, Senior Member, IEEE, Yuanqing Qin, Xuan Li, and Shuang Huang Abstract—Currently, an increasing number of informa- tion/communication technologies are adopted into the industrial control systems (ICSs). While these IT technologies offer high flexibility, interoperability, and convenient administration of ICSs, they also introduce cybersecurity risks. Dynamic cybersecu- rity risk assessment is a key foundational component of security protection. However, due to the characteristics of ICSs, the risk assessment for IT systems is not completely applicable for ICSs. In this paper, through the consideration of the characteristics of ICSs, a targeted multilevel Bayesian network containing attack, function, and incident models is proposed. Following this pro- posal, a novel multimodel-based hazardous incident prediction approach is designed. On this basis, a dynamic cybersecurity risk assessment approach, which has the ability to assess the risk caused by unknown attacks, is also devised. Furthermore, to improve the accuracy of the risk assessment, which may be reduced by the redundant accumulation of overlaps amongst dif- ferent consequences, a unified consequence quantification
- 2. method is presented. Finally, to verify the effectiveness of the proposed approach, a simulation of a simplified chemical reactor control system is conducted in MATLAB. The simulation results can clearly demonstrate that the proposed approach has the abil - ity to dynamically calculate the cybersecurity risk of ICSs in a timely manner. Additionally, the result of a different comparative simulation shows that our approach has the ability to assess the risk caused by unknown attacks. Index Terms—Bayesian network, cybersecurity, incident pre- diction, industrial control system (ICS), multiple models, risk assessment. Manuscript received May 26, 2015; revised August 13, 2015; accepted August 20, 2015. Date of publication December 18, 2015; date of cur- rent version September 14, 2016. This work was supported in part by the National Natural Science Foundation of China under Grant 61272204 and Grant 61433006, and in part by the Fundamental Research Funds for the Central Universities of China (HUST) under Grant 2013ZZGH006. This paper was recommended by Associate Editor T.-M. Choi. (Corresponding authors: Chunjie Zhou and Yuanqing Qin.) Q. Zhang, C. Zhou, Y. Qin, X. Li, and S. Huang are with the Key Laboratory of Ministry of Education for Image Processing and Intelligent Control, School of Automation, Huazhong University of
- 3. Science and Technology, Wuhan 430074, China (e-mail: [email protected]; [email protected]; [email protected]; [email protected]; [email protected]). N. Xiong is with the Department of Business and Computer Science, Southwestern Oklahoma State University, Weatherford, OK 73096, USA (e-mail: [email protected]). Color versions of one or more of the figures in this paper are available online at http://ieeexplore.ieee.org. Digital Object Identifier 10.1109/TSMC.2015.2503399 NOMENCLATURE List of Notation T A boolean, means that condition is satisfied. F A boolean, means that condition is not satisfied. R Cybersecurity risk of the system. ai ith malicious atom attack (node). ri ith system resource (node). fi ith system function (node). ei ith hazardous incident (node). xi ith auxiliary incident (node). ci ith consequence. p(ei) Occurrence probability of ei. q(ei) Consequence quantification ei. O(ri) Event that attacker has obtained ri. O(ri) Event that attacker has not obtained ri. ori,j Conditional probability that O(ri) happens in the jth
- 4. condition. C(ai) Event that the condition of launching ai has been satisfied. C(ai) Event that the condition of launching ai has not been satisfied. cai,j Conditional probability that C(ai) happens in the jth condition. L(ai) Event that ai has been launched. L(ai) Event that ai has not been launched. �ai Probability that L(ai) happens in the condition that C(ai) has happened. lai,j Conditional probability that L(ai) happens in the jth condition. F( fi) Event that fi has been invalidated. F( fi) Event that fi has not been invalidated. bfi,j Conditional probability that F( fi) happens in the jth condition. H(ei) Event that ei has occurred. H(ei) Event that ei has not occurred. hei,j Conditional probability that H(ei) happens in the jth condition. H(xi) Event that xi has occurred. H(xi) Event that xi has not occurred. hxi,j Conditional probability that H(xi) happens in the jth condition. Ea Set of attack evidence. Eb Set of anomaly evidence.
- 5. 2168-2216 c© 2015 IEEE. Personal use is permitted, but republication/redistribution requires IEEE permission. See http://www.ieee.org/publications_standards/publications/rights/i ndex.html for more information. Authorized licensed use limited to: Northcentral University. Downloaded on October 19,2021 at 14:01:47 UTC from IEEE Xplore. Restrictions apply. mailto:[email protected] mailto:[email protected] mailto:[email protected] mailto:[email protected] mailto:[email protected] mailto:[email protected] http://ieeexplore.ieee.org http://www.ieee.org/publications_standards/publications/rights/i ndex.html 1430 IEEE TRANSACTIONS ON SYSTEMS, MAN, AND CYBERNETICS: SYSTEMS, VOL. 46, NO. 10, OCTOBER 2016 E Set of evidence. ci Set of consequence of ei. C Set of ci. c′i Set of consequence of xi. C′ Set of c′i. ei Set of hazardous incidents. Tmax Maximum time interval of adjacent continuous atom attacks. QH Quantification of harm to people. QE Quantification of environmental pollution.
- 6. QP Quantification of property loss. I. INTRODUCTION W ITH the rapid development of industrial control sys-tems (ICSs), ICSs are susceptible to the attacks and threats of typical IT systems [1]–[4]. Even worse, the number of vulnerabilities and cyber incidents of ICSs are increasing rapidly every year [5]. In the year 2000, a former employee attacked the supervisory control and data acquisition system of a sewage treatment plant in Queensland. This malicious attack caused 800 000 L of raw sewage to spill out into local parks and rivers [6], [7]. Stuxnet, which was discov- ered in June 2010, reportedly ruined almost one-fifth of Iran’s nuclear centrifuges. As a result, it led to the repeated postponement of Iran’s nuclear power plant and grid devel - opment [3], [8]. Unlike traditional IT systems, the security incidents of ICSs can cause irreparable harm to the physical systems they control and to the people dependent on them. Basically, protecting ICSs against cyberattacks is vital to both economy and stability of a nation. Therefore, the cybersecurity issue of ICSs must be taken seriously and solved as soon as possible. As production and operation systems, ICSs have a relatively greater demand on timeliness and availability [9], requiring the need for dynamic cybersecurity protection. The objec- tive of cybersecurity protection of the ICSs is to maintain a normally running system by lowering the dynamic risk below an acceptable risk threshold [10]. Thus, risk-based dynamic cybersecurity protection is an effective approach against cyberattacks [11], [12]. In risk-based dynamic cyber- security protection, together with the target systems, intru- sion detection, risk assessment, decision-making, and policy enforcement [4], [13], [14] form a closed-loop. As a vital role in the closed-loop, risk assessment is used to collect a wide
- 7. variety of information, perceive the functioning state of the system, and assess the current cybersecurity risk of the sys- tem [10]. This evaluation or assessment assists decision makers in achieving benchmark performances and taking necessary actions to prevent the deterioration of the system [15], [16]. Cybersecurity risk assessment in the IT domain is not entirely applicable to ICSs because ICSs are relatively dif- ferent in some aspects from traditional IT systems. First, the cybersecurity objectives are different. Traditional IT systems require first an ensuring of confidentiality, then integrity, and finally availability. In contrast, for ICSs, the priorities of these three security objectives are first availability, then integrity, and finally confidentiality [17], because timeliness and avail- ability are the primary concerns. Malicious attacks introduce the cybersecurity risk to ICSs by demolishing the timeliness and availability. Therefore, the risk assessment of ICSs needs a novel risk propagation analysis approach. On the other hand, the different weight assignments of these three security objec- tives create the need for the consequence quantification of ICSs to be redesigned. Second, most ICSs are real-time systems whose correctness is based on both correctness and timeless of the output [9]. This means that a deferred response will lead to the reduction of control quality. Additionally, ICSs have more complicated and more tightly coupled physical systems. This characteristic may lead to a domino effect [18], which often takes place in process industries. For example, a spoof attack to a programmable logic controller (PLC) which controls a reducing valve, will cause excessively high pressure and can even lead to the explosion of a chemical reactor. Generally, this kind of chain of events happens simultaneously or in a rapid subsequent order [19]. Even worse is that most ICSs run in an embedded system environment with limited computing capabilities. With consideration of the three points above, the risk assessment algorithm of ICSs requires low computational
- 8. complexity to reduce time consumption. Finally, in a continu- ous operation system, ICSs cannot tolerate frequent software patching or updates [4]. This causes the database of attack signatures to lag far behind the rapid development of attacks. With this defect, several intrusion detection system (IDS)- based misuse detections would miss unknown attacks. On the other hand, without information about unknown attacks, such as purposes, consequences, and further steps, these unknown attacks and their consequences cannot be accurately predicted. As a result, the risk assessment module will generate erroneous risk values, which may lead to a wrong decision. In conclusion, although considerable research undertaken in past decades has made a contribution to risk assessment, research dedicated to cybersecurity protection of ICSs has remained limited. In this paper, a multimodel-based incident prediction and risk assessment approach is designed for ICSs, which can perceive and understand the situation of ICSs, utilize the multiple models to predict hazardous incidents caused by mali - cious attacks, and generate the dynamic cybersecurity risk value of ICSs. Furthermore, the proposed approach can also assess the risk caused by unknown attacks. First, by ana- lyzing the process of malicious attacks that lead to loss in ICSs, a multilevel Bayesian network, which consists of an attack model, a function model, and an incident model, is built to describe the propagation of risk caused by cyberattacks. Second, a multimodel-based cybersecurity risk assessment approach for ICSs is designed, which is able to generate the current cybersecurity risk value by calculating the probabili - ties and quantifying the consequences of a variety of potential hazardous incidents caused by malicious attacks. The pro- posed multimodel-based approach can predict the incidents caused by unknown attacks, which is impossible for prediction approaches-based purely on attack knowledge. Then, to elimi- nate the risk error caused by the repeated accumulation of the overlaps amongst different consequences, a decouple method
- 9. for the consequences of an incident is proposed. Finally, the Authorized licensed use limited to: Northcentral University. Downloaded on October 19,2021 at 14:01:47 UTC from IEEE Xplore. Restrictions apply. ZHANG et al.: MULTIMODEL-BASED INCIDENT PREDICTION AND RISK ASSESSMENT 1431 effectiveness of the proposed approach is verified through the use of a simulation, which is a simplified system of a chemical reactor control system. The rest of this paper is organized as follows. Section II first analyzes the requirement of cybersecurity risk assess- ment according to the characteristics of ICSs and then presents the architecture of our approach. Section III builds a novel multilevel Bayesian network and proposes an approach to pre- dict hazardous incidents with the multilevel Bayesian network. Section IV introduces consequence-unified quantification and proposes an approach of dynamic cybersecurity risk assess- ment on the foundation of incident prediction. To verify the effectiveness of the proposed approach, a simulation is conducted in Section V. The concluding remarks are made in Section VI. II. RELATED WORKS A. Cybersecurity Risk Assessment for ICSs In recent years, considerable researches have been under - taken to study cybersecurity risk assessment methods. Tsai and Huang [20] used the analytic hierarchy process to qualitatively assess the cybersecurity risk of wireless net-
- 10. works. Feng and Li [21] used an information systems security model in order to cope with the uncertainty in the infor- mation system. Shi [22] adopted a simulation of attacks to analyze the impact of each attack, which led to the proposal for an approach of the risk assessment for enterprise networks. Poolsappasit et al. [23] proposed a risk assessment approach using Bayesian networks which enabled a system adminis- trator to quantify the chances of network compromise. This literature introduced a model named Bayesian attack graph to describe the causal relationship between multistep attacks and to analyze the potential attack. Cárdenas et al. [4] presented an approach for analyzing the loss of events, and used prob- abilistic risk assessment to calculate the risk. In conclusion, the existing researches of risk assessment are mainly divided into two directions. One direction focuses on the relation- ship between multistep attacks and the prediction of potential attacks. The quantification methods of the consequence of malicious attacks are mainly based on confidentiality, integrity, and availability. Another direction performs work on the causal relationship of hazardous incidents, which can be used to predict the occurrence of these hazardous incidents. Unlike IT systems, such as the intranet or Internet of things (IoT), ICSs have rigorous requirements on timeliness and availability [9]. The cybersecurity risks of ICSs are pri - marily from the potential loss caused by cyberattacks which demolish the timeliness and availability of the control system. Therefore, the cybersecurity risk propagation of ICSs is differ - ent from that of IT systems, and many risk assessment models for IT systems are not suitable for ICSs. Thus, cybersecurity risk assessment in ICSs requires a novel model to analyze the risk propagation. The majority of the existing quantitative risk assess- ment approaches [4], [11], [24], [25] use the definition R = ∑i S(ei)P(ei) to calculate the risk R, where S(ei) is the
- 11. severity of the incident ei and P(ei) is the probability of the incident ei. This definition requires that the severity of haz- ardous incidents should be quantified in the same unit. It is also worth noting that there is a problem when this definition is used in ICS risk assessment. This is due to the fact that, for ICSs, different hazardous incidents may cause the same consequence; whereby, using this definition to assess risk will cause the severity of the same consequence to be accumulated multiple times. As a result, there is an error which cannot be ignored in the risk assessment. Worst of all, the decision- making may generate a wrong policy with this inaccurate risk value. Many ICSs run constantly [4], [9], and therefore the updates must be planned and scheduled days or weeks in advance. After the updates, exhaustive testing is necessary to ensure the high availability of the ICS [9]. This leads to the inability of attack knowledge of ICSs to be updated in a timely manner. Several attack knowledge-based risk assessments cannot work well on ICSs. Therefore, the risk assessment should have the ability of assessing the risk caused by unknown attacks without corresponding attack knowledge. Based on the above analysis, the requirements of cyberse- curity risk assessment for ICSs can be summarized as follows. The risk assessment of ICSs needs the following. 1) A novel and targeted risk model to analyze the risk propagation. 2) A unified quantification approach to calculate the risk quantitatively without the error caused by the overlaps amongst consequences. 3) Finally, the risk assessment of ICSs should have the abil -
- 12. ity to assess the risks caused by unknown attacks without corresponding attack knowledge. B. Model-Based Risk Assessment Although the aforementioned characteristics of ICSs bring more demanding requirements of risk assessment for ICSs, the characteristics of the function and structure of ICSs make some approaches which are hard to implement in IT systems work well. More specifically, the network structure, functions, and tasks of ICSs are usually relatively fixed [26]. Compared with IT systems, which are more flexible, building a system model for ICSs is relatively easy and does not require fre- quent updates or modifications. Therefore, model-based risk assessment is suitable for ICSs. Throughout the history of cyberattacks to ICSs, it is noted that the main purpose of the attackers is to damage the control system. To achieve this destructive purpose, attackers gener - ally need to complete part or all of the following three steps: 1) infiltrate the field network; 2) invalidate system functions; and/or 3) cause incidents. To assess the risk, it is necessary to model attacks, functions, and incidents. One typical modeling approach of attacks that is widely used is the Bayesian network, which is a significant part of risk assessment. Poolsappasit et al. [23] and Xie et al. [27] estab- lished models of attack knowledge with the Bayesian network and used attack models to predict future attacks and assess the risk. Wrona and Hallingstad [28] used the Bayesian network to assess the connectivity risk of protected core networking. Authorized licensed use limited to: Northcentral University. Downloaded on October 19,2021 at 14:01:47 UTC from IEEE Xplore. Restrictions apply.
- 13. 1432 IEEE TRANSACTIONS ON SYSTEMS, MAN, AND CYBERNETICS: SYSTEMS, VOL. 46, NO. 10, OCTOBER 2016 Szpyrka et al. [29] proposed a risk assessment approach for telecommunication networks by using the Bayesian network to analyze the impact of attacks on the work-flow. However, the Bayesian network has a defect of not containing the informa- tion of the unknown attack, such as the zero-day attack. If the system is compromised by an unknown attack, the Bayesian network cannot predict its next step or potential impact. Fault tree is the mainstream approach to model the rela- tionship of functions. Fault tree analysis (FTA) is a top-down, deductive failure analysis approach [30]. FTA uses Boolean logic and anomaly events to analyze the undesired system state. FTA is mainly used in the fields of safety engineer - ing and reliability engineering to assess system risk [31] –[35], but this type of risk refers to the potential loss caused by sys - tem fault rather than the one caused by a cyberattack. It is noted that the fault tree model is rarely used in IT systems, such as the intranet, IoT, etc. This is because the structure and functions of IT systems often change with the change of business. An event tree is an effective way to describe the causal relationship of incidents. Event tree analysis (ETA) is a for- ward, bottom-up, and logical modeling technique. In using a single initiating event, ETA can assess the probabilities of the outcomes. ETA can be applied to nuclear power plants, space- craft, chemical plants, etc. Like the FTA, ETA is often used in risk assessment [36]–[38]. Due to the flexibility of IT sys- tems, ETA is not adaptable for IT systems. Like the event tree, a Petri net is also used to model relationship of various
- 14. kinds events. Many researches did work on risk assessment with Petri net. Cho et al. [39] used the generalized stochastic Petri nets to model intrusion, failure, and repair events, and then analyzed the security and dependability of a control sys- tem. Fanti et al. [40] proposed a risk assessment framework by modeling accidents of high-way networks with a colored timed Petri net. However, a Petri net may become too large to generate all states of the system. As a result, it can be difficult to dynamically analyze. In recent years, several comprehensive methods for model- based risk assessment have been designed. Operationally criti - cal threat asset and vulnerability evaluation (OCTAVE) [41] is an approach for identifying, assessing, and managing informa- tion security risks. OCTAVE can identify and assess the risk to critical assets and set an optimal security policy by ana- lyzing the multiple domain knowledge. OCTAVE integrates many approaches, such as the aforementioned FTA and ETA, to model the threads. CORAS [42]–[44], which is built on many methods, such as hazard and operability study, FTA, Markov analysis, etc., is used to deal with complex systems such as ICSs. However, as these are static approaches of risk assessment, OCTAVE and CORAS cannot be adopted to assess the dynamic risk of ICSs. C. Architecture of Cybersecurity Risk Assessment for ICSs To meet the requirement of risk assessment for ICSs men- tioned in Section II-A, a dynamic cybersecurity risk assess- ment based on the multimodel is proposed, which is shown in Fig. 1. Fig. 1. Architecture of the dynamic cybersecurity risk of ICSs. There are two kinds of inputs for dynamic cybersecurity risk assessment: 1) attack evidence and 2) anomaly evidence.
- 15. Attack evidence, which contains information about the type, target, and timestamp of the detected attack, is derived from IDS. Anomaly evidence, containing the information of the anomaly, such as the invalidation of a function, the occur- rence of a hazardous incident, etc., can be obtained from the supervisor system of ICSs. Dynamic cybersecurity risk assessment is divided into two phases: 1) hazardous incident prediction and 2) risk assess - ment. During the hazardous incident prediction phase, attack evidence and anomaly evidence are collected and marked in a multilevel Bayesian network. Then, probabilities of all the potential hazardous incidents can be calculated by ana- lyzing the collected evidence and the multilevel Bayesian network. During the risk assessment phase, the consequences of hazardous incidents are first classified, then each type of consequence is quantified using the same unit. Second, the overlaps amongst hazardous incidents must be addressed so that the error caused by accumulation of overlaps amongst different consequences can be eliminated. Finally, the proba- bilities and consequences of hazardous incidents are combined into the cybersecurity risk. III. MULTIMODEL-BASED INCIDENT PREDICTION In this section, the relationship between atom attacks in multistep attacks, the dependency of system functions, and the causality of incidents are analyzed first. Then the multidomain knowledge is modeled into a multilevel Bayesian network. Finally, a multimodel-based hazardous incident prediction approach will be introduced. A. Bayesian Network-Based Knowledge Modeling As mentioned in Section II-B, in order to achieve the destructive purpose, attackers generally need to follow part or
- 16. all of these three steps: 1) infiltrate the field network; 2) inval - idate system functions; and/or 3) cause incidents. Therefore, multidomain knowledge of malicious attacks, invalidation of functions, and occurrence of incidents should be considered, Authorized licensed use limited to: Northcentral University. Downloaded on October 19,2021 at 14:01:47 UTC from IEEE Xplore. Restrictions apply. ZHANG et al.: MULTIMODEL-BASED INCIDENT PREDICTION AND RISK ASSESSMENT 1433 making it necessary to establish multiple models of attacks, system functions, and hazardous incidents. Theoretically, probabilistic inference requires a joint prob- ability distribution, but it suffers from exponential complexity with the number of variables. There are various potential attacks, many system functions, and a great number of unan- ticipated incidents, making the joint probability distribution too large to be available. The Bayesian network is devel - oped to solve this problem, as it can split the complicated joint probability distribution into a series of simple nodes, which reduces the difficulty of knowledge acquisition and the complexity of probabilistic inference. The Bayesian net- work is widely used in fault diagnosis [45], decision-theoretic troubleshooting [46], etc. As mentioned previously, in order to be used to predict the occurrences of incidents, attack, function, and incident know l- edge should be modeled. In this paper, to help facilitate the inferences, these three types of knowledge are converted into a multilevel Bayesian network, which consists of four parts: 1) attack level; 2) function level; 3) incident level; and 4) infor -
- 17. mation transfer between levels. The modeling procedures of these four parts are described in detail as follows. 1) Attack Level: Cyberattacks are becoming increasingly complex, especially when the target is an ICS characterized by a layered architecture that integrates several security tech- nologies. These contexts can be violated by a multistep attack, which is a complex attack strategy comprised of multiple cor - related atom attacks. To launch an atom attack, all conditions of this attack must be satisfied. If an atom attack works, the attacker will obtain some resources which may be the condi - tions of other atom attacks. The purpose of launching any atom attack is to prepare for subsequent atom attacks. To describe the atom attacks of a multistep attack with the Bayesian net- work, two sorts of nodes are proposed: 1) an atom attack node and 2) a resource node. In this paper, the Bayesian network is used to describe the relationships between attack nodes and resource nodes. There are two steps to generate a Bayesian network: 1) generating a directed acyclic graph (DAG) and 2) generating a conditional probability table for each node in DAG. Through vulnerability scanning, vulnerabilities of ICSs can be obtained. Then all possible attack scenarios are enumerated with the information of system vulnerabilities. Next, the condi - tions and results of each atom attack in the attack scenarios are analyzed. Assuming there are m atom attacks and n resources, an (m+n)×(m+n) incidence matrix [Ai,j] can be established. If the conditions of an atom attack aj are ri1, ri2, . . . , rix, then let Aik,j = 1, where k = 1, 2, . . . , x. If the attacker can obtain the resources rj1, rj2, . . . , rjy by launching an atom attack ai, then let Ai,jk = 1, where k = 1, 2, . . . , y. Finally, a DAG that is described by the incidence matrix [Ai,j] can be generated. Assuming there are n resource nodes, r1, r2, . . . , rn, point-
- 18. ing to the attack node ai. In other words, attack node ai has n parent nodes. The Bayesian network adopts a conditional probability table to depict the condition of attack ai, which is shown in Table I. In general, satisfying the condition of an attack does not mean that the attacker must launch the attack, so the TABLE I CONDITION OF ATTACK ai TABLE II PROBABILITIES OF LAUNCHING ATTACK ai TABLE III CONDITIONAL PROBABILITY OF ai TABLE IV PROBABILITIES OF OBTAINING RESOURCE rj Bayesian network uses the �ai to describe the probability of launching an attack ai. The probability of launching an attack ai is shown in Table II. To simplify the Bayesian network, Tables I and II can be merged into one table, as shown in Table III, where lai,x = �ai cai,x, x = 1, 2, . . . , 2n. Assuming that the resource node rj has m parent nodes a1, a2, . . . , am, and the attacker has launched several attacks in a1, a2, . . . , am, he will have a chance to obtain the resource rj. The probabilities of obtaining resource rj are shown in Table IV. The aforementioned parameters, such as ori,j, cai,j, and �ai , can be obtained from the statistical analysis of historical data
- 19. or from experts in the cybersecurity field. 2) Function Level: ICSs usually have tight coupled phys- ical systems. If a function becomes invalid due to malicious attacks, it may cause other functions to become invalid, too. This phenomenon is called cascading failure. FTA is used Authorized licensed use limited to: Northcentral University. Downloaded on October 19,2021 at 14:01:47 UTC from IEEE Xplore. Restrictions apply. 1434 IEEE TRANSACTIONS ON SYSTEMS, MAN, AND CYBERNETICS: SYSTEMS, VOL. 46, NO. 10, OCTOBER 2016 extensively to analyze the cascading failure of a control system [47]–[49]. The main objectives of FTA are as follows. 1) To identify all possible combinations of basic events that may result in a critical event in the system. 2) To find the probability that the critical event will occur during a specified time interval or the frequency of the critical event. 3) To identify aspects of the system which need to be improved in order to reduce the probability of the critical event. There are many methods involved in establishing a fault tree; therefore, the modeling procedure will not be discussed in this paper. A fault tree can be converted into a Bayesian network [45], [50]. However, it is noted that the conditional probability table of the Bayesian network contains more infor -
- 20. mation than the logical gate of the fault tree. In other words, the logical gate cannot always accurately describe the relation- ship amongst functions. For example, if the cooling function is invalid, there will be a 50% possibility of a crash for the host in the same cabinet. It is impossible to model this rela- tionship by using the fault tree, but the Bayesian network can easily describe this relationship with a conditional probability table. To model the dependency of functions more accurately, the dependency of every function failure node in the Bayesian network is analyzed and the corresponding conditional proba- bility table is amended. Experts in the system safety field can provide the conditional probability. 3) Incident Level: In ICSs, if an incident takes place, it may trigger other incidents. This phenomenon is called the “domino effect.” For example, when the pressure of a reactor exceeds the safe threshold level, it is likely to cause an explosion. Even worse, this explosion may lead to casualties, environmental damage, or property loss. In this paper, the Bayesian network is used to model the relationship amongst incidents. There are three steps involved in establishing a Bayesian network of incidents. 1) Analyze historical data and consult engineers and experts to identify all possible incident scenarios of ICSs. 2) Analyze the causal relationship amongst incidents. If the occurrence of an incident ei can cause another inci- dent ej, the Bayesian network will add an arrow from ei to ej, in which ei is the parent node of ej. 3) Generate a conditional probability table for each incident.
- 21. Assuming that there are n parent nodes of ej, the Bayesian network uses a conditional probability table, which is shown in Table V, to describe the probability of ej. Similar to the conditional probability in the function level, experts in the system safety field can provide the parameter hei,j. There may exist several overlaps amongst different conse- quences. The loss of an overlapped part will be calculated repeatedly, and, as a result, it will cause the error to turn into a risk. To solve this problem, the consequences of the inci - dents need to be decoupled. There are four steps to decouple consequences. Step 1: For each incident ei, analyze its consequence and generate a consequence set ci = (c1, c2, . . . , cn). TABLE V PROBABILITIES OF INCIDENT OCCURRENCE Algorithm 1 Decoupling Algorithm of C Input: C = (c1, c2, . . . , cm) Output: C′ = (c′1, c′2, . . . , c′m′) 1: C′ ← ∅ 2: for i = 1 to m do 3: n ← number of elements of C′ 4: for j = 1 to n do 5: t1 ← ci ∩ c′j 6: t2 ← c′j − t1 7: ci ← ci − t1 8: for k = 1 to 2 do 9: if tk �= ∅ then 10: Add tk in end of C ′
- 22. 11: end if 12: end for 13: end for 14: if ci �= ∅ then 15: Add ci in end of C ′ 16: end if 17: end for 18: return C′ The elements of the consequence set ci could be field workers, facilities, environment, products, etc. The meaning of ci is that the occurrence of inci- dent ei will threaten the elements in consequence set ci. For example, the incident ei is an explosion of a reactor, which may cause worker casualties, air pollution, facilities damages, and products losses. The consequence set of ei is ci = (workers, air, facilities, products). Step 2: Generate C′ = (c′1, c′2, . . . , c′m′) based on C = (c1, c2, . . . , cm). The following conditions must be met: completeness: ⋃m i=1 ci = ⋃m′ i=1 c ′ i (1)
- 23. independence: ∀ c′i, c′j ∈ C′ : c′i ∩ c′j = ∅ (2) traceability: ∀ c′ ∈ C′,∃ c ∈ C : c′ ⊆ c. (3) Algorithm 1 shows a promotional algorithm, which can minimize the number of elements of C′. The small number of elements of C′ can reduce the complexity of the Bayesian network. Step 3: For each c′j in C ′, generate a corresponding aux- iliary node xj. According to the traceability of C ′, Authorized licensed use limited to: Northcentral University. Downloaded on October 19,2021 at 14:01:47 UTC from IEEE Xplore. Restrictions apply. ZHANG et al.: MULTIMODEL-BASED INCIDENT PREDICTION AND RISK ASSESSMENT 1435 TABLE VI CONDITIONAL PROBABILITY OF AUXILIARY NODE Fig. 2. Relationship between function and attack. which is shown in (3), there must be a consequence set ci in C, where c ′ j ⊆ ci. Generate the incident set ej for each c ′
- 24. j, which satisfies the following conditions: ∀ ei ∈ ej, c′j ⊆ ci (4) �ei /∈ ej, c′j ⊆ ci. (5) Assume that the incident set of c′j is ej = (ei1 , ei2 , . . . , ein ), then add an auxiliary node xj in the Bayesian network. The parent nodes of the new auxiliary node xj are ei1 , ei2 , . . . , ein . Step 4: For each auxiliary node xj, generate a conditional probability table, which can be obtained from the expertise. The conditional probability table of the auxiliary node xj is shown in Table VI. 4) Information Transfer Between Levels: The cyberattacks can lead to system function failures, and the function failures may cause the industrial incidents. To analyze risk propa- gation, information transfer is necessary between the three aforementioned layers. For system functions, besides the failures of their parent nodes, the cyberattack can also invalidate them. For each func- tion fi in the function level, find all attack nodes that may lead to the failure of fi in the attack level. Then add arrows from attack nodes to the function node fi. Assuming that there are n parent nodes of function fi, and m attack nodes may invalid function fi, Fig. 2 shows the relationship diagram of func- tion fi. Finally, analyze the entire situation of f1, f2, . . . , fn and a1, a2, . . . , am, and obtain the conditional probability of fail - ure for function fi, as shown in Table VII, from expertise or historical data.
- 25. Failure of system functions is a significant cause of indus- trial incidents. For example, failure of the temperature control function may result in the incident of the reactor temperature exceeding the threshold. For each incident ei in ICSs, ana- lyze all the system functions whose failure can lead to the occurrence of incident ei, and then add arrows from function TABLE VII PROBABILITIES OF FUNCTION fi FAILURE Fig. 3. Relationship between incident and function. TABLE VIII PROBABILITIES OF INCIDENT ei failure nodes to the incident ei. Assuming that there are n par - ent nodes of the incident ei, and m function failure nodes may cause the incident ei, Fig. 3 shows the relationship diagram of incident ei. Then analyze the entire situation of e1, e2, . . . , en and f1, f2, . . . , fm, and obtain the conditional probability table of incident ei, as shown in Table VIII, from historical data or expertise. B. Incident Prediction With the proposed multilevel Bayesian network, the proba- bilities of the potential hazardous incidents can be calculated. The approach of incident prediction is introduced as follows. 1) Collection of Data and Evidence: An IDS is a device or software application that monitors network or system activi - ties for malicious activities or policy violations and produces Authorized licensed use limited to: Northcentral University.
- 26. Downloaded on October 19,2021 at 14:01:47 UTC from IEEE Xplore. Restrictions apply. 1436 IEEE TRANSACTIONS ON SYSTEMS, MAN, AND CYBERNETICS: SYSTEMS, VOL. 46, NO. 10, OCTOBER 2016 Fig. 4. Example of updating evidence in Bayesian network. reports to a management station or risk assessment mod- ule. The anomaly detection system (ADS) collects data from a system to compare with the normal values. If there is a considerable deviation, like the IDS, the ADS will gen- erate a report to the risk assessment module. In several researches regarding the anomaly-based IDS, the ADS is a part of the anomaly-based IDS. In this paper, the IDS rep- resents the signature-based IDS which does not contain an ADS. In other words, the IDS and ADS are two separate systems. When the IDS detects attacks, it generates attack evidence and sends it to the risk assessment module. Similarly, the ADS detects anomalies and sends anomaly evidence to the risk assessment module. For each attack evidence or anomaly evidence, there must be a unique corresponding node in the multilevel Bayesian network. Correlation only exists amongst the atom attacks in a com- binational attack. If two atom attacks do not belong to a combinational attack, a correct prediction cannot be gener - ated by analyzing the multilevel Bayesian network with these two atom attacks. To solve this problem, Tmax is proposed as the maximum time interval of adjacent continuous atom attacks. If the interval of the adjacent continuous attacks is
- 27. larger than Tmax, the multilevel Bayesian network does not regard these two attacks as a combinational attack. The value of Tmax can be obtained by analyzing a significant volume of historical data regarding combinational attacks. To better illustrate the updating process of Ea, an example of updating is shown in Fig. 4. Suppose that Eb is the set of anomaly evidence. If evi - dence of an anomaly is added into Eb, it exists until the corresponding anomaly is removed. 2) Calculation of Incident Probability: Let E = Ea ∪ Eb is the evidence set of the multilevel Bayesian network. When any evidence in E is changed, the algorithm named probability propagation in trees of clusters (PPTCs) can update the prob- ability of all hazardous incidents by analyzing the multilevel Bayesian network. PPTC algorithm is one of the most recog- nized algorithms for exact probabilistic inferences in Bayesian networks [51]. With PPTC, probabilities of all nodes in the multilevel Bayesian network can be calculated. The inference of Bayesian networks is an NP-hard prob- lem [28], [52]. However, several efficient algorithms, including the PPTC algorithm, have been proposed for inference in graphs consisting of tens to hundreds of nodes. In graphs of a limited size, the Bayesian inference can generally be performed in less than a few seconds [28]. IV. INCIDENT PREDICTION-BASED DYNAMIC RISK ASSESSMENT In this section, the incident consequences of incidents are first classified. Then, a quantification method is introduced for each type of consequence. Finally, a dynamic cybersecurity risk assessment approach for ICSs is proposed.
- 28. A. Classification of Incident Consequences The adverse effects of an incident may be classified into three categories: 1) harm to humans; 2) environmental pollu- tion; and 3) property loss. There are three sorts of harms to humans [53]. 1) Temporary Harm: In this case, the person is harmed but will be totally restored and eventually able to work after the accident. 2) Permanent Disability: In this case, the person receives permanent illness or disability. The degree of disability is often given as a percentage. 3) Fatality: In this case, the person dies from the harm. Pollution is the introduction of contaminants into the natu- ral environment, causing adverse changes. In this paper, three kinds of pollution are considered. 1) Air pollution occurs when chemicals and poisonous particulates are released into the atmosphere. 2) Soil contamination occurs when chemicals are released by spillage or underground leakage. 3) Water pollution occurs when chemical contaminants or wastewater from commercial and industrial waste are discharged into surface waters. Property loss refers to damage of materials, products, and equipment. This loss is caused by incidents which occur in the production process. For example, superheat temperatures
- 29. will damage the products, frequent changes of the switch will lead to valve damage, and high pressure will cause a tank explosion. B. Quantification of Incident Consequences 1) Quantification of Harm to Humans: To quantitatively assess the cybersecurity risk of ICSs, the loss of human life or injury must be quantified in monetary units. The quantification result of harm to humans depends on the decision-maker. Now assume that there is a decision-maker who is deciding which risk-reduction method will be adopted. If he would like to increase the cost of an investment by �c to reduce the probability of a fatality by �p, the QH = �c/�p can be used to derive the quantification of human life. To quantify human life into monetary units, the decision-maker must consider the probability of a fatality, total investment, consequences of a fatality for the reputation of the company, and so on. In many cases, the risk to humans is not adequately described by the fatality risk, and injuries should also be taken into account. This is often done by comparing injuries and Authorized licensed use limited to: Northcentral University. Downloaded on October 19,2021 at 14:01:47 UTC from IEEE Xplore. Restrictions apply. ZHANG et al.: MULTIMODEL-BASED INCIDENT PREDICTION AND RISK ASSESSMENT 1437 disabilities with fatalities and trying to calculate a potential equivalent fatality [54]. In this paper, for simplicity purposes,
- 30. probability and fatality are used to replace temporary harm and permanent disability. 2) Quantification of Environmental Pollution: For ICS, the monetary loss of environmental pollution is defined as QE = Penalty + Compensation + HarnessCost. (6) 1) Penalty: According to the environmental protection laws, if the occurrence of an incident causes environ- mental pollution, as owner of the ICS, the company must pay the penalty charge (Penalty). Relevant laws and regulations decide the specific value of the penalty. 2) Compensation: When environmental pollution occurs, it tends to influence the living conditions of residents near the plant, the downstream agricultural production, etc. As the relevant liable person, the company has the obli - gation to pay for compensation. Consulting legal advis- ers decide the value of compensation (Compensation). 3) HarnessCost: To clear the polluted environment, as the polluter, the company must take action to improve the environment. The analyzing record of similar inci - dents can valuate the cost of harnessing the environment (HarnessCost). 3) Quantification of Property Loss: In this paper, the cost of replacement is used to quantify the loss of property QP, such as the loss of materials, products, and equipment. For example, if any equipment is damaged, it needs to be replaced. Therefore, the cost of replacement is the loss of this equipment. Similarly, if a product is damaged, it cannot be sold. When materials are damaged, the enterprise must buy new materials. Therefore, the loss of materials and products are the cost. In all situations, any materials, products, and equipment loss can be quantified
- 31. as monetary loss. C. Calculation of Dynamic Risk In this paper, a set of triplets which is defined by Kaplan and Garrick [55] is used to express the risk R = {〈ei, p(ei), c(ei)〉}mi=1 (7) where p(ei) is the probability of a hazardous incident ei, and c(ei) is the consequence of ei. If there is no overlap amongst consequences and the con- sequences can be quantified in the same unit, then the overall risk can be calculated by R = m∑ i=1 p(ei) · q(ei) (8) where q(ei) is the quantification of the consequence of ei. Section III-A3 introduces a method to generate the auxiliary nodes xi, which are essentially hazardous events. Equation (2) shows that there is no overlap between the consequences of the auxiliary nodes. Equation (1) shows that the auxiliary nodes contain all possible consequences. So the risk of ICSs can be calculated by R = m′∑ i=1 p(xi) · q(xi). (9)
- 32. Fig. 5. Control structure of chemical reactor. The p(xi) is calculated in Section III-B, and the q(xi) can be quantified in monetary units by methods introduced in Section IV-B. V. SIMULATION: CHEMICAL REACTOR CONTROL SYSTEM The purpose of this section is to illustrate how our approach validly calculates the cybersecurity risk in real-time through a simulation. In this section, the experimental subject, a chem- ical reactor control system, is described first. Then the model implementation and the simulation platform are introduced. Several simulations are designed to illustrate the timeliness capability, validity, and ability to handle unknown attacks of our approach. Finally, the results of the simulations are recorded and analyzed. A. Knowledge Modeling and Simulation Platform A chemical reactor is a device for containing and controlling a chemical reaction and is widely used in the chemical indus- try. The representative structure of a chemical reactor control system is shown as Fig. 5. In Fig. 5, the Ethernet connects to the enterprise network via G1, which is not shown in this figure. Two controller area network bus (CANBUS) networks connect to the Ethernet via G2 and G3. In the Ethernet, there are an engineer sta- tion (ES) and a historical data server (HDS). The host in the enterprise network can access the historical data of HDS, but cannot access the ES. PLC1–PLC6 are distributed into two CANBUS networks. The ES and the HDS can obtain data from all of the PLCs, but only the ES can modify and configure PLCs.
- 33. The control system has intentionally been set up to include several real vulnerabilities. In particular, the HDS is vulnerable to a buffer overflow exploitation based on CVE-2007-4060 and an file transfer protocol bounce attack based on CVE-1999- 0017. Additionally, the HDS does not limit the number of username/password verifications, which makes the HDS vul - nerable to password brute-force attacks. Like the HDS, the Authorized licensed use limited to: Northcentral University. Downloaded on October 19,2021 at 14:01:47 UTC from IEEE Xplore. Restrictions apply. 1438 IEEE TRANSACTIONS ON SYSTEMS, MAN, AND CYBERNETICS: SYSTEMS, VOL. 46, NO. 10, OCTOBER 2016 Fig. 6. Multilevel Bayesian network of reactor. ES is also vulnerable to a buffer overflow exploitation. More remarkably, the ES relies on the IP address for authentica- tion, which allows remote attackers to send malicious codes by spoofing the IP address. When an attacker obtains the admin- istrator authorities of the HDS or the ES, he can attack PLCs by Denial of Service (DoS) attack, man-in-the-middle attack, etc. If an attacker launches an attack to PLC1–PLC6, the corre- sponding functions will fail. For example, when the PLC1 is under the DoS attack, the switch functions of V1 and V2 will be invalid. Similarly, if an attacker reconfigures the program of PLC2, the sensation function will fail. As a subfunction of the liquid level control, the switch function failure of V1
- 34. is likely to lead to an invalidation of the liquid level control. Even worse, the invalidation of a function may cause unan- ticipated incidents, such as a temperature anomaly, excessive pressure, or even a reactor explosion. Finally, the series of incidents will damage products and facilities, pollute water and air, and injure staff. By analyzing this chemical reactor control system, all potential attacks can be enumerated, the failures that may be caused by those attacks can be figured out, all possible incidents can be speculated, and finally, the multilevel Bayesian network which is shown in Fig. 6 can be built. Conditional probabilities of the nodes in the multilevel Bayesian network are obtained from expertise. The simulation platform is implemented in MATLAB, which consists of three modules: 1) an evidence generator; 2) an incident prediction module; and 3) a risk assessment module. Fig. 7 shows the structure of the simulation platform. The evidence generator is used to simulate the signature- based IDS and ADS. It uses an array to store an evidence list, which is shown in Section V-B. For each node in the multilevel Bayesian network, it has a unique index in the range of 1 to the total number of nodes N. The elements of the array are integers from −N to N. If the ith element is 0, it means that, at the ith minute, there is no evidence; if the ith element is a positive integer, it means that there is an evidence at ith minute; and if the ith element is a negative integer, it means that this evidence is withdrawn at the ith minute. The input of the evidence generator is a time trigger. When the evidence generator receives the trigger signal, it reads the input time and updates the evidence set of the multilevel Bayesian network according to the array. The incident prediction module uses the Bayes net tool- box (BNT) [56] to establish the multilevel Bayesian network, which is shown in Fig. 6. The BNT was developed by
- 35. Kevin Murphy and is a toolbox that works with MATLAB from MathWorks. The toolbox supports different exact and approximate inference algorithms, parameters, and structure learning. When the evidence generator sends evidence, they will be added into E. Then the incident prediction module uses the BNT to infer the multilevel Bayesian network with E. Finally, the probabilities of x1, x2, . . . , x8 are calculated and sent to the risk assessment module. When the risk assessment module receives the probabilities of x1, x2, . . . , x8, it calculates the risk of every incident and adds all the potential loss of x1, x2, . . . , x8 to the system risk. Fig. 8 shows the interface of the simulation, which con- sists of two windows. The left window displays the multilevel Bayesian network. Four colors—red, green, blue, and black— are used to represent four kinds of nodes—attack nodes, resource nodes, function nodes, and incident/auxiliary nodes, respectively. When the incident prediction module receives attack evidence or anomaly evidence, the corresponding node will be marked with a circle. Double clicking any node can open its property window. In Fig. 8, the properties window of the incident node x7 shows the current probability of x7 in the parameter UserData. The right window shows the Authorized licensed use limited to: Northcentral University. Downloaded on October 19,2021 at 14:01:47 UTC from IEEE Xplore. Restrictions apply. ZHANG et al.: MULTIMODEL-BASED INCIDENT PREDICTION AND RISK ASSESSMENT 1439 Fig. 7. Structure of the simulation platform.
- 36. Fig. 8. Interface of the simulation platform. probability curves of x1, x2, . . . , x8 and the dynamic cyberse- curity risk curve. Every minute, in the right window, points are plotted above curves according to the results sent from the incident prediction module and the risk assessment mod- ule. In Fig. 8, the right window shows the probabilities of x1, x2, . . . , x8 and the risk during the first 345 min. B. Simulation and Result Analysis The simulation procedure is separated into three steps as follows. 1) A multistep attack, which is described later, is launched on the chemical reactor control system. The evidence is collected and the cybersecurity risk is calculated every minute. Then the curves of the cybersecurity risk and probabilities of incidents x1, x2, . . . , x8 in the multilevel Bayesian network are provided. 2) To validate the ability to deal with unknown attacks, some attack knowledge from the multilevel Bayesian network is removed, so these attacks are unknown attacks to the system. Then an identical multistep attack on the system is launched on the system. Finally, the results of these two simulations are compared. 3) With the multilevel Bayesian network in step 1), the risk assessment is repeated 5000 times and all the execution times are recorded, the distribution curve of the execu- tion time is presented to show the real-time capability of our approach. Then, 25 multilevel Bayesian networks with different node sizes will be generated randomly, and afterward, all the execution times are recorded to
- 37. show the possible upper/lower bounds and scalability of our approach. Because our concern is the cybersecurity of the physical layer, in order to simplify the process of attack, the attack has reached the physical layer. The goal of an attacker is to destroy the chemical reactor by invalidating the PLC5. The attack scenario includes the following steps. First, the remote attacker acquires the list of IP addresses by an IP scanner. Second, the attacker scans ports and vulnerabilities within the HDS and the ES. Third, the attacker launches a DoS attack on the HDS to create a breakdown. Fourth, the attacker disguises himself as an HDS in order to commu- nicate with the ES. Since the ES trusts the HDS, the data and command sent by the attacker will not be validated. As a result, the attacker can send malicious commands to the ES and obtain administrator authority. Finally, the attacker modi - fies the program of PLC5 to invalidate the pressure reduction function. Since the aforementioned attacks are all known attacks, they can be detected by the signature-based IDS. Meanwhile, some attacks can cause system anomalies and be captured by ADS. For example, when the attacker launches an IP scan attack, the IDS detects this attack and generates an attack evidence. Similarly, the ADS generates an anomaly evidence due to the failure of the pressure control function. To clarify this, Table IX lists all the evidence caused by this multistep attack. In this simulation, a positive integer is used to represent absolute time, where the unit is 1 min. In this simulation, the maximum interval of the adjacent continuous atom attacks is set to 150 min. There are eight incidents that can lead to various losses. Consequences of these eight incidents are quantified and given in Table X.
- 38. Fig. 9 shows the probabilities of incidents x1, x2, . . . , x8 and the dynamic cybersecurity risk value, which are recorded every minute. In Fig. 9(b), the label with a pin on the risk curve Authorized licensed use limited to: Northcentral University. Downloaded on October 19,2021 at 14:01:47 UTC from IEEE Xplore. Restrictions apply. 1440 IEEE TRANSACTIONS ON SYSTEMS, MAN, AND CYBERNETICS: SYSTEMS, VOL. 46, NO. 10, OCTOBER 2016 (a) (b) Fig. 9. Results of simulation. (a) Probability curves of incidents. (b) Cybersecurity risk curve. TABLE IX LIST OF EVIDENCE TABLE X QUANTIFICATION OF INCIDENCES CONSEQUENCES represents the corresponding evidence. For example, a1 means that, at the 50th minute, the signature-based IDS detected the IP scan attack. f4 means that, at the 266th minute, the ADS captured the failure of f4. f 4 means that the function f4 has been fixed at the 378th minute. The last label “attack timeout” at the 412th minute means that it has been 150 minutes since the last attack evidence a20 generated at the 261st minute.
- 39. Fig. 9 shows that the cybersecurity risk is increasing as the attacker gradually launches those attacks. However, w hen an attack is suspended or the invalid function is fixed, the cybersecurity risk decreases. It is worth noting that the damage probability of product is larger than that of the tank before e4 occurs. One of the main reasons is that the multilevel Bayesi an network is incapable of inferring the purpose of the attacker until e4 occurs. Another primary reason is that the causes of product damage are more than that of the tank damage. When the incident e4 occurs and is captured, the attack target is evident. Thus, after the 310th minute, the damage probability of the tank is higher than that of the product. Fig. 9 shows that the recovery of f4 or f12 does not reduce the cybersecurity risk, because that pressure is still excessive during this period. The risk value is decreasing as the pressure is reduced under the safe threshold. To illustrate the ability to deal with unknown attacks, the attack nodes a6 and a9 are removed from the multilevel Bayesian network. Thus, the incident prediction module does not know that an attacker can get the administrator authority of the ES through a DoS attack and an IP spoofing attack. In other words, a6 and a9 are unknown attacks to the incident pre- diction module. Additionally, the conditional probability table of the resource node r9 also needs to be modified. Table XI provides the conditional probability table of the resource node r9 before the modification. By removing the third row and the sixth through ninth columns, which are marked with gray, the modified conditional probability table of the resource node r9 can be obtained. Authorized licensed use limited to: Northcentral University. Downloaded on October 19,2021 at 14:01:47 UTC from IEEE Xplore. Restrictions apply.
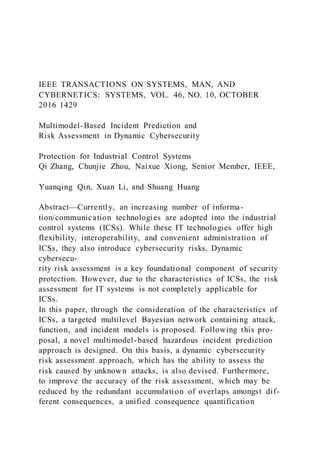
- 40. ZHANG et al.: MULTIMODEL-BASED INCIDENT PREDICTION AND RISK ASSESSMENT 1441 TABLE XI MODIFICATION OF CONDITIONAL PROBABILITY Fig. 10. Comparison of risk curves of two simulation. The same multistep attack is launched to the chemical reac- tor control system again. Since there is no knowledge of attacks a6 and a9, the evidence of a6 and a9 must be removed from the evidence list in Table IX. The cybersecurity risk value is recorded every minute, and then the risk curves of the two simulations are put in one figure, which is shown in Fig. 10. Fig. 10 shows that, before the 120th minute, the risk value of the second simulation is slightly lower than that of the first simulation. The reason is that, without the knowledge of a6 and a9, the probability of an attack obtaining the resource r9 is lower in view of the incident prediction module. After the 120th minute and before the 259th minute, there is a difference between these two risk curves. Since there is no evidence of a6 and a9, the risk value of the second simulation in this range remains unchanged. After the 259th minute, the risk curves of these two simulations overlap. This comparison shows that, without the knowledge of several atom attacks, there is no comparatively large deviation in the result of the risk assess - ment. Therefore, if there are a few unknown atom attacks in a multistep attack, our approach can still generate a relatively accurate risk value. To demonstrate the execution time of our approach, a stochastic evidence generator is designed to test the execution time of our dynamic risk assessment approach. This stochas-
- 41. tic evidence generator can randomly generate an attack or an anomaly evidence every minute. The proportion of evidence is 10%, meaning that the stochastic evidence generator sends an average of one evidence to the risk assessment module every 10 min. The stochastic evidence generator is used to replace the evidence generator in the first simulations, and then the execution times of 5000 calculations are recorded. This simulation is run on a machine with Intel Pentium proces- sor G3220 (3M Cache, 3.00 GHz) and 4 GB DDR3 memory. Fig. 11 shows the distribution of the 5000 execution times. Fig. 11. Distribution of execution time. TABLE XII COMPARISON OF PROPOSED AND OTHER EXISTING RISK ASSESSMENT SOLUTIONS The average execution time of a risk assessment is 0.0941 s, the minimum execution time of a risk assessment is 0.0899 s, and the maximum execution time of a risk assessment is 0.1316 s. Finally, 25 multilevel Bayesian networks with different node sizes are adopted to show the possible upper/lower bounds and the scalability of our approach. The minimum node size is 10, and the maximum node size is 490, which can model extremely complicated control systems. For each multilevel Bayesian network, the risk assessment is repeated 200 times and all the execution times are recorded. Fig. 12 shows the pos - sible upper/lower bounds and the scalability of the proposed risk assessment approach. In Fig. 12, a fitting line y = 0.0019x−0.0175 matches well with the correlation coefficient r = 0.9987. This means that the execution time of the risk assessment scales linearly with
- 42. the increase of the node size of the multilevel Bayesian net- work. The maximum execution time of the multilevel Bayesian network with 490 nodes is 1.094 s. The above simulations show that the proposed risk assess- ment approach can dynamically predict all the potential haz- ardous incidents and generate a cybersecurity risk value by a single inference of the multilevel Bayesian network. Since the multilevel Bayesian network consists of multiple models, the proposed approach can assess the risk caused by unknown attacks without corresponding attack knowledge. The execu- tion time of the multilevel Bayesian network with 64 nodes is less than 150 ms, and the time complexity is O(n), where n is the node number of the multilevel Bayesian network. This feature enables our approach to run on most soft real -time control systems. Authorized licensed use limited to: Northcentral University. Downloaded on October 19,2021 at 14:01:47 UTC from IEEE Xplore. Restrictions apply. 1442 IEEE TRANSACTIONS ON SYSTEMS, MAN, AND CYBERNETICS: SYSTEMS, VOL. 46, NO. 10, OCTOBER 2016 Fig. 12. Upper/lower bounds and scalability of proposed risk assessment. As cybersecurity risk assessment approaches have many dif- ferent application scenarios and a variety of solutions, it is difficult to directly compare our approach with other existing approaches. But, Table XII presents some differences between some published approaches and our approach from the per- spective of ICS cybersecurity risk assessment requirements,
- 43. which are mentioned in Section II-A. VI. CONCLUSION Cybersecurity risk assessment is a key component of cyber- security protection for ICSs. In this paper, a risk assessment approach was proposed based on the multimodel for ICSs, which utilized the attack evidence and system state to predict the occurrence of potential hazardous incidents and gener - ate the cybersecurity risk value dynamically. To begin, a novel multilevel Bayesian network was proposed by consid- ering the characteristics of ICSs, which integrated knowl - edge of attacks, system functions, and hazardous incidents. With the multilevel Bayesian network, the computational complexity of incident prediction was reduced, because the occurrence probabilities of all potential hazardous incidents could be calculated by a single Bayesian inference. Then, the attack knowledge and system knowledge were combined to analyze the potential impact of attacks, so the proposed approach had the ability of assessing the risk caused by unknown attacks. Finally, a unified quantification approach for a variety of consequences of industrial accidents was intro- duced. Furthermore, the proposed approach could eliminate the error of risk caused by the overlaps amongst hazardous incidents. By using a simplified chemical reactor control system in a MATLAB environment, the designed dynamic risk assessment approach was verified. Through the analysis of the simulation results, the proposed approach could adjust the risk value in real-time with the launching of multistep attacks was demon- strated. In addition, the result of the comparative simulation, in which some attack knowledge was removed from the attack level of the multilevel Bayesian network, showed that our approach could calculate the risk caused by unknown attacks. Finally, our approach had low computational complexity, and
- 44. it could calculate probabilities of all the potential hazardous incidents and generate a dynamic cybersecurity risk value in 150 ms. The average computation time of risk assessment scaled linearly with the increase of the node number of the multilevel Bayesian network. Even if the Bayesian network had 400 nodes, which models a complicated control system, this approach still had high computation speed. Current research work has no ability for self-learning, and the subsecond computation time cannot meet some hard real-time systems requirements. In the future, a dynamic cyber- security risk assessment, which can automatically adjust the conditional probability and structure of the multilevel Bayesian network by analyzing the real-time data, will be researched, and several approximate inference methods will be attempted in the risk assessment. ACKNOWLEDGMENT The authors would like to thank the anonymous referees for their helpful comments and suggestions. REFERENCES [1] I. N. Fovino, A. Coletta, A. Carcano, and M. Masera, “Critical state- based filtering system for securing SCADA network protocols,” IEEE Trans. Ind. Electron., vol. 59, no. 10, pp. 3943–3950, Oct. 2012. [2] R. R. R. Barbosa, R. Sadre, and A. Pras, “Flow whitelisting in SCADA networks,” Int. J. Crit. Infrastruct. Protect., vol. 6, nos. 3–4, pp. 150–158, 2013.
- 45. [3] R. Langner, “Stuxnet: Dissecting a cyberwarfare weapon,” IEEE Secur. Privacy, vol. 9, no. 3, pp. 49–51, May/Jun. 2011. [4] A. A. Cárdenas et al., “Attacks against process control systems: Risk assessment, detection, and response,” in Proc. 6th ACM Symp. Inf. Comput. Commun. Security (ASIACCS), Hong Kong, 2011, pp. 355–366. [5] Industrial Control Systems Cyber Emergency Response Team, ICS- CERT Year in Review, Nat. Cybersecurity Commun. Integr. Center, 2013. [6] J. Slay and M. Miller, “Lessons learned from the Maroochy water breach,” in Critical Infrastructure Protection (IFIP International Federation for Information Processing), vol. 253, E. Goetz and S. Shenoi, Eds. New York, NY, USA: Springer, 2008, pp. 73– 82. [7] B. Miller and D. Rowe, “A survey SCADA of and critical infrastructure incidents,” in Proc. 1st Annu. Conf. Res. Inf. Technol., Calgary, AB, Canada, 2012, pp. 51–56. [8] T. M. Chen, “Stuxnet, the real start of cyber warfare?” IEEE Netw., vol. 24, no. 6, pp. 2–3, Nov./Dec. 2010. [9] K. Stouffer, J. Falco, and K. Scarfone, “Guide to i ndustrial
- 46. control sys- tems (ICS) security,” U.S. Dept. Commer., Nat. Inst. Stand. Technol., Gaithersburg, MD, USA, Tech. Rep. 800-82, 2011. [10] Industrial Communication Networks—Network and System Security Part 1-1: Terminology, Concepts and Models, Standard IEC TS 62443-1-1:2009, 2009. [11] M. Ni, J. D. McCalley, V. Vittal, and T. Tayyib, “Online risk-based secu- rity assessment,” IEEE Trans. Power Syst., vol. 18, no. 1, pp. 258–265, Feb. 2003. [12] G. Stoneburner, A. Y. Goguen, and A. Feringa, “Risk management guide for information technology systems,” U.S. Dept. Commer., Nat. Inst. Stand. Technol., Gaithersburg, MD, USA, Tech. Rep. Sp 800- 30, 2002. [13] Framework for Improving Critical Infrastructure Cybersecurity, Nat. Inst. Stand. Technol., Gaithersburg, MD, USA, 2014. Authorized licensed use limited to: Northcentral University. Downloaded on October 19,2021 at 14:01:47 UTC from IEEE Xplore. Restrictions apply. ZHANG et al.: MULTIMODEL-BASED INCIDENT PREDICTION AND RISK ASSESSMENT 1443 [14] A. Shameli-Sendi, N. Ezzati-Jivan, M. Jabbarifar, and M.
- 47. Dagenais, “Intrusion response systems: Survey and taxonomy,” Int. J. Comput. Sci. Netw. Security, vol. 12, no. 1, pp. 1–14, 2012. [15] I. Molloy et al., “Risk-based security decisions under uncertainty,” in Proc. 2nd ACM Conf. Data Appl. Security Privacy, San Antonio, TX, USA, 2012, pp. 157–168. [16] T. Aven and E. Zio, “Some considerations on the treatment of uncer- tainties in risk assessment for practical decision making,” Rel. Eng. Syst. Safety, vol. 96, no. 1, pp. 64–74, 2011. [17] P. D. Ray, R. Harnoor, and M. Hentea, “Smart power grid security: A unified risk management approach,” in Proc. IEEE Int. Carnahan Conf. Security Technol. (ICCST), San Jose, CA, USA, Oct. 2010, pp. 276–285. [18] G. L. L. Reniers and V. Cozzani, Domino Effects in the Process Industries: Modelling, Prevention and Managing. Waltham, MA, USA: Elsevier Sci. Technol., 2013. [19] J. S. Arendt and D. K. Lorenzo, Evaluating Process Safety in the Chemical Industry: A User’s Guide to Quantitative Risk Analysis, vol. 3. New York, NY, USA: Wiley, 2010. [20] H.-Y. Tsai and Y.-L. Huang, “An analytic hierarchy
- 48. process-based risk assessment method for wireless networks,” IEEE Trans. Rel., vol. 60, no. 4, pp. 801–816, Dec. 2011. [21] N. Feng and M. Li, “An information systems security risk assessment model under uncertain environment,” Appl. Soft Comput., vol. 11, no. 7, pp. 4332–4340, 2011. [22] J. Shi, “Security risk assessment about enterprise networks on the base of simulated attacks,” Proc. Eng., vol. 24, no. 1, pp. 272–277, 2011. [23] N. Poolsappasit, R. Dewri, and I. Ray, “Dynamic security risk man- agement using Bayesian attack graphs,” IEEE Trans. Depend. Secure Comput., vol. 9, no. 1, pp. 61–74, Jan./Feb. 2012. [24] M. G. Stewart and M. D. Netherton, “Security risks and probabilistic risk assessment of glazing subject to explosive blast loading,” Rel. Eng. Syst. Safety, vol. 93, no. 4, pp. 627–638, 2008. [25] P. A. S. Ralston, J. H. Graham, and J. L. Hieb, “Cyber security risk assessment for SCADA and DCS networks,” ISA Trans., vol. 46, no. 4, pp. 583–594, 2007. [26] A. A. Cárdenas, S. Amin, and S. Sastry, “Research challenges for the
- 49. security of control systems,” in Proc. HOTSEC, Berkeley, CA, USA, 2008, Art. ID 6. [27] P. Xie, J. H. Li, X. Ou, P. Liu, and R. Levy, “Using Bayesian networks for cyber security analysis,” in Proc. IEEE/IFIP Int. Conf. Depend. Syst. Netw. (DSN), Chicago, IL, USA, Jun. 2010, pp. 211–220. [28] K. Wrona and G. Hallingstad, “Real-time automated risk assessment in protected core networking,” Telecommun. Syst., vol. 45, nos. 2–3, pp. 205–214, 2010. [29] M. Szpyrka, B. Jasiul, K. Wrona, and F. Dziedzic, “Telecommunications networks risk assessment with Bayesian networks,” in Computer Information Systems and Industrial Management (LNCS 8104). Berlin, Germany: Springer, 2013, pp. 277–288. [30] R. Rodriguez, “On qualitative analysis of fault trees using structurally persistent nets,” IEEE Trans. Syst., Man, Cybern., Syst., vol. 46, no. 2, pp. 282–293, Feb. 2016. [31] Q. Meng and X. Qu, “Uncertainty propagation in quantitative risk assess- ment modeling for fire in road tunnels,” IEEE Trans. Syst., Man, Cybern. C, Appl. Rev., vol. 42, no. 6, pp. 1454–1464, Nov. 2012. [32] E. J. Henley and H. Kumamoto, Reliability Engineering
- 50. and Risk Assessment, vol. 193. Englewood Cliffs, NJ, USA: Prentice- Hall, 1981. [33] N. R. Commission et al., “Severe accident risks: An assessment for five U.S. nuclear power plants,” Div. Syst. Res., U.S. Nucl. Regul. Comm., Washington, DC, USA, Tech. Rep. NUREG-1150, 1990. [34] M. Stamatelatos et al., “Probabilistic risk assessment proce- dures guide for NASA managers and practitioners,” Office Safety Mission Assurance, NASA Headquarters, Washington, DC, USA, Tech. Rep. NASA/SP-2011-3421, 2011. [35] J. H. Purba, “A fuzzy-based reliability approach to evaluate basic events of fault tree analysis for nuclear power plant probabilistic safety assessment,” Ann. Nucl. Energy, vol. 70, pp. 21–29, Aug. 2014. [36] A. Neri et al., “Developing an event tree for probabilistic hazard and risk assessment at Vesuvius,” J. Volcanol. Geoth. Res., vol. 178, no. 3, pp. 397–415, 2008. [37] N. Siu, “Risk assessment for dynamic systems: An overview,” Rel. Eng. Syst. Safety, vol. 43, no. 1, pp. 43–73, 1994. [38] H. W. Lewis et al., “Risk assessment review group report to the U.S.
- 51. nuclear regulatory commission,” IEEE Trans. Nucl. Sci., vol. 26, no. 5, pp. 4686–4690, Oct. 1979. [39] C.-S. Cho, W.-H. Chung, and S.-Y. Kuo, “Cyberphysical security and dependability analysis of digital control systems in nuclear power plants,” IEEE Trans. Syst., Man, Cybern., Syst., vol. 46, no. 3, pp. 356–369, Mar. 2016. [40] M. P. Fanti, G. Iacobellis, and W. Ukovich, “A risk assessment frame- work for Hazmat transportation in highways by colored Petri nets,” IEEE Trans. Syst., Man, Cybern., Syst., vol. 45, no. 3, pp. 485–495, Mar. 2015. [41] C. Alberts, A. Dorofee, J. Stevens, and C. Woody, Introduction to the OCTAVE Approach, CERT Coord. Center, Pittsburgh, PA, USA, 2003. [42] B. A. Gran, R. Fredriksen, and A. P.-J. Thunem, “An approach for model-based risk assessment,” in Computer Safety, Reliability, and Security (LNCS 3219), M. Heisel, P. Liggesmeyer, and S. Wittmann, Eds. Berlin, Germany: Springer, 2004, pp. 311–324. [43] J. O. Aagedal et al., “Model-based risk assessment to improve enter- prise security,” in Proc. 6th Int. Enterp. Distrib. Object Comput. Conf. (EDOC), Lausanne, Switzerland, 2002, pp. 51–62.
- 52. [44] S. H. Houmb, F. den Braber, M. S. Lund, and K. Stølen, “Towards a UML profile for model-based risk assessment,” in Proc. Crit. Syst. Develop. Workshop (UML), Dresden, Germany, 2002, pp. 79– 91. [45] D. Codetta-Raiteri and L. Portinale, “Dynamic Bayesian networks for fault detection, identification, and recovery in autonomous spacecraft,” IEEE Trans. Syst., Man, Cybern., Syst., vol. 45, no. 1, pp. 13– 24, Jan. 2015. [46] D. Heckerman, J. S. Breese, and K. Rommelse, “Decision- theoretic troubleshooting,” Commun. ACM, vol. 38, no. 3, pp. 49–57, Mar. 1995. [47] A. Volkanovski, M. Čepin, and B. Mavko, “Application of the fault tree analysis for assessment of power system reliability,” Rel. Eng. Syst. Safety, vol. 94, no. 6, pp. 1116–1127, 2009. [48] I. H. Fajardo and L. Dueñas-Osorio, “Probabilistic study of cascad- ing failures in complex interdependent lifeline systems,” Rel. Eng. Syst. Safety, vol. 111, pp. 260–272, Mar. 2013. [49] S. Cheng et al., “Application of fault tree approach for technical assess- ment of small-sized biogas systems in Nepal,” Appl. Energy, vol. 113,
- 53. pp. 1372–1381, Jan. 2014. [50] A. Bobbio, L. Portinale, M. Minichino, and E. Ciancamerla, “Improving the analysis of dependable systems by mapping fault trees into Bayesian networks,” Rel. Eng. Syst. Safety, vol. 71, no. 3, pp. 249–260, 2001. [51] C. Huang and A. Darwiche, “Inference in belief networks: A procedural guide,” Int. J. Approx. Reason., vol. 15, no. 3, pp. 225–263, 1996. [52] G. F. Cooper, “The computational complexity of probabilistic infer- ence using Bayesian belief networks,” Artif. Intell., vol. 42, nos. 2–3, pp. 393–405, 1990. [53] M. Rausand, Risk Assessment: Theory, Methods, and Applications, vol. 115. New York, NY, USA: Wiley, 2013. [54] A. Clinton, Annual Safety Performance Report 2013/14, Rail Safety Stand. Board, London, U.K., 2014. [55] S. Kaplan and B. J. Garrick, “On the quantitative definition of risk,” Risk Anal., vol. 1, no. 1, pp. 11–27, 1981. [56] K. Murphy, “The Bayes net toolbox for MATLAB,” Comput. Sci. Stat., vol. 33, no. 2, pp. 1024–1034, 2001.
- 54. Qi Zhang received the B.S. degree in automa- tion from the Huazhong University of Science and Technology, Wuhan, China, in 2011, where he is currently pursuing the Ph.D. degree in control sci- ence and control engineering with the School of Automation. His current research interests include risk assess- ment and decision-making for industrial control systems. Chunjie Zhou received the M.S. and Ph.D. degrees in control theory and control engineering from the Huazhong University of Science and Technology, Wuhan, China, in 1991 and 2001, respectively. He is currently a Professor with the School of Automation, Huazhong University of Science and Technology. His current research interests include safety and security control of industrial control sys- tems, theory and application of networked control systems, and artificial intelligence. Authorized licensed use limited to: Northcentral University. Downloaded on October 19,2021 at 14:01:47 UTC from IEEE Xplore. Restrictions apply. 1444 IEEE TRANSACTIONS ON SYSTEMS, MAN, AND CYBERNETICS: SYSTEMS, VOL. 46, NO. 10, OCTOBER 2016 Naixue Xiong (M’08–SM’12) received the Ph.D. degree in dependable networks from the Japan Advanced Institute of Science and Technology,
- 55. Nomi, Japan, in 2008. He is current a Full Professor with the Department of Business and Computer Science, Southwestern Oklahoma State University, Weatherford, OK, USA. Before he attends Colorado Technical University, Colorado Springs, CO, USA, he was with Wentworth Technology Institution, Georgia State University, Atlanta, GA, USA, for several years. His current research interests include cloud computing, security and dependabil- ity, parallel and distributed computing, networks, and optimization theory. Prof. Xiong has been the General Chair, the Program Chair, the Publicity Chair, a Program Chairs and Organization Chairs members of over 100 inter- national conferences, and a Reviewer of about 100 international journals, including the IEEE JOURNAL ON SELECTED AREAS IN COMMUNICATIONS, the IEEE TRANSACTIONS ON SYSTEMS, MAN, AND CYBERNETICS—PART A: SYSTEMS AND HUMANS, the IEEE TRANSACTIONS ON SYSTEMS, MAN, AND CYBERNETICS—PART B: CYBERNETICS, the IEEE TRANSACTIONS ON SYSTEMS, MAN, AND CYBERNETICS—PART C: APPLICATIONS AND REVIEWS, the IEEE TRANSACTIONS ON COMMUNICATIONS, the IEEE TRANSACTIONS ON MOBILE COMPUTING, and the IEEE TRANSACTIONS ON PARALLEL AND DISTRIBUTED SYSTEMS. He serves as
- 56. the Editor-in- Chief, an Associate Editor or an Editor Member for over ten international journals, an Associate Editor for the IEEE TRANSACTIONS ON SYSTEMS, MAN, AND CYBERNETICS: SYSTEMS, the Editor-in-Chief for the Journal of Parallel and Cloud Computing, and a Guest Editor for over ten international journals, including the Sensor Journal, Journal on Wireless Networks, and ACM Springer Mobile Networks and Applications. Yuanqing Qin received the M.S. and Ph.D. degrees in control theory and control engineering from the Huazhong University of Science and Technology, Wuhan, China, in 2003 and 2007, respectively. He is currently a Lecturer with the Department of Control Science and Engineering, Huazhong University of Science and Technology. His current research interests include networked control system, artificial intelligent, and machine vision. Xuan Li received the B.S. degree in automation from Dalian Maritime University, Dalian, China, in 2012. He is currently pursuing the Ph.D. degree in control science and control engineering with the School of Automation, Huazhong University of Science and Technology. His current research interests include industrial communication, industrial control system, and asset assessment. Shuang Huang received the B.S. and Ph.D. degrees
- 57. in automation from the Huazhong University of Science and Technology, Wuhan, China, in 2009 and 2015, respectively. His current research interests include industrial communication and industrial control system with special focus on security. Authorized licensed use limited to: Northcentral University. Downloaded on October 19,2021 at 14:01:47 UTC from IEEE Xplore. Restrictions apply. << /ASCII85EncodePages false /AllowTransparency false /AutoPositionEPSFiles false /AutoRotatePages /None /Binding /Left /CalGrayProfile (Gray Gamma 2.2) /CalRGBProfile (sRGB IEC61966-2.1) /CalCMYKProfile (U.S. Web Coated 050SWOP051 v2) /sRGBProfile (sRGB IEC61966-2.1) /CannotEmbedFontPolicy /Warning /CompatibilityLevel 1.4 /CompressObjects /Off /CompressPages true /ConvertImagesToIndexed true /PassThroughJPEGImages true /CreateJobTicket false /DefaultRenderingIntent /Default /DetectBlends true /DetectCurves 0.0000 /ColorConversionStrategy /LeaveColorUnchanged /DoThumbnails false /EmbedAllFonts true /EmbedOpenType false
- 58. /ParseICCProfilesInComments true /EmbedJobOptions true /DSCReportingLevel 0 /EmitDSCWarnings false /EndPage -1 /ImageMemory 1048576 /LockDistillerParams true /MaxSubsetPct 100 /Optimize true /OPM 0 /ParseDSCComments false /ParseDSCCommentsForDocInfo false /PreserveCopyPage true /PreserveDICMYKValues true /PreserveEPSInfo false /PreserveFlatness true /PreserveHalftoneInfo true /PreserveOPIComments false /PreserveOverprintSettings true /StartPage 1 /SubsetFonts false /TransferFunctionInfo /Remove /UCRandBGInfo /Preserve /UsePrologue false /ColorSettingsFile () /AlwaysEmbed [ true /Arial-Black /Arial-BoldItalicMT /Arial-BoldMT /Arial-ItalicMT /ArialMT /ArialNarrow /ArialNarrow-Bold /ArialNarrow-BoldItalic /ArialNarrow-Italic /ArialUnicodeMS
- 61. /TimesNewRomanMT-ExtraBold /TimesNewRomanPS-BoldItalicMT /TimesNewRomanPS-BoldMT /TimesNewRomanPS-ItalicMT /TimesNewRomanPSMT /Times-Roman /Trebuchet-BoldItalic /TrebuchetMS /TrebuchetMS-Bold /TrebuchetMS-Italic /Tunga-Regular /Verdana /Verdana-Bold /Verdana-BoldItalic /Verdana-Italic /Vrinda /Webdings /Wingdings2 /Wingdings3 /Wingdings-Regular /ZapfChanceryITCbyBT-MediumItal /ZWAdobeF ] /NeverEmbed [ true ] /AntiAliasColorImages false /CropColorImages true /ColorImageMinResolution 200 /ColorImageMinResolutionPolicy /OK /DownsampleColorImages true /ColorImageDownsampleType /Bicubic /ColorImageResolution 300 /ColorImageDepth -1 /ColorImageMinDownsampleDepth 1 /ColorImageDownsampleThreshold 1.50000 /EncodeColorImages true
- 62. /ColorImageFilter /DCTEncode /AutoFilterColorImages false /ColorImageAutoFilterStrategy /JPEG /ColorACSImageDict << /QFactor 0.76 /HSamples [2 1 1 2] /VSamples [2 1 1 2] >> /ColorImageDict << /QFactor 0.76 /HSamples [2 1 1 2] /VSamples [2 1 1 2] >> /JPEG2000ColorACSImageDict << /TileWidth 256 /TileHeight 256 /Quality 15 >> /JPEG2000ColorImageDict << /TileWidth 256 /TileHeight 256 /Quality 15 >> /AntiAliasGrayImages false /CropGrayImages true /GrayImageMinResolution 200 /GrayImageMinResolutionPolicy /OK /DownsampleGrayImages true /GrayImageDownsampleType /Bicubic /GrayImageResolution 300 /GrayImageDepth -1 /GrayImageMinDownsampleDepth 2 /GrayImageDownsampleThreshold 1.50000 /EncodeGrayImages true /GrayImageFilter /DCTEncode /AutoFilterGrayImages false /GrayImageAutoFilterStrategy /JPEG /GrayACSImageDict <<
- 63. /QFactor 0.76 /HSamples [2 1 1 2] /VSamples [2 1 1 2] >> /GrayImageDict << /QFactor 0.76 /HSamples [2 1 1 2] /VSamples [2 1 1 2] >> /JPEG2000GrayACSImageDict << /TileWidth 256 /TileHeight 256 /Quality 15 >> /JPEG2000GrayImageDict << /TileWidth 256 /TileHeight 256 /Quality 15 >> /AntiAliasMonoImages false /CropMonoImages true /MonoImageMinResolution 400 /MonoImageMinResolutionPolicy /OK /DownsampleMonoImages true /MonoImageDownsampleType /Bicubic /MonoImageResolution 600 /MonoImageDepth -1 /MonoImageDownsampleThreshold 1.50000 /EncodeMonoImages true /MonoImageFilter /CCITTFaxEncode /MonoImageDict << /K -1 >> /AllowPSXObjects false /CheckCompliance [ /None ] /PDFX1aCheck false
- 64. /PDFX3Check false /PDFXCompliantPDFOnly false /PDFXNoTrimBoxError true /PDFXTrimBoxToMediaBoxOffset [ 0.00000 0.00000 0.00000 0.00000 ] /PDFXSetBleedBoxToMediaBox true /PDFXBleedBoxToTrimBoxOffset [ 0.00000 0.00000 0.00000 0.00000 ] /PDFXOutputIntentProfile (None) /PDFXOutputConditionIdentifier () /PDFXOutputCondition () /PDFXRegistryName () /PDFXTrapped /False /CreateJDFFile false /Description << /CHS <FEFF4f7f75288fd94e9b8bbe5b9a521b5efa76840020004100640 06f006200650020005000440046002065876863900275284e8e55 464e1a65876863768467e5770b548c62535370300260a853ef4ee5 4f7f75280020004100630072006f0062006100740020548c002000 410064006f0062006500200052006500610064006500720020003 5002e003000204ee553ca66f49ad87248672c676562535f00521b5 efa768400200050004400460020658768633002> /CHT <FEFF4f7f752890194e9b8a2d7f6e5efa7acb76840020004100640 06f006200650020005000440046002065874ef69069752865bc66 6e901a554652d965874ef6768467e5770b548c52175370300260a
- 67. 02000700065007500760065006e0074002000ea00740072006500 20006f007500760065007200740073002000640061006e0073002 0004100630072006f006200610074002c002000610069006e0073 0069002000710075002700410064006f006200650020005200650 06100640065007200200035002e00300020006500740020007600 65007200730069006f006e007300200075006c007400e90072006 900650075007200650073002e> /ITA (Utilizzare queste impostazioni per creare documenti Adobe PDF adatti per visualizzare e stampare documenti aziendali in modo affidabile. I documenti PDF creati possono essere aperti con Acrobat e Adobe Reader 5.0 e versioni successive.) /JPN <FEFF30d330b830cd30b9658766f8306e8868793a304a30883073 53705237306b90693057305f002000410064006f0062006500200 050004400460020658766f8306e4f5c6210306b4f7f75283057307 e305930023053306e8a2d5b9a30674f5c62103055308c305f00200 05000440046002030d530a130a430eb306f300100410063007200 6f0062006100740020304a30883073002000410064006f0062006 5002000520065006100640065007200200035002e003000204ee5 964d3067958b304f30533068304c3067304d307e3059300230533 06e8a2d5b9a3067306f30d530a930f330c8306e57cb30818fbc307f 3092884c3044307e30593002> /KOR <FEFFc7740020c124c815c7440020c0acc6a9d558c5ec0020be44 c988b2c8c2a40020bb38c11cb97c0020c548c815c801c73cb85c00 20bcf4ace00020c778c1c4d558b2940020b3700020ac00c7a50020 c801d569d55c002000410064006f0062006500200050004400460 020bb38c11cb97c0020c791c131d569b2c8b2e4002e0020c774b8 07ac8c0020c791c131b41c00200050004400460020bb38c11cb29 40020004100630072006f0062006100740020bc0f002000410064 006f00620065002000520065006100640065007200200035002e0 0300020c774c0c1c5d0c11c0020c5f40020c2180020c788c2b5b2c 8b2e4002e> /NLD (Gebruik deze instellingen om Adobe PDF-documenten te maken waarmee zakelijke documenten betrouwbaar kunnen
- 68. worden weergegeven en afgedrukt. De gemaakte PDF- documenten kunnen worden geopend met Acrobat en Adobe Reader 5.0 en hoger.) /NOR <FEFF004200720075006b0020006400690073007300650020006 9006e006e007300740069006c006c0069006e00670065006e0065 002000740069006c002000e50020006f007000700072006500740 0740065002000410064006f006200650020005000440046002d00 64006f006b0075006d0065006e00740065007200200073006f006 d002000650072002000650067006e0065007400200066006f0072 0020007000e5006c006900740065006c006900670020007600690 073006e0069006e00670020006f00670020007500740073006b00 7200690066007400200061007600200066006f007200720065007 4006e0069006e006700730064006f006b0075006d0065006e0074 00650072002e0020005000440046002d0064006f006b0075006d0 065006e00740065006e00650020006b0061006e002000e5007000 6e00650073002000690020004100630072006f006200610074002 00065006c006c00650072002000410064006f0062006500200052 0065006100640065007200200035002e003000200065006c006c0 0650072002e> /PTB <FEFF005500740069006c0069007a00650020006500730073006 1007300200063006f006e00660069006700750072006100e700f5 0065007300200064006500200066006f0072006d0061002000610 0200063007200690061007200200064006f00630075006d006500 6e0074006f0073002000410064006f00620065002000500044004 600200061006400650071007500610064006f0073002000700061 0072006100200061002000760069007300750061006c0069007a0 06100e700e3006f002000650020006100200069006d0070007200 650073007300e3006f00200063006f006e0066006900e10076006 50069007300200064006500200064006f00630075006d0065006e 0074006f007300200063006f006d0065007200630069006100690 073002e0020004f007300200064006f00 630075006d0065006e00 74006f00730020005000440046002000630072006900610064006 f007300200070006f00640065006d002000730065007200200061 0062006500720074006f007300200063006f006d0020006f00200
- 70. 90020004100630072006f0062006100740020006f006300680020 00410064006f00620065002000520065006100640065007200200 035002e00300020006f00630068002000730065006e0061007200 65002e> /ENU (Use these settings to create PDFs that match the "Recommended" settings for PDF Specification 4.01) >> >> setdistillerparams << /HWResolution [600 600] /PageSize [612.000 792.000] >> setpagedevice 978-1-5386-7531-1/18/$31.00 ©2018 IEEE Intelligent System for Risk Identification of Cybersecurity Violations in Energy Facility Gaskova Daria, Aleksei Massel Laboratory of Information Systems in energetics Melentiev Energy Systems Institute of SB RAS Irkutsk, Russia [email protected], [email protected] Abstract—The article describes risk-based approach intended for analyzing threat and assessing risk of cybersecurity violations in the energy facilities. In the energy sector this approach should
- 71. consider harm produced by damage or demolition of the object using quantitative and qualitative parameters. It is based on the probability of damage or destruction of the facility resulting in the cascade failure. It can be employed for developing the information-analytical system aimed to monitor cybersecurity violations in the energy sector. Keywords—cybersecurity; critical infrastacture; risk assessment; intelligent system I. INTRODUCTION The Russian energy infrastructure is truly significant, as it combines power plants and energy systems, including energy transporting main lines. The critical infrastructures are currently being explored [1-2]. Because the energy penetrated all life spheres in the modern society, it is believed to be the vital component of national security [3]. It is noteworthy, that energy security (ES) makes an important part of Russia’s national security. The development of Smart Grid conception in Russia exacerbates the problem of cybersecurity in energy. ES threats are traditionally classified into five main groups: economic, social-political, technogenous, natural and managerial-legal [4]. This threat list was supplemented with the cybersecurity threats [2], their implementation possibly provoking serious emergency situations in energy fraught with drastic reduction of energy resources to be provided to consumers. The rapid spread of the computer environment, development of information technologies and the trend of transition to intellectual energy make the cyber threats most notable tactical threats of ES. As a matter of fact, both systematic preventive measures of cyber threats averting and continuous protection updating are underrated. It can lead to significant long-term deficit of energy supply, which negative
- 72. impacts depend on cyber threats scale and damage. Complimented by the reasons above, the authors propose to create an intelligent system capable to identify risk of cybersecurity violations in the energy facility based on a risk- based approach. II. ENERGY AS AN IMPORTANT CRITICAL INFRASTRUCTURE Critical infrastructure is part of civil infrastructure, which makes up a combination of physical or virtual systems and means that are important for the country, as their failure or destruction can trigger disastrous consequences in the fields of defense, economy, and health and nation security [1]. The requirements for ensuring cybersecurity in the energy sector were formed in the foreign countries [5]. Actually in Russia the normative framework for ensuring cybersecurity in critical infrastructures is beginning to be formed. Information protection in the automatic process control system in energy is usually provided on the basis of the Federal Service for Technical and Export Control of Russia order № 31 [6]. This order establishes requirements to ensure protection of information in critical objects from illegal actions, including computer attacks. The development of the normative framework of the information protection in critical infrastructure is that the project stage of the Federal Law “On the Security of the Critical Information Infrastructure of the Russian Federation (RF)”. The draft law establishes the main directions and principles to ensuring security of critical information infrastructure, the government agent powers of the RF in this area, and also the rights, duties and responsibilities of owners, communications, providers and operators and also state information system operators that provide the functioning