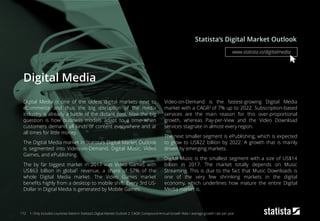
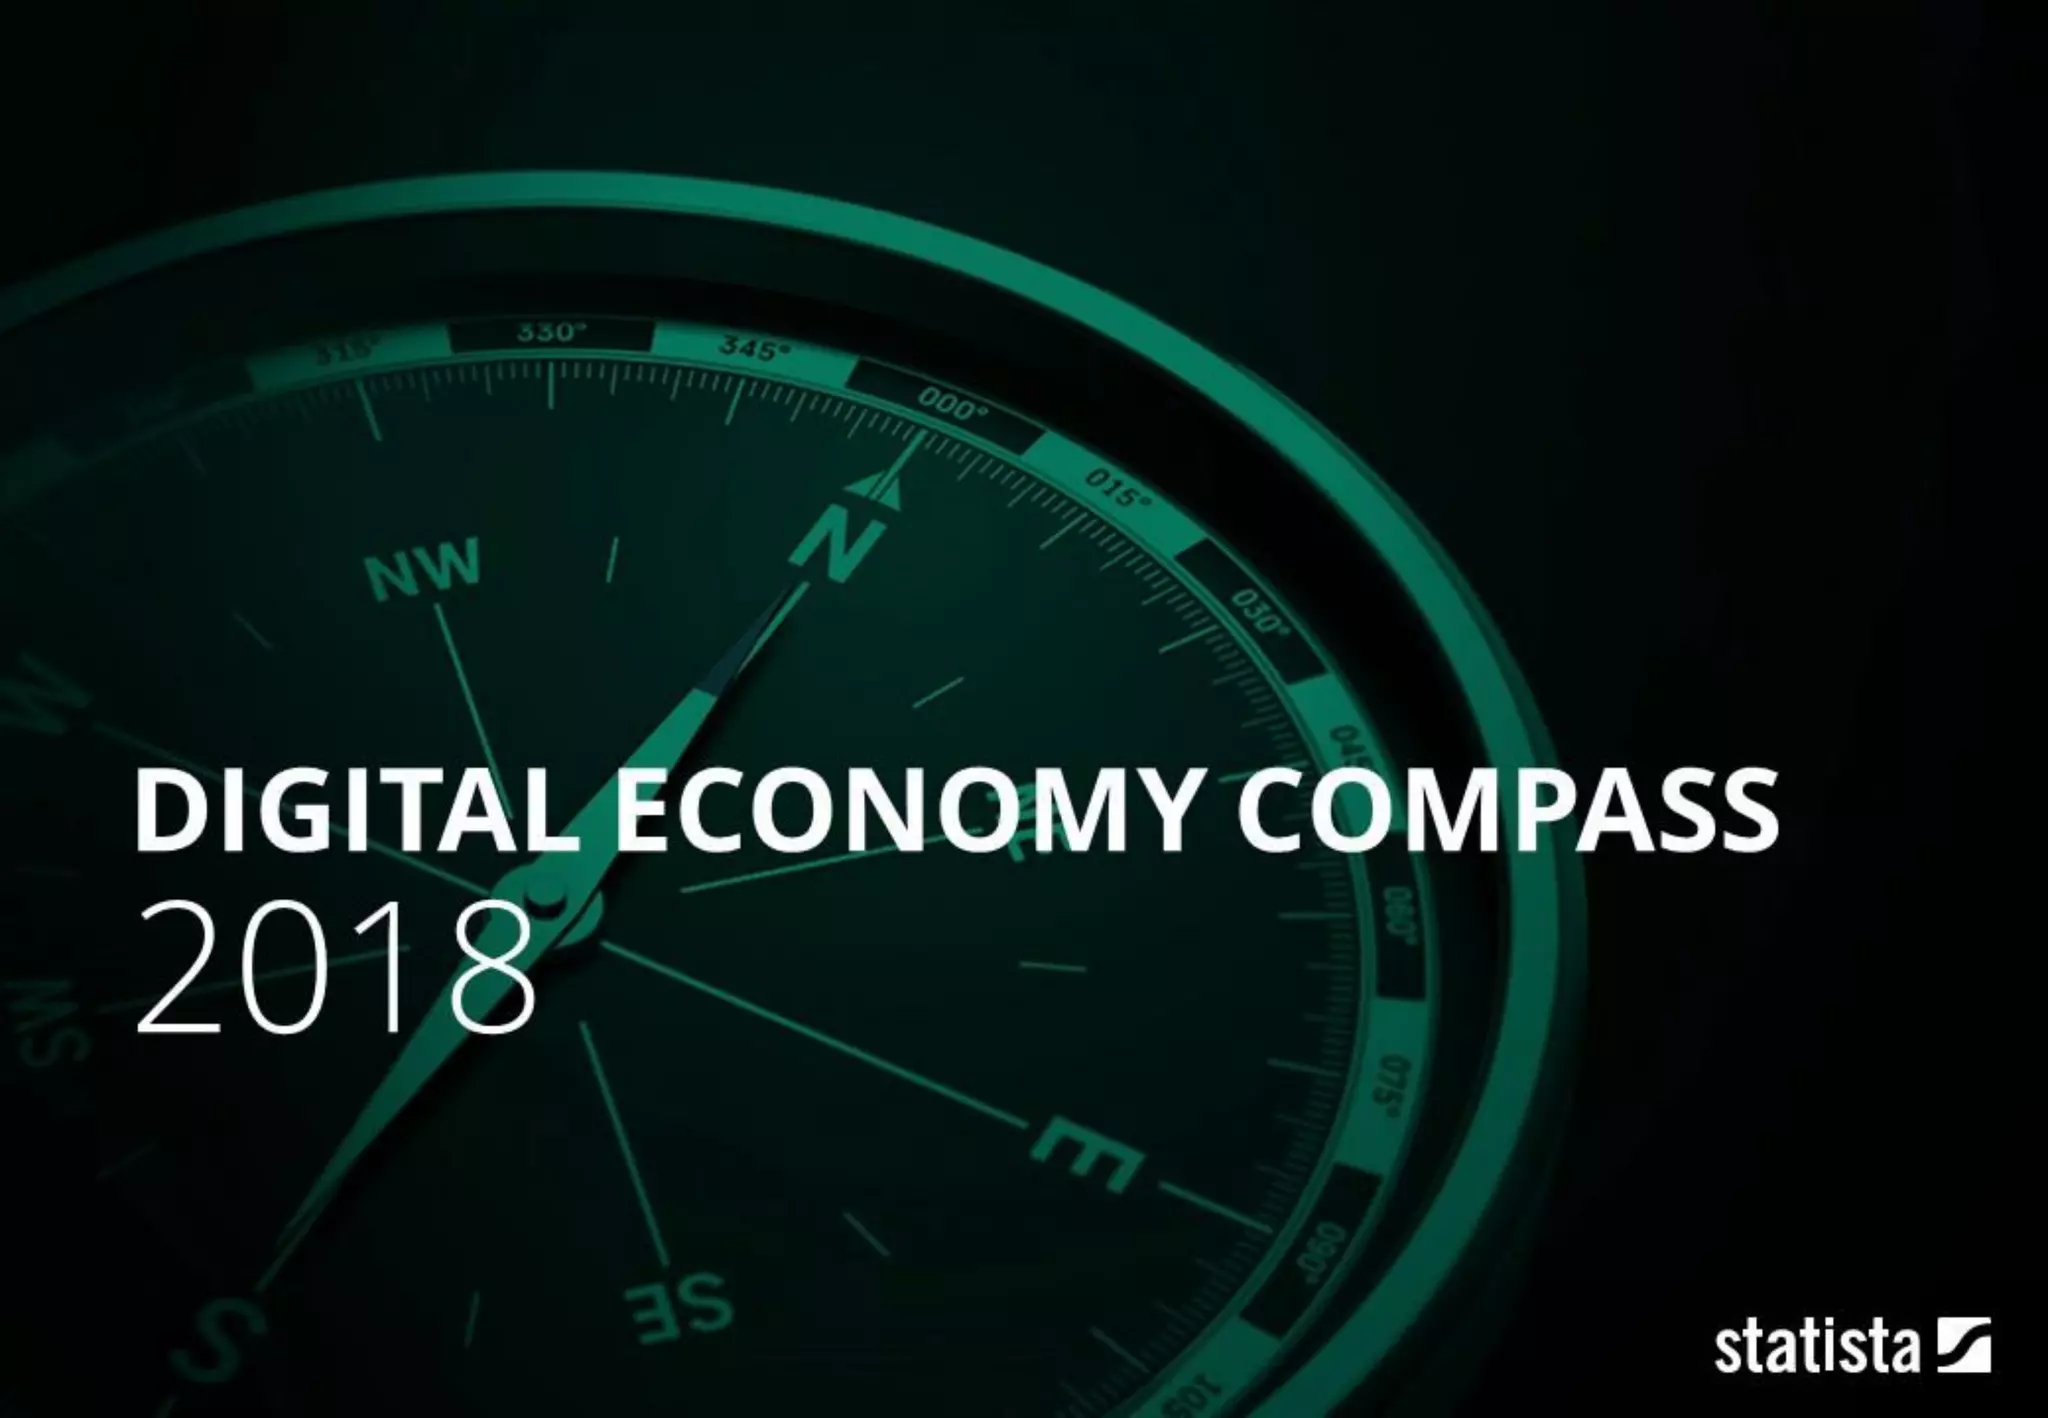
Digital technologies simplify our lives and open doors to unprecedented business opportunities. Innovative companies disrupt traditional industries and challenge their incumbents. This transformative power involves both opportunities and risks – for all of us. Regardless of whether we are eager or reluctant: We have to keep pace, otherwise we will be left behind.
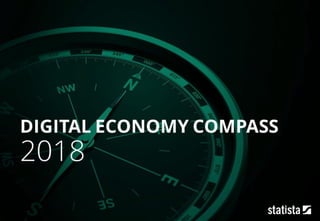
The Digital Economy Compass presents facts about what we consider the industries’ most relevant topics and trends at the moment. It covers global trends such as the rise of voice assistants and smart speakers, as well as detailed information on different digital markets.
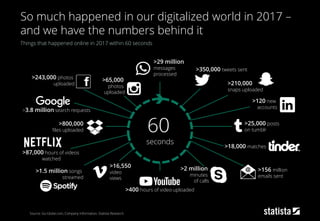
The result of the research is a 200+ slide presentation on the global digital economy. It provides a comprehensive overview of one of the hottest topics of our time
![[…] We believe voice is the most
natural user interface and can really
improve the way people interact with
technology.
Dawn Brun
Public relations Senior Manager at Amazon](https://image.slidesharecdn.com/digitaleconomycompass2018-180720222901/85/Digital-Economy-Compass-2018-13-320.jpg)


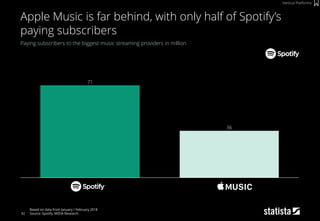
![[…] I don’t know where streaming will go in the future. The
analytics that we’re seeing tell us that streaming is the next
thing, and downloads are going down. I feel like with the
history of this platform, from vinyl to where we are now, it just
seems like the next logical step.
Shawn Corey Carter (Jay-Z)
Rapper, producer, CEO of Def Jam Records](https://image.slidesharecdn.com/digitaleconomycompass2018-180720222901/85/Digital-Economy-Compass-2018-87-320.jpg)


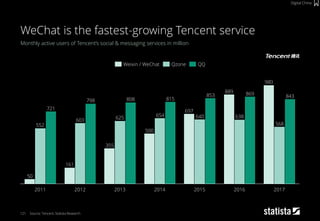
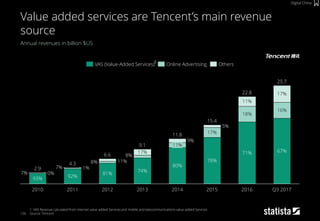
![Tencent is great at monetizing eyeballs […].
That’s their core competency. They are making
tons of money by scraping together pennies from
tiny transactions.”
Jeff Walters
Partner and Managing Director of BCG Beijing Office](https://image.slidesharecdn.com/digitaleconomycompass2018-180720222901/85/Digital-Economy-Compass-2018-120-320.jpg)

![131
Furthermore, the world’s largest retailer in terms of
revenues, Wal-Mart Inc., has embedded the digital mindset
into their corporate DNA: They changed their official name
from “Wal-Mart Stores” to “Wal-Mart”, in order to show their
effort to address all customers and abandon the apparent
focus on offline-clients.
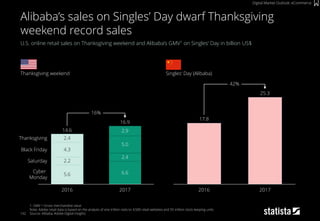
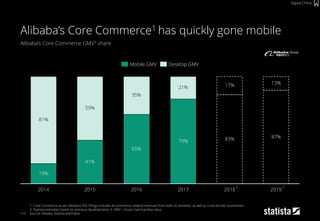
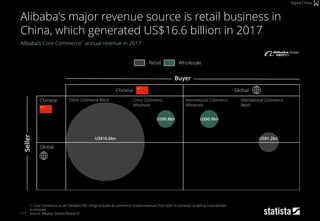
We observe a similar development in China: eCommerce
giant Alibaba is gradually expanding towards the offline
world and opening brick-and-mortar stores. According to
Daniel Zhang, CEO of Alibaba, “[…] the future of new retail
will be a harmonious integration of online and offline, and
Hema is a prime example of this evolution that's taking
place”.
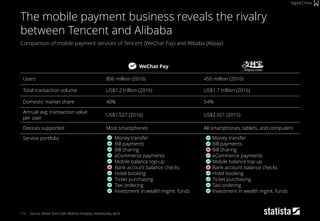
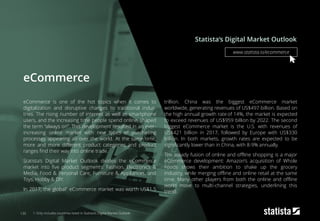
However, the Chinese eCommerce market is not at all a
“one company show”. In order to rival Alibaba, China’s
second biggest online marketplace JD.com partnered with
internet giant Tencent Holding. They invested more than
US$800 million in Vipshop, one of the leading online
discount retailers for luxury brand products.
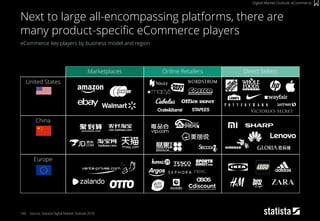
Next to those most recent developments, we expect some
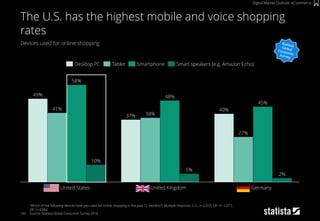
major trends to take off in the near future: mobile and
marketplaces.
Merchants increasingly understand the benefits of agile and
short-acting platforms. Hence, they develop applications
specifically designed for the mobile experience, rather than
optimizing web shops for mobile devices.
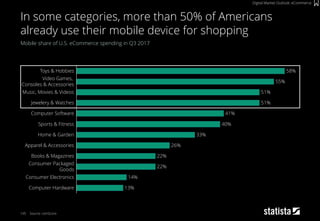
We expect marketplaces to become the best choice for
almost all product categories (with the exception of only a
few) with proven winners in terms of price or product
quality. In categories relating to personal style or taste, such
as clothing or interior design, independent players will
always have their share of the market.
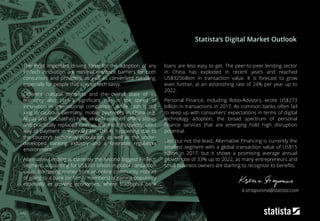
Statista‘s Digital Market Outlook
f.wegener@statista.com](https://image.slidesharecdn.com/digitaleconomycompass2018-180720222901/85/Digital-Economy-Compass-2018-131-320.jpg)