3. The value of 15% is reasonable, a fast verification could be done using the Carnot cycle, which is the most
theoretically efficient heat‐engine cycle, to calculate a theoretical maximum efficiency using the formula:
1
Using as an average (see appendix) temperature of the cooling liquid in the radiator of 365.09 °K
(Darryl, n.d.), and as an average (see appendix) gasoline ignition temperature of 541.50 °K (Shani,
2003) the result is:
32.55%
Which is a greater value than the efficiency used in the calculation and thus it is concordant with the law of
thermodynamics.
The value of 8.65 could be considered the energy required to move the mass of the Smart fortwo car
for 100 km, therefore, because of the similarities between the two models, it could be assumed that the
energy output of the electric model is substantially equal. So, it is possible to calculate the energy efficiency
tank‐to‐wheel for the electric model:
8.65
16.15
53.57%
In this way the efficiencies and energies required for the two models are known.
3.2. Battery efficiency
While for the gasoline model the calculated step is adequate to describe the losses from the pump, one
only step is not sufficient to consider all the losses of an electric engine from the electric plug; the battery
efficiency must be assessed. The available data are:
Battery capacity 17.6
Charger power 3.3
Average see appendix charging time 7
(Smart, 2015).
From the last two values it is possible to calculate the energy required for a full charge:
3.30 7.00 23.10
And therefore the battery efficiency:
17.60
23.10
76.19%
From which is possible to calculate the energy required from the plug:
16.15 76.19% 21.19
The efficiency of the last steps could be multiplied to the previous ones to get a cumulative efficiency:
76.19% 53.57% 40.81%
For the next stages this calculation will be implicit for both the cars, and the results will be shown in the
final table.
4. 3.3. Fuel distribution
To have the fuel available for the car, another stage is required: distribution.
Transport, storage and distribution of gasoline have an overall efficiency of 99.5% (Wang, 2003); therefore
the energy required before distribution for the gasoline engine is:
57.67
99.50 %
57.95
On the other hand, the efficiency of the distribution of electricity from the power plant through a typical
European grid is 93% (Svensson, et al., 2007), thus the energy needed is:
21.19
93.00 %
22.79
3.4. Fuel generation
The car fuel must be generated by conversion from another form of energy, in the case of gasoline, petrol
refining is the necessary stage and it has an estimated average (see appendix) efficiency of 85.5% (Wang,
2008), then, considering the energy required for the gasoline refinery, the total amount of energy grows
into:
57.95
85.50 %
67.78
The electricity which charges the battery has to be generated in a power plant, the range of different kind
of electric energy plants is ample. Usually, for most of the energy resources, the base is the same: the
energy resource is burnt to obtain heat which generates high pressurized steam from water, this is used to
rotate a turbine connected to a magnet electric generator the output of which is finally electricity (Macchi,
et al., 2015). This is the classic method to generate electricity from fossil fuel, or from renewable energy
resources such as bio‐diesels and biomass, but it is very similar to the method used for nuclear, geo‐
thermal and ocean‐thermal energy as well. However, for the other common renewable energy resources
the aim is similarly to actuate the rotor of an electric generator, for example using wind, water or tides.
Different approaches are generally required to use solar energy with photovoltaic panels and hydrogen in
fuel‐cells (Vignolini & Ferrazza, 2015).
Obviously every different energy plant has its own efficiency, but to have a first comparison with gasoline, a
good approach is to consider oil power plants, so that it is possible to evaluate which is the most efficient
car starting from the same resource: petroleum.
A commonly used measure of energy efficiency of power plants is the heat rate, “the amount of energy
used by an electrical generator or power plant to generate one kilowatt‐hour (kWh) of electricity” (U.S.
Energy Information Administration, 2015). This value is expressed in British thermal units (Btu) per net kWh
generated, that is the electricity provided to the grid after accounting the energy required for the plant
itself and for its equipment, such as fuel feeding systems, boiler water pumps, cooling equipment, and
pollution control devices (U.S. Energy Information Administration, 2015). The average heat rate for
petroleum plants, including distillate fuel oil (all diesel and No. 1 and No. 2 fuel oils) and residual fuel oil
(No. 5 and No. 6 fuel oils and bunker C fuel oil, jet fuel, kerosene, petroleum coke, and waste oil, is 10,713
Btu (U.S. Energy Information Administration, 2015); but considering a combined cycle the value became
9,937 Btu (U.S. Energy Information Administration, 2015), a reasonable choice is to use the average value
of 10,325 Btu.
To express the efficiency as a percentage, the equivalent Btu content of a kWh of electricity, which is 3,412
Btu (U.S. Energy Information Administration, 2015), must be divided by the heat rate:
5. 3,412
10,325
33.09%
Therefore, the energy required before the conversion is:
22.79
33.09%
68.86
A previous stage required is the refining of petrol into a usable form such as residual oil, which has an
average (see appendix) efficiency of 93.2%, thus the energy needed grows:
68.86
93.20 %
73.88
3.5. Petrol transport
The transportation of petroleum from the well to the refinery or to the energy plant could be done by
tankers, barges, rail tank cars, tank trucks, and pipelines (U.S. Environmental Protection Agency, 2008). The
efficiency of the process depends on the mode of transportation and evidently on the distance covered,
but an average value for the overall transportation and storage efficiency could be 99% (Wang, 2003).
Consequently the energies required for the gasoline engine and for the electric engine become
respectively:
67.78
99.00%
68.47
73.88
99.00%
74.63
3.6. Petrol recovery
The extraction of petroleum from the ground, which is the final stage, requires energy as well, this means
that another efficiency is needed for the calculation. Also in this step, the value depends on the technology
used, but an overall average (see appendix) value of 97.5% could be used (Wang, 2002).
Hence the total energies, in the usual order, are:
68.47
97.50%
70.22
74.63
97.50%
76.54
3.7. Overall efficiency
At this point every step from well to wheel is covered, thus it is possible to calculate the overall efficiencies
of the two cars multiplying each single efficiency. The results are:
15.00% 99.50% 85.50% 99.00% 97.50% 12.32%
53.57% 76.19% 93.00% 33.09% 93.20% 99.00% 97.50% 11.30%
6. Here it is a recapitulatory table of all the steps, the energy required after them, their efficiencies and the
cumulative efficiencies:
Gasoline Electricity
Stage Energy
(kWh)
η
stage
(%)
η
tot
(%)
Stage Energy
(kWh)
η
stage
(%)
η
tot
(%)
100 km 8.65 100 km 8.65
Gasoline engine 57.67 15.00 15.00 Electric engine 16.15 53.57 53.57
Battery 21.19 76.19 40.81
Gasoline distribution 57.95 99.50 14.92 Electricity distribution 22.79 93.00 37.96
Petrol refinery 67.78 85.50 12.76 Petrol power plant 68.86 33.09 12.56
Petrol refinery 73.88 93.20 11.71
Petrol transport 68.47 99.00 12.63 Petrol transport 74.63 99.00 11.59
Petrol recovery 70.22 97.50 12.32 Petrol recovery 76.54 97.50 11.30
4. CO2 emissions
After stating the efficiencies of the two cars and therefore the total amount of energy required, it is now
possible to evaluate the CO2 emissions. To do that the first step is to calculate the quantity of petroleum in
the ground. Considering as the average (see appendix) petroleum energy content 44 MJ/kg (12.22 kWh/kg)
(Shepelsky, 2002), from a simple division it is easy to calculate in the two cases, respectively:
70.22
12.22
5.75
76.54
12.22
6.26
Knowing that the approximate percent of Carbon atoms in crude oil is 85% (Shepelsky, 2002), it is possible
to calculate the weight of C in the petroleum needed:
5.75 85.00% 4.88
6.26 85.00% 5.32
Then, dividing these quantities in grams by the molecular weight of C, the moles of C are given:
4,880
12.01
406.62
5,320
12.01
443.21
The number of moles of C in a perfect combustion is the same number of moles of CO2 generated,
therefore it is finally possible to evaluate the amount of emissions, multiplying the number of moles by the
molecular weight of CO2:
7. 406.62 44.01
1000
17.89
443.21 44.01
1000
19.51
5. Alternatives
After having evaluated the CO2 emissions related to the two different cars starting from petroleum, it
would be interesting to consider different kind of fuels.
5.1. Cellulosic ethanol
One of the most interesting alternatives for a combustion engine is using a renewable fuel, amongst them
ethanol is a formidable alternative. This fuel could be used mixed in small percentage with gasoline or used
almost pure in particular engines very similar to the usual gasoline ones (Alternative Fuels Data Center ‐
U.S. Department of Energy, 2014). Ethanol could be made starting from every part of plant which contain
sugars through a process called biochemical conversion; probably one of the most promising is the
cellulosic ethanol, the raw material of which is a non‐food based feedstock, that includes crop residues,
wood residues, dedicated energy crops, and industrial and other wastes, all of those are composed of
cellulose, hemicellulose, and lignin (Alternative Fuels Data Center ‐ U.S. Department of Energy, 2014).
The first step is to evaluate the quantity of ethanol required to drive for 100 km. It is possible to consider
that the amount of energy requested to the ethanol is the same requested to the gasoline which was
57.67kWh; therefore, considering the average (see appendix) energy content of 80,430 Btu/gal (6.23
kWh/l) (Alternative Fuels Data Center ‐ U.S. Department of Energy, 2014), it is possible to calculate the
required volume of ethanol:
57.67
6.23
9.26
This quantity is burned in the combustion engine to produce the energy required, which obviously releases
carbon dioxide, but this is balanced by the CO2 captured when the crops are grown to make ethanol
(Alternative Fuels Data Center ‐ U.S. Department of Energy, 2014). Therefore the only emissions to consider
are those generated in the plants farming.
Considering that the average (see appendix) ethanol yield per dry tonne of tree/grass is 89.5 gal/ton
(338.79 l/ton) (Wang, 2002) it is easy to calculate the tonnes of dry tree/grass:
9.26
338.79
0.03
The average (see appendix) energy required in the farm per dry tonne of tree/grass is 227,875 Btu/ton
(66.78 kWh/ton) (Wang, 2002), which converted in kg of petroleum is:
66.78
12.22
5.46
Therefore the kg of petroleum required to have the needed amount of ethanol is:
8. 0.03 5.46 0.15
It is now possible to assess, as previously, the carbon dioxide emissions, passing through the calculation of
the content of C:
85% 0.15 0.13
0.13 1000
12.01
10.57
Finally the amount of CO2 generated using cellulosic ethanol for driving 100 km is:
10.57 44.01
1000
0.46
5.2. Electricity generation mix
For the previous calculation of the energy required in the electric car it has been considered that the
amount of energy was generated totally from petrol plants. These plants, as seen, have not a good overall
efficiency and, using petrol, they release a large amount of carbon dioxide; therefore an important
correction could be made using the average CO2 emission of the European mix of energy resources used
for electricity production, which is 0.43 kg/kWh (Svensson, et al., 2007), multiplying it by the electricity
released in the distribution previously calculated:
0.43 22.79 9.75
5.3. Electricity renewably generated
Changing the kind of energy plant for the electricity production, as seen, remarkably affects the calculation
of carbon dioxide emission. The best case is using renewable energy such as wind, solar power, tides, etc.;
the energy converted from these is CO2 free because there is no combustion, therefore the emissions,
apart from the energy required to build the plant, is equal to zero.
6. Conclusions
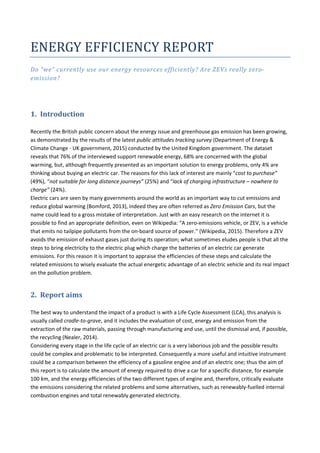
Before illustrating the conclusions it would be useful to recapitulate the results with few graphics.
Table 1
0
20
40
60
80
100
100 km Engine (Battery) Distribution (Electricity
generation)
Petrol
refinery
Petrol
transport
Petrol
recovery
kWh
Energy
Gasoline
Electricity
10. The difference does not seem so big comparing the overall losses:
100% 11.3%
100% 12.32%
1 1.16%
It is interesting to observe in table 2 that the less efficient steps for each car are the engine for the gasoline
car and the electricity generation for the electric car. These are the steps that if developed could increase
the cumulative efficiencies the most.
Unfortunately, for the law of thermodynamics, the maximum efficiency of an internal combustion engine is
represented by the Carnot efficiency that, as previously calculated, is around 32.55%, which substituted in
the calculation could raise the cumulative efficiency to 26.73%, almost twice the previous value, and
therefore could reduce the emission by 50%. That is positive, but very implausible to realise and still
dangerous for the greenhouse gas emission problem.
Differently, the problem of electric car lies in the electricity generation, which even at the moment, with
the existent technology, could be totally solved using renewable energy resources which do not release any
carbon dioxide emission while working (manufacturing emissions are not considered in this report). The
current problem is that electricity is largely used all over the world for different uses and the request could
not be solved just with renewable energy. For this reason, most of the countries use a mix of resources,
that anyway generates less emissions in comparison to an only petrol generated electricity.
9.75
19.5
50%
Considering the average EU mix, the CO2 is decreased by 50%, which would make the electric car preferable
to the gasoline one.
Since not having a strong impact of renewable energy on the electricity generation mix, a very important
alternative could be renewable fuels, that, because of their fast life cycle, could be considered CO2 free.
Thus, the only emissions are those related to the energy used for farming, which, even if petrol generated,
release a small quantity of carbon dioxide compared to the other solutions contemplated. A problem of
these resources is the repercussion on agriculture, because growing them could steal space to food farms,
but this issue could be partially solved by cellulosic ethanol which could be made from agricultural residues
and wastes.
Table 4
0
5
10
15
20
25
gasoline electricity cellulosic ethanol electricity mix renewable electricity
kg
CO2 emission