Microbial community analysis in anaerobic palm oil mill effluent (pome) waste...
ASGCT 2015 Poster (Final)
1. CONSISTENCY OF RESEARCH GRADE LENTIVIRAL VECTOR
MANUFACTURING OVER 60 BATCHES
Wesley Gorman, Pranali Buch, Hannah Maheno, Michael Kuczewski, Nolan Sutherland, Logan Trimble,
Dominic Mancini, Mark D. Angelino, Robert Kutner, Maria Mercedes Segura
bluebird bio, Cambridge, MA
Abstract: 467
Abstract
Process Yields and Robustness
Conclusions
Lentiviral vectors (LV) have shown to be efficient gene transfer
vehicles in a growing list of gene therapy applications and are
currently being evaluated in clinical trials. bluebird bio has
developed a GMP manufacturing process for large-scale
production of third generation VSV-G pseudotyped HIV-1 based
lentiviral vectors to support such trials. To cope with the
increased demand for research-grade LV material for preclinical
testing, a mirror small-scale manufacturing model is used at
bluebird bio to generate LV batches at scales ranging between
2 and 10L. The manufacturing process is based on the transient
transfection of adherent HEK 293T cells with packaging and
envelope plasmids along with a transfer plasmid coding for a
gene of interest. Harvested supernatants are subsequently
concentrated and purified using a combination of membrane
filtration and chromatography steps. Analytical data obtained
over 60 batches of LV manufactured using this process
indicates that it consistently delivers high quality vector
preparations with an infectious titer > 1E+08 TU/mL and a
particle/infectious ratio between 100-500, emphasizing the
robustness of the process design. Process yields typically
range between 30 and 60 %, according to both infectious
particle determinations using the HOS cell titer assay and total
particle determinations as assessed by p24 ELISA. A linear
correlation between harvested supernatant LV titers and final
product LV titers is observed. This process is used to generate
LV preparations to support ALD, β-Thalassemia, Sickle Cell
Disease and CAR-T programs.
Introduction
Impact of Construct Selection
0
1
2
3
4
5
6
7
Harvest Titer Frequency of Occurrence
0
1
2
3
4
5
6
7
Final Titer Frequency of Occurrence
0
2
4
6
8
10
12
14
16
18
20
10% 20% 30% 40% 50% 60% 70% 80%
TotalNumberofBatches
Process Recovery (%)
Final Process Yield by HOS Titer
LV Manufacturing Process
Purification Formulation
Ion-
Exchange
Tangential
Flow
Filtration
Cell
Factories
Transient
transfection
Final
Product
Harvest
FilterFilter
Manufacturing of VSV-G pseudotyped LV is achieved by
transfecting adherent HEK 293T cells growing in cell factories
with packaging and envelope plasmids along with a transfer
plasmid coding for a gene of interest. Harvested supernatants
are concentrated and purified using ion exchange
chromatography and Tangential Flow Filtration and
subsequently formulated in a suitable buffer for ex vivo
transduction of target cells .
84.5%
2.8%
8.5% 4.2%
Pass
Failure due to low yield
Failure due to low harvest titer
Failed due to other reasons (i.e.
operator error )
LV Harvest Titers predict
Final Product Titers
y = 6E-06x + 18.107
R² = 0.8979
0
20
40
60
80
100
120
140
160
180
0.00E+00 5.00E+06 1.00E+07 1.50E+07 2.00E+07 2.50E+07
Harvestp24concentration(ng/mL)
Harvest infectious titer (TU/mL)
Harvest Infectious Titer vs. p24 Concentration
Evaluation of process performance over 60 batches of LV
manufactured at bluebird bio is shown in this work. The 60
batches represent over 30 different constructs manufactured at
scales ranging from 2 to 10L. By analyzing harvest and final
product LV infectious titers representing upstream and
downstream sample points in the manufacturing process, it
was concluded that specific constructs have a direct impact on
harvest titer and the harvest titer has in turn a direct impact on
final product titer. These results collectively indicate that most
process variability impacting infectious titers lie on the
upstream process rather that the downstream processing
operations. Harvest infectious titers correlated well with p24
concentrations and, furthermore, evaluation of process yields
around multiple operating scales confirms the robustness of its
design regardless of construct selection or scale being
considered.
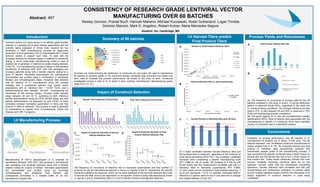
Summary of 60 batches
(A) A linear correlation between harvest infectious titers and
final product titers is observed regardless of the construct or
scale being considered (R²=0.797). The correlation coefficient
increases when considering a specific manufacturing scale
(R²= 0.866 for the 2L scale). (B) Analysis of 6 lots by p24
ELISA shows that this measurement correlates well with LV
infectious titers in harvested supernatants (R²= 0.898).
(C) p24 values can be converted to total particles assuming 1
ng of p24 represents 1.2x10⁷ LV particles. Estimated total-to-
infectious LV particle ratios for the 6 runs were 84 on average
and ranged between 70 and 103.
(A) The frequency of occurrence of process yield for the 60
batches evaluated in this study is shown. A normal distribution
pattern is observed (mode 40%), regardless of the scale and
LV construct being considered. The average infectious process
yield is 37%. A yield between 30 and 50% is observed in 75%
of all runs emphasizing process consistency.
(B) The great majority of LV lots met pre-determined release
specifications (85%). Most lot failures were associated with the
manufacturing of specific LV constructs which were identified
as poor LV producers due to unidentified reasons.
A
B
A
B
C
BA
BA
DC
12%
(7 runs)
3%
(2 runs)
7%
(4 runs)
8%
(5 runs)
13%
(8 runs)
5%
(3 runs)
52%
(31 runs)
Construct 1
Construct 2
Construct 3
Construct 4
Construct 5
Construct 6
Other
65%
(39 runs)7%
(4 runs)
13%
(8 runs)
15%
(9 runs)
2L
3 L
4 L
10 L
1.41E+08
2.84E+08
4.21E+08
3.28E+08
1.20E+08
6.98E+08
0E+00
1E+08
2E+08
3E+08
4E+08
5E+08
6E+08
7E+08
8E+08
9E+08
1E+09
FinalProductTiters(TU/mL)
Impact of Construct Selection to Final
Process Yield by Infectious Titer
1.08E+07
1.89E+07
1.44E+07
6.07E+06
4.22E+06
2.18E+07
0.0E+00
5.0E+06
1.0E+07
1.5E+07
2.0E+07
2.5E+07
3.0E+07
HarvestTiters(TU/mL)
Impact of Construct Selection to Harvest
Yield by Infectious Titer
0.00E+00
2.00E+08
4.00E+08
6.00E+08
8.00E+08
1.00E+09
1.20E+09
1.40E+09
1.60E+09
1.80E+09
0.00E+00 1.00E+07 2.00E+07 3.00E+07 4.00E+07 5.00E+07
FInalProductInfectiousTiter(TU/mL)
Harvest Infectious Titer (TU/mL)
Harvest vs. Final Product Infectious Titers
2L scale
3 L scale
4 L scale
10 L scale
R² = 0.797
(all 60 runs)
R² = 0.866
0
20
40
60
80
100
120
Run 1 Run 2 Run 3 Run 4 Run 5 Run 6
HarvestP/IRatio
Harvest Particle to Infectivity Ratio over Six Runs
Summary pie charts showing the distribution of constructs (A) and scales (B) used to manufacture
60 batches of research grade LV for preclinical studies. Analytical data extracted from these runs
were used to evaluate the process performance, as shown in this body of work. Constructs
investigated include a total of 30 of which 6 were routinely manufactured. Manufacturing scales
range from 2 to 10 L.
The frequency of occurrence of infectious titer in harvested supernatants and final purified LV
products for the 60 manufactured batches is shown in Figures A and B, respectively. No specific
distribution patterns are observed, which can be partly attributed to the fact that infectious titers both
in harvest and final product are dependent on the specific construct being manufactured as shown
in Figures C and D, respectively. Bars in C and D indicate construct average titer observed.