PEDIATRIC CLINICAL TRIAL SIMULATION OF AN ABUSE-DETERRENT OPIOID
•
1 like•136 views

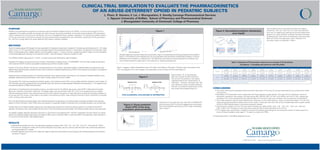
A CTS was performed to estimate the sample size and optimal plasma sampling times that sufficiently characterize the PK parameters (CL, Vd) from a single dose of an abuse-deterrent (AD) opioid in pediatric subjects.
Recommended

Recommended
More Related Content
What's hot
What's hot (19)
Viewers also liked
Similar to PEDIATRIC CLINICAL TRIAL SIMULATION OF AN ABUSE-DETERRENT OPIOID
Similar to PEDIATRIC CLINICAL TRIAL SIMULATION OF AN ABUSE-DETERRENT OPIOID (20)
Recently uploaded
Recently uploaded (20)
PEDIATRIC CLINICAL TRIAL SIMULATION OF AN ABUSE-DETERRENT OPIOID
- 1. CLINICALTRIAL SIMULATIONTO EVALUATETHE PHARMACOKINETICS OF AN ABUSE-DETERRENT OPIOID IN PEDIATRIC SUBJECTS L. Pham, R. Stevens,V. Lai, J. Bhongsatiern, E. Kendig Camargo Pharmaceutical Services L. Nguyen University of Buffalo; School of Pharmacy and Pharmaceutical Sciences J. Bhongsatiern University of Cincinnati; College of Pharmacy PURPOSE Pediatric drug development programs are required under the Pediatric Research Equity Act (PREA). A clinical trial simulation (CTS) is suggested to accurately estimate the sample size which ensures the precise estimation of important pharmacokinetic (PK) parameters such as clearance (CL) and volume of distribution (Vd) of an investigational drug in pediatric population. For practical and ethical reasons, a CTS was performed to estimate the sample size and optimal plasma sampling times that sufficiently characterize the PK parameters (CL, Vd) from a single dose of an abuse-deterrent (AD) opioid in pediatric subjects. METHODS Opioid immediate-release (IR) dosage forms are prescribed for moderate to severe pain in pediatrics. The doses are administered as 0.1 - 0.2 mg/kg every 4 hours. A CTS was performed using D-optimality-based limited sampling schemes in combination with Bayesian and nonlinear mixed- effects modeling approaches. Eligible patients would be pediatrics aged 2 - 12 years, inclusive, undergoing inpatient surgery who are anticipated to have postsurgical pain requiring an oral opioid for at least 1 dose (according to institution standard of care). Two different pediatric age groups (2 - 5 and 6 - 12 years) were evenly distributed by age and gender. Population PK analysis was performed using nonlinear mixed effects modeling version 7.3 (NONMEM® ). The first-order conditional estimation with interaction (FOCEI) method was applied to develop base and final covariate models. Protocol of the study (STUDY) was the only covariate performed in this analysis. Generalized additive modeling (GAM) and stepwise forward addition/backward elimination procedures were used to assess the statistical significance (p<0.001) of the covariate via changes in the objective function value (OFV). Diagnostic plots, including population and individual predicted versus observed drug concentrations, and conditional weighted residuals versus population predicted drug concentrations, were used to visually inspect the fit of the models. The population PK model was evaluated by bootstrap analysis, visual predictive check (VPC), and normalized prediction distribution errors (npde). For VPC and npde, data of drug obtained from the pivotal BE study was used as an external dataset (756 plasma concentrations; n = 42 subjects) and a thousand simulations (n=1000) were performed. Optimization of sampling times and sampling windows was determined for the different age groups using ADAPT 5 (Biomedical Simulation Resource, University of Southern California). The design region was set between 0 and 10 h, and 3 to 5 sampling times per patient. Optimal sampling windows were obtained around the fixed D-optimal time points for each age group by allowing the assay variability to be set less than 5% across a wide range of the opioid’s concentrations (a 95% mean efficiency level and uniform distribution of samples within windows were assumed). Only one optimal plasma sampling design was implemented across the age groups. The optimal plasma sampling schedules were selected based on Fisher information matrix (FIM) criteria, and precision of population-based PK estimates (ratio of standard deviation over the estimate). Sample sizes for the different pediatric age groups were determined using Phoenix NLME simulations based on a confidence interval (CI) approach. Simulations were used to determine the power of the final sampling windows design with different sample sizes for each age group. For pediatric modeling, allometric exponents were fixed. CL and Vd terms were scaled by WT0.75 and WT1.0 respectively. The final criterion for sample sizes for the different pediatric age groups was based on 80% power to achieve a 95% CI within 60-140% of the geometric mean estimate of CL and Vd for the AD opioid in each pediatric group. RESULTS • Optimal blood samples from the CTS estimated 5 samples per subject (0.50 - 0.53, 1.25 - 1.32, 1.50 - 1.54, 4.47 - 4.63 and 8.30 - 8.36 h). • The final one-compartment model with first order absorption rate constant, lag time, and first order elimination rate constant best described the drug population PK in adults. • Standard diagnostic plots of the final model with regard to observed concentrations versus predicted and individual predicted concentrations are shown in Figure 1. Figure 1 suggests a slight underprediction bias at the high concentrations (60 ng/mL). However, given the purpose of the CTS, the histograms of CL and V appear to be reasonable to move forward with the model (Figure 2). Approximately 7% of the observed data were outside the 90% prediction intervals and the prediction was slightly underestimated at the concentrations of 60 ng/mL. However, since less than 10% were observed outside the 90% prediction intervals, the predictive performance of the final model was accepted (Figure 3). CONCLUSIONS • This study confirmed that population pharmacokinetic parameters of the drug can be best described by one-compartment model with lag time. • Estimations of PK parameters were in agreement with those reported in public domain. The mean (%CV) of clearance, volume of distribution, absorption rate constant, and lag time are 98.4 (36.5%), 563.1 (31.4%), 6.24 (105%), and 0.44 (21.4%), respectively. Goodness of fit criteria revealed that the predicted data from the final model was consistent with the observed concentrations. • The model evaluation demonstrated reliability and robustness of the model based on results of bootstrap analysis. The VPC and npde showed good predictive performance of the model. In particular, less than 10% of the simulated data were located outside the 5th to 95th quantile range in the external evaluation dataset. • Optimal blood samples from the CTS estimated 5 samples per subject (0.50 - 0.53, 1.25 - 1.32, 1.50 - 1.54, 4.47 - 4.63 and 8.30 - 8.36 h) and 14 subjects in each age group would provide the best estimates for CL and Vd. • CTS findings were instrumental in helping to construct the optimal study design for the timing and number of blood draws for a future AD opioid pediatric study, ages 2 - 12 years to comply with PREA. Corresponding Author: lpham@camargopharma.com Standard diagnostics between observed concentrations (ng/mL) and predicted and individual predicted concentrations (ng/mL). Concentrations were predicted from the drug population pharmacokinetic model (fasted condition). A red line represents a line of identity or a reference line. The data points were nearly symmetric along the line of identity with some shifted towards the observations in the observed vs. individual predicted plot. 1.888.451.5708 www.camargopharma.com Figure 1 Figure 2 ETA1=CLEARANCE; ETA2=VOLUME OF DISTRIBUTION Normalized prediction distribution error (npde) from simulated data (n=1000). Upper panel: a quantile- quantile plot (QQ-plot) of the distribution of the npde against the theoretical distribution and a histogram of empirical cumulative distribution of the npde; Lower panel: scatterplots of npde with the respective time and predicted concentrations (DV). In each plot, approximated prediction intervals are shown in blue and pink: the line y=x in the QQ-plot; the shape of the normal distribution in the histogram; the lines corresponding to y=0 and the critical values 5% and 95% in scatterplots. Closed circles represent observed drug concentrations. Figure 4: Normalized prediction distribution error (npde) Five sampling times and sampling windows per subject (0.50-0.53, 1.25-1.32, 1.50-1.54, 4.47-4.63, and 8.30-8.36 hour) and 14 subjects per treatment group were determined based on the criteria that 95% confidence interval of estimates of clearance (CL) and volume of distribution (Vd) were within 60% and 140% of the geometric mean. Example of 10 simulation results is presented in Table 1. Table 1: Estimation of PK parameter values from an example of 10 simulations (14 patients – 5 sampling time points for each PK profile) Trials 1 2 3 4 5 6 7 8 9 10 CL (L/hr) 99.39 (83.6-118.8) 76.73 (62.2-94.7) 80.9 (61.5-106.4) 74.89 (60.80-92.3) 101.91 (80.9-128.4) 100.5 (81.8-123.4) 130.4 (99.0-171.7) 100.5 (80.3-125.7) 96.20 (85.2-108.6) 127.53 (97.9-166.1) 84.2-118.8% 81.0-123.4% 76.1-131.5% 81.2-123.2% 79.4-126.0% 81.4-122.8% 75.9-131.7% 79.9-125.1% 88.6-112.9% 76.8-130.2% Vd (L) 457.48 (367.1-570.1) 517.4 (403.8-663.0) 498.36 (432.7-574.0) 556.8 (476.6-650.5) 582.13 (454.9-745.0) 637.72 (527.7-770.7) 582.8 (490.5-692.5) 505.0 (426.2-598.5) 499.3 (399.8-623.6) 543.3 (455.9-647.5) 80.2-124.6% 78.0-128.1% 86.8-115.2% 85.6-116.8% 78.1-128.0% 82.7-120.8% 84.2-118.8% 84.4-118.5% 80.1-124.9% 83.9-119.2% Target 95% confidence interval within 60% and 140% of the geometric mean estimates of clearance (CL) and volume of distribution (Vd) in each pediatric trial with at least 80% power; Reported values in geometric mean (95% confidence interval), % of geometric mean estimates. The simulation-based diagnostics of drug concentrations (ng/mL) and time (hours; h), n=1000. Lines represent simulated data; dashed lines are 50th and 10th- 90th quantiles; solid line is 5th- 95th quantiles; open circles represent observed concentrations; observations outside the 90% prediction intervals = ~7% Figure 3: Visual predictive check (VPC) of the drug population pharmacokinetic Distribution of the npde with the mean (SE) of 0.099±0.031 and the variance (SE) of 0.73±0.04 suggests that the accuracy level of the predictive performance of the model is reasonably good. Figure 4