SETAC Poster Presentation Holly Pearson final reformatted margin
EDTA vs Acid Digestion Heavy Metal Analysis
1. Introduction
With the growing expansion of industrialized
processes that result in the spread of heavy
metals within our ambient environment, the
need to identify and quantitate such metals is
becoming increasingly important.
In this research study, we quantify the
abilities of two analytical techniques to
effectively measure heavy metal concentrations
in soil:
Ethylenediamine tetraacetic acid (EDTA)
extraction is a simple, safe procedure that uses
EDTA as the chelating agent to sequester free
metal ions and ultimately measure their
concentrations. Its shortcoming is that it cannot
complex with metal ions adsorbed onto soil
particulate.
Acid digestion is an involved, delicate
procedure that uses concentrated nitric acid and
hydrogen peroxide to disrupt all metal-soil
interactions and ultimately allow for total
quantification of metal ions. Its shortcoming is
that the procedure is time-consuming and
potentially hazardous.
Evaluation of EDTA Extraction vs.
Acid Digestion Analytical Techniques
Letch Radomirov
Research Mentor: Dr. Lisa Ponton
Chemistry Department, Baldwin Wallace University. Berea, Ohio 44017
Conclusion
EDTA extraction is a very simple method
that can be used to measure metals in the
mobile phase of soil matter. Its procedure is
ideal for bulk-sample analyses for free metal
ions and its results display a high level of
accuracy and precision with respect to the
targeted metals. Yet this method is not useful
for total metal analyses, as EDTA is unable to
extract metals from the solid phase of soil
particulate.
Acid digestion is a very laborious method
that can be used to measure total metal
concentrations within soil, though its results are
somewhat imprecise. This is attributed to the
fact that homogeneity is generally not obtained
in soil-metal mixtures with regard to the solid
phase.
In summary of the data, EDTA will always
yield a lesser amount of metal concentration
than acid digestion. Thus, EDTA extraction and
acid digestion both have their specific uses in
analytical chemistry.
For further information
For more information regarding this study,
please contact Letch Radomirov at
lradomir13@mail.bw.edu.
For more information regarding analytical
chemistry, contact Dr. Lisa Ponton of the
Baldwin Wallace University Chemistry
Department at lponton@bw.edu.
Materials and Methods
A 50 mg/kg copper-soil mixture was used as the
analytical standard. Copper standard solutions
ranging from 0.5 to 8.0 ppm were used to
generated a calibration curve. Following each
method, samples were filtered via 47 mm
millipore filter funnel. All samples were
analyzed using a Perkin-Elmer Flame Atomic
Absroption Spectrometer (FAAS).
EDTA Extraction (EE):
Ten milliliters of 0.1 M EDTA, pH 10 were
added to one gram of standard. The solution
was lightly stirred for approximately two hours
to from the product shown in figure 1.
Acid Digestion (AD):
Ten milliliters of 1:1 concentrated HNO3 was
added to one gram of standard. The solution
was heated and refluxed at ~95 °C until brown
fumes dissipated. Thirty percent H2O2 was then
added in 1 mL portions for up to 10 mL. The
resulting solution was evaporated to ~5 mL for
filtration.
Fig.1. Structure of EDTA complexed with a Metal Ion
Results
0
20
40
60
80
100
120
1 2 3 4 5 6 7 8 9 10
AmountCopper(µg)
Sample Number
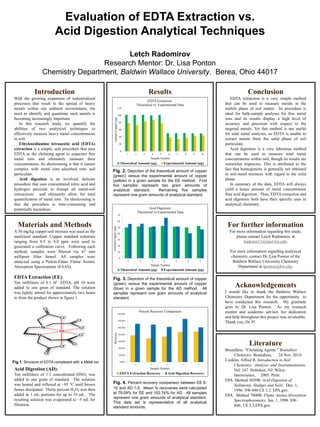
EDTA Extraction:
Theoretical vs. Experimental Data
Theoretical Amount (µg) Experimental Amount (µg)
Fig. 2. Depiction of the theoretical amount of copper
(green) versus the experimental amount of copper
(yellow) in a given sample for the EE method. First
five samples represent two gram amounts of
analytical standard. Remaining five samples
represent one gram amounts of analytical standard.
0
10
20
30
40
50
60
70
1 2 3 4 5 6 7
AmountCopper(µg)
Sample Number
Acid Digestion:
Theoretical vs Experimental Data
Theoretical Amount (µg) Experimental Amount (µg)
Fig. 3. Depiction of the theoretical amount of copper
(green) versus the experimental amount of copper
(blue) in a given sample for the AD method. All
samples represent one gram amounts of analytical
standard.
Acknowledgements
I would like to thank the Baldwin Wallace
Chemistry Department for the opportunity to
have conducted this research. My gratitude
goes to Dr. Lisa Ponton. As my research
mentor and academic adviser, her dedication
and help throughout this project was invaluable.
Thank you, Dr. P!
Literature
Boundless. “Chelating Agents.” Boundless
Chemistry. Boundless, 24 Nov. 2014.
Conklin, Alfred R. Introduction to Soil
Chemistry: Analysis and Instrumentation.
Vol. 167. Hoboken, NJ: Wiley-
Interscience, 2005. Print.
EPA. Method 3050B: Acid Digestion of
Sediments, Sludges and Soils. Dec. 1,
1996. SW-846 Ch 3.2: EPA.gov.
EPA. Method 7000B: Flame AtomicAbsorption
Spectrophotometry. Jan. 1, 1998. SW-
846, Ch 3.3;EPA.gov.
Fig. 4. Percent recovery comparison between EE 6-
10 and AD 1-5. Mean % recoveries were calculated
at 79.09% for EE and 102.74% for AD. All samples
represent one gram amounts of analytical standard.
This data set is representative of all analytical
standard amounts.
0.00%
20.00%
40.00%
60.00%
80.00%
100.00%
120.00%
140.00%
1 2 3 4 5
Recovery
Sample Number
Percent Recovery Comparison
EDTA Extraction Recovery Acid Digestion Recovery