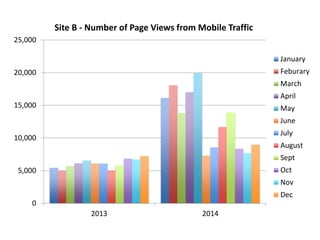
This document contains three charts showing metrics for Site B's mobile traffic over time. The first chart shows the number of page views from mobile traffic each month from 2013 to 2014, ranging from around 5,000 to 25,000 views. The second chart shows the number of mobile sessions from January 2010 to January 2015, growing from around 1,000 to over 10,000 sessions. The third chart shows the percentage of total traffic from mobile sources for Site B, ranging from around 10% to 60% from 2013 to 2014.