More Related Content
Similar to NOLASCO_ORiorden_BSC1025C_63870_SP15 (20)
NOLASCO_ORiorden_BSC1025C_63870_SP15
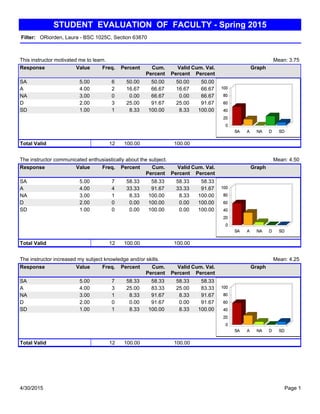
- 1. This instructor motivated me to learn.
Value Freq. Percent Cum.
Percent
Valid
Percent
Cum. Val.
Percent
Response
Mean: 3.75
Graph
100.0012 100.00Total Valid
50.0050.0050.0050.005.00SA 6
66.6716.6766.6716.674.00A 2
66.670.0066.670.003.00NA 0
91.6725.0091.6725.002.00D 3
100.008.33100.008.331.00SD 1
The instructor communicated enthusiastically about the subject.
Value Freq. Percent Cum.
Percent
Valid
Percent
Cum. Val.
Percent
Response
Mean: 4.50
Graph
100.0012 100.00Total Valid
58.3358.3358.3358.335.00SA 7
91.6733.3391.6733.334.00A 4
100.008.33100.008.333.00NA 1
100.000.00100.000.002.00D 0
100.000.00100.000.001.00SD 0
The instructor increased my subject knowledge and/or skills.
Value Freq. Percent Cum.
Percent
Valid
Percent
Cum. Val.
Percent
Response
Mean: 4.25
Graph
100.0012 100.00Total Valid
58.3358.3358.3358.335.00SA 7
83.3325.0083.3325.004.00A 3
91.678.3391.678.333.00NA 1
91.670.0091.670.002.00D 0
100.008.33100.008.331.00SD 1
ORiorden, Laura - BSC 1025C, Section 63870Filter:
STUDENT EVALUATION OF FACULTY - Spring 2015
Page 14/30/2015
- 2. The instructor effectively stimulated critical or technical thinking.
Value Freq. Percent Cum.
Percent
Valid
Percent
Cum. Val.
Percent
Response
Mean: 4.00
Graph
100.0012 100.00Total Valid
58.3358.3358.3358.335.00SA 7
75.0016.6775.0016.674.00A 2
75.000.0075.000.003.00NA 0
91.6716.6791.6716.672.00D 2
100.008.33100.008.331.00SD 1
The instructor was available for individualized communication.
Value Freq. Percent Cum.
Percent
Valid
Percent
Cum. Val.
Percent
Response
Mean: 4.50
Graph
100.0012 100.00Total Valid
58.3358.3358.3358.335.00SA 7
91.6733.3391.6733.334.00A 4
100.008.33100.008.333.00NA 1
100.000.00100.000.002.00D 0
100.000.00100.000.001.00SD 0
The instructor communicated full explanation of assignments.
Value Freq. Percent Cum.
Percent
Valid
Percent
Cum. Val.
Percent
Response
Mean: 4.00
Graph
100.0012 100.00Total Valid
58.3358.3358.3358.335.00SA 7
75.0016.6775.0016.674.00A 2
75.000.0075.000.003.00NA 0
91.6716.6791.6716.672.00D 2
100.008.33100.008.331.00SD 1
Page 24/30/2015
- 3. The instructor followed scheduled time frames.
Value Freq. Percent Cum.
Percent
Valid
Percent
Cum. Val.
Percent
Response
Mean: 4.58
Graph
100.0012 100.00Total Valid
58.3358.3358.3358.335.00SA 7
100.0041.67100.0041.674.00A 5
100.000.00100.000.003.00NA 0
100.000.00100.000.002.00D 0
100.000.00100.000.001.00SD 0
The instructor communicated clearly and effectively.
Value Freq. Percent Cum.
Percent
Valid
Percent
Cum. Val.
Percent
Response
Mean: 4.42
Graph
100.0012 100.00Total Valid
58.3358.3358.3358.335.00SA 7
91.6733.3391.6733.334.00A 4
91.670.0091.670.003.00NA 0
100.008.33100.008.332.00D 1
100.000.00100.000.001.00SD 0
The instructor presented course content effectively.
Value Freq. Percent Cum.
Percent
Valid
Percent
Cum. Val.
Percent
Response
Mean: 4.08
Graph
100.0012 100.00Total Valid
58.3358.3358.3358.335.00SA 7
75.0016.6775.0016.674.00A 2
83.338.3383.338.333.00NA 1
91.678.3391.678.332.00D 1
100.008.33100.008.331.00SD 1
Page 34/30/2015
- 4. The instructor was organized and well prepared.
Value Freq. Percent Cum.
Percent
Valid
Percent
Cum. Val.
Percent
Response
Mean: 4.33
Graph
100.0012 100.00Total Valid
58.3358.3358.3358.335.00SA 7
83.3325.0083.3325.004.00A 3
91.678.3391.678.333.00NA 1
100.008.33100.008.332.00D 1
100.000.00100.000.001.00SD 0
The instructor provided exam results within reasonable time.
Value Freq. Percent Cum.
Percent
Valid
Percent
Cum. Val.
Percent
Response
Mean: 4.58
Graph
100.0012 100.00Total Valid
58.3358.3358.3358.335.00SA 7
100.0041.67100.0041.674.00A 5
100.000.00100.000.003.00NA 0
100.000.00100.000.002.00D 0
100.000.00100.000.001.00SD 0
The instructor graded reasonably and fairly according to the syllabus policies and procedures.
Value Freq. Percent Cum.
Percent
Valid
Percent
Cum. Val.
Percent
Response
Mean: 4.25
Graph
100.0012 100.00Total Valid
58.3358.3358.3358.335.00SA 7
83.3325.0083.3325.004.00A 3
91.678.3391.678.333.00NA 1
91.670.0091.670.002.00D 0
100.008.33100.008.331.00SD 1
Page 44/30/2015
- 5. The instructor consistently followed the syllabus.
Value Freq. Percent Cum.
Percent
Valid
Percent
Cum. Val.
Percent
Response
Mean: 4.58
Graph
100.0012 100.00Total Valid
58.3358.3358.3358.335.00SA 7
100.0041.67100.0041.674.00A 5
100.000.00100.000.003.00NA 0
100.000.00100.000.002.00D 0
100.000.00100.000.001.00SD 0
The instructor provided a syllabus which clearly presented grading policies and procedures.
Value Freq. Percent Cum.
Percent
Valid
Percent
Cum. Val.
Percent
Response
Mean: 4.58
Graph
100.0012 100.00Total Valid
58.3358.3358.3358.335.00SA 7
100.0041.67100.0041.674.00A 5
100.000.00100.000.003.00NA 0
100.000.00100.000.002.00D 0
100.000.00100.000.001.00SD 0
The instructor communicated with students in a timely manner.
Value Freq. Percent Cum.
Percent
Valid
Percent
Cum. Val.
Percent
Response
Mean: 4.58
Graph
100.0012 100.00Total Valid
58.3358.3358.3358.335.00SA 7
100.0041.67100.0041.674.00A 5
100.000.00100.000.003.00NA 0
100.000.00100.000.002.00D 0
100.000.00100.000.001.00SD 0
Page 54/30/2015
- 6. The instructor will be recommended by me to other students.
Value Freq. Percent Cum.
Percent
Valid
Percent
Cum. Val.
Percent
Response
Mean: 3.75
Graph
100.0012 100.00Total Valid
58.3358.3358.3358.335.00SA 7
66.678.3366.678.334.00A 1
75.008.3375.008.333.00NA 1
75.000.0075.000.002.00D 0
100.0025.00100.0025.001.00SD 3
The course schedule and pace were effective.
Value Freq. Percent Cum.
Percent
Valid
Percent
Cum. Val.
Percent
Response
Mean: 4.08
Graph
100.0012 100.00Total Valid
58.3358.3358.3358.335.00SA 7
66.678.3366.678.334.00A 1
91.6725.0091.6725.003.00NA 3
91.670.0091.670.002.00D 0
100.008.33100.008.331.00SD 1
The learning materials in this course were useful to me.
Value Freq. Percent Cum.
Percent
Valid
Percent
Cum. Val.
Percent
Response
Mean: 3.75
Graph
100.0012 100.00Total Valid
50.0050.0050.0050.005.00SA 6
58.338.3358.338.334.00A 1
75.0016.6775.0016.673.00NA 2
91.6716.6791.6716.672.00D 2
100.008.33100.008.331.00SD 1
Page 64/30/2015
- 7. My educational experience at HCC, to date, has been satisfactory.
Value Freq. Percent Cum.
Percent
Valid
Percent
Cum. Val.
Percent
Response
Mean: 4.08
Graph
100.0012 100.00Total Valid
41.6741.6741.6741.675.00SA 5
83.3341.6783.3341.674.00A 5
83.330.0083.330.003.00NA 0
100.0016.67100.0016.672.00D 2
100.000.00100.000.001.00SD 0
Page 74/30/2015