SlideShare a Scribd company logo
1 of 2
Download to read offline
Faculty of Science - Mathematics (MATH_UG)
Course and Teaching Evaluation Distribution Report
Summer Term 2015-2016
1.00-1.49 1.50-2.09 2.10-2.69 2.70-3.29 3.30-3.89 3.90-4.49 4.50-5.09 5.10-5.69 5.70-6.00
0 0 0 0 0 0
4
0 0
Range of mean
Course Effectiveness
1.00-1.49 1.50-2.09 2.10-2.69 2.70-3.29 3.30-3.89 3.90-4.49 4.50-5.09 5.10-5.69 5.70-6.00
0 0 0 0 0 0
4
0 0
Range of mean
Teaching Effectiveness
(Q17)
Departmental Average: 4.83
Adjusted Mean: 5.05
(Q18)
Departmental Average: 4.73
Adjusted Mean: 4.99
Faculty of Science - Mathematics (MATH_UG)
Course and Teaching Evaluation Individual Report, Summer Term 2015-2016
97.56% (40)
a. Faculty Affiliation:
h. Grade Self-Expected
g. Time Spent on Course Outside Class (Hrs per week)
Perceived Supplementary Language Spoken
(can select more than one)
Perceived Percentage of Usage of English
f. Perceived Primary Language Spoken in Class
e. Sex
d. Course Type
c. Year of Study
b. Level
80.49% (33)19.51% (8)
97.56% (40)2.44% (1)0.00% (0)0.00% (0)0.00% (0)
Course Code: MATH3280B Introductory Probability
41Class Size: 60 68.33%
Dr SHEN ShuangCourse Title:
No. Returned:
Teacher:
Response Rate:
ART
0.00% (0)
BAS
14.63% (6) 19.51% (8) 4.88% (2) 0.00% (0) 0.00% (0) 4.88% (2)
EDU ERG LAW MED SCI SSC OTHER
4.88% (2)51.22% (21)
Other
1
4.88% (2)
2
46.34% (19) 39.02% (16) 7.32% (3) 2.44% (1) 0.00% (0)
3 4 5 ≥6
Major required
9.76% (4) 58.54% (24) 9.76% (4) 9.76% (4) 12.20% (5)
Major elective Minor Elective U Core N/A
0.00% (0)
MaleFemale
Cantonese Others
0.00% (0)0.00% (0)0.00% (0)100.00% (41)
61-70% 71-80% 81-90%51-60% 91-100%
2.44% (1)
Cantonese Others N/A
75.61% (31)0.00% (0)14.63% (6)2.44%(1)
14.63% (6) 53.66% (22) 17.07% (7) 9.76% (4) 2.44% (1)
12.0+8.1-12.04.1-8.02.1-4.00-2.0 N/A
2.44% (1)
12.20% (5)
N/A
2.44% (1)
C+ or below
7.32% (3)
B/B-
39.02% (16)
B+
17.07% (7)
A-
21.95% (9)
A
2.44% (1) 0.00% (0)
Putonghua
PutonghuaEnglish
English
Undergraduate Postgraduate
AdjustedRaw
QuartileSDMean
TotalQ1 Med. Q3 (1) (2) (3) (4) (6)(5)
Invalid
Answers
A/A- B+/B/B- C+
or below
Strongly
Agree
AgreeSlightly
Agree
Slightly
Disagre
DisagreeStrongly
Disagree
Mean by
Self-Expected grade
1 Presentation is clear
#
%
0
0.00
2
5.00
3
7.50
10
25.00
15
37.50
10
25.00
40 1
4.70 4.94 1.08 4.00 5.00 5.75
4.80 5.00 0.98 4.00 4.88 5.88
5.27 4.05 4.00
2 Examples relevant to learning
#
%
0
0.00
0
0.00
2
4.88
11
26.83
17
41.46
11
26.83
41
4.90 5.05 0.85 4.00 5.00 6.00
4.83 5.04 1.02 4.25 4.75 5.94
5.25 4.47 5.00
3 Teacher was enthusiastic
#
%
0
0.00
0
0.00
4
9.76
15
36.59
11
26.83
11
26.83
41
4.71 4.89 0.97 4.00 5.00 6.00
4.77 4.98 1.04 4.06 4.88 5.94
5.00 4.26 5.00
4 Class participation encouraged
#
%
1
2.44
3
7.32
8
19.51
9
21.95
13
31.71
7
17.07
41
4.24 4.51 1.28 3.00 4.00 5.00
4.38 4.62 1.23 3.50 4.25 5.31
4.75 3.79 5.00
5 Communication was effective
#
%
0
0.00
2
5.00
9
22.50
9
22.50
11
27.50
9
22.50
40 1
4.40 4.61 1.20 3.00 4.50 5.00
4.54 4.78 1.22 3.63 4.63 5.31
4.94 3.72 5.00
6 The course was interesting
#
%
0
0.00
1
2.44
1
2.44
13
31.71
17
41.46
9
21.95
41
4.78 4.95 0.90 4.00 5.00 5.00
4.64 4.87 1.09 4.00 4.88 5.25
5.19 4.42 5.00
7 The course was stimulating
#
%
0
0.00
1
2.44
2
4.88
12
29.27
17
41.46
9
21.95
41
4.76 4.95 0.93 4.00 5.00 5.00
4.70 4.93 1.09 4.00 5.00 5.50
5.25 4.32 5.00
8 Subject knowledge is enhanced
#
%
0
0.00
0
0.00
1
2.44
12
29.27
17
41.46
11
26.83
41
4.93 5.05 0.81 4.00 5.00 6.00
4.82 5.03 1.03 4.00 5.00 5.75
5.25 4.53 5.00
9 The course was well-organized
#
%
0
0.00
0
0.00
1
2.44
13
31.71
17
41.46
10
24.39
41
4.88 5.00 0.80 4.00 5.00 5.50
4.77 4.95 0.91 4.25 4.88 5.31
5.19 4.58 5.00
10 Clear learning outcomes
#
%
0
0.00
1
2.44
3
7.32
9
21.95
17
41.46
11
26.83
41
4.83 5.05 0.99 4.00 5.00 6.00
4.81 5.02 1.03 4.19 5.00 6.00
5.06 4.47 5.00
11 Appropriate assessment method
#
%
0
0.00
0
0.00
3
7.32
9
21.95
16
39.02
13
31.71
41
4.95 5.14 0.91 4.00 5.00 6.00
4.96 5.18 0.97 4.50 5.00 5.75
5.06 4.68 5.00
12 Appropriate workload amount
#
%
0
0.00
0
0.00
3
7.32
9
21.95
17
41.46
12
29.27
41
4.93 5.11 0.89 4.00 5.00 6.00
4.82 5.03 0.99 4.00 5.00 5.75
5.25 4.53 5.00
Amount of workload
#%
00.00Too Much
3100.00Too Little
13 Recommended readings useful
#
%
0
0.00
1
2.78
1
2.78
6
16.67
17
47.22
11
30.56
36 5
5.00 5.22 0.91 5.00 5.00 6.00
4.85 5.06 0.99 4.25 5.00 5.56
5.20 4.75 5.00
14 Content difficulty appropriate
#
%
1
2.44
0
0.00
2
4.88
11
26.83
16
39.02
11
26.83
41
4.80 5.03 1.04 4.00 5.00 6.00
4.79 5.03 1.04 4.13 5.00 5.63
4.75 4.68 5.00
Content difficulty
#%
133.33Too Difficult
266.67Too Simple
15 Supported by library resources
#
%
0
0.00
0
0.00
4
14.81
4
14.81
11
40.74
8
29.63
27 14
4.85 5.08 1.01 4.00 5.00 6.00
4.92 5.12 0.90 4.19 5.00 5.56
5.14 4.22 5.00
16 Supported by IT resources
#
%
0
0.00
1
3.85
3
11.54
3
11.54
11
42.31
8
30.77
26 15
4.85 5.13 1.10 4.00 5.00 6.00
4.88 5.09 0.96 4.25 5.00 5.75
5.07 4.25 5.00
17 Satisfaction with course
#
%
0
0.00
0
0.00
2
5.00
8
20.00
20
50.00
10
25.00
40 1
4.95 5.11 0.80 4.25 5.00 5.75
4.83 5.05 0.98 4.44 4.88 5.44
5.25 4.56 5.00
18 Satisfaction with teacher
#
%
0
0.00
0
0.00
6
15.00
9
22.50
15
37.50
10
25.00
40 1
4.73 4.92 1.00 4.00 5.00 5.75
4.73 4.99 1.15 4.25 5.00 5.50
5.13 4.28 5.00
Notes
1. 'Invalid answers' include (a) non-response and (b) selection more than one category. All other data are considered valid answers.
3. Definitions: (a) Raw Mean: mean based on all valid answers (b) Adjusted Mean: Mean with bottom 10% valid answers removed; (c) SD: Standard Deviation;
(d) Q1: 25th percentile; Med.: Median; Q3: 75th percentile; (e) #: number of respondents selecting the respective category; (f) %: percentage of # divided by number of valid answers;
(g) Mean by Expected Grade: Raw mean based on responses of students expecting the corresponding grade.
2. For each numbered question, top row (not shaded) reports Course Statistics, bottom row
4. All statistics, except adjusted means, are compiled based on valid answers.
reports Departmental/Programme/School/College Statistics.(shaded)

More Related Content

Similar to Course Evaluation

Dashboard prestasi 3_1 (10)
Dashboard prestasi 3_1 (10)Dashboard prestasi 3_1 (10)
Dashboard prestasi 3_1 (10)smkchemomoi
 
Paper Generation Process of PEC.pptx
Paper Generation Process of PEC.pptxPaper Generation Process of PEC.pptx
Paper Generation Process of PEC.pptxNasirMahmood976516
 
Paper Generation Process of PEC.pptx
Paper Generation Process of PEC.pptxPaper Generation Process of PEC.pptx
Paper Generation Process of PEC.pptxNasirMahmood976516
 
Lab_student_evaluation_2016
Lab_student_evaluation_2016Lab_student_evaluation_2016
Lab_student_evaluation_2016Jiemin Zhang
 
NAG - Butler SD Aaron Decker ES Richard Butler MS
NAG - Butler SD Aaron Decker ES Richard Butler MSNAG - Butler SD Aaron Decker ES Richard Butler MS
NAG - Butler SD Aaron Decker ES Richard Butler MSCarole Rafferty
 
Using ExamSoft Data to Prepare For and Ease the Accreditation Process
Using ExamSoft Data to Prepare For and Ease the Accreditation ProcessUsing ExamSoft Data to Prepare For and Ease the Accreditation Process
Using ExamSoft Data to Prepare For and Ease the Accreditation ProcessExamSoft
 
LITR221 Quiz RubricExemplary LevelAccomplished L.docx
LITR221 Quiz RubricExemplary LevelAccomplished L.docxLITR221 Quiz RubricExemplary LevelAccomplished L.docx
LITR221 Quiz RubricExemplary LevelAccomplished L.docxSHIVA101531
 
Generating chemistry majors and graduates at utep using plus two pltl
Generating chemistry majors and graduates at utep using plus two pltlGenerating chemistry majors and graduates at utep using plus two pltl
Generating chemistry majors and graduates at utep using plus two pltlchandrasekharpappu
 
lesson 3 presentation of data and frequency distribution
lesson 3 presentation of data and frequency distributionlesson 3 presentation of data and frequency distribution
lesson 3 presentation of data and frequency distributionNerz Baldres
 
20110419 tws for edg 4410
20110419   tws for edg 441020110419   tws for edg 4410
20110419 tws for edg 4410pferreira2001
 
NOLASCO_ORiorden_BSC1025C_63870_SP15
NOLASCO_ORiorden_BSC1025C_63870_SP15NOLASCO_ORiorden_BSC1025C_63870_SP15
NOLASCO_ORiorden_BSC1025C_63870_SP15Laura ORiorden
 
2012.10.08 school board meeting
2012.10.08 school board meeting2012.10.08 school board meeting
2012.10.08 school board meetingroverdust
 
The Anatomy of a 21st Century Educator
The Anatomy of a 21st Century Educator The Anatomy of a 21st Century Educator
The Anatomy of a 21st Century Educator Simon Bates
 
Upper Sec Academic Report Card
Upper Sec Academic Report CardUpper Sec Academic Report Card
Upper Sec Academic Report CardYuliana Tjioe
 
002709_2012-2013_BUILD
002709_2012-2013_BUILD002709_2012-2013_BUILD
002709_2012-2013_BUILDStephen Fujii
 
Ca executive leadership forum (0101112)
Ca executive leadership forum (0101112)Ca executive leadership forum (0101112)
Ca executive leadership forum (0101112)Bryan Reece
 

Similar to Course Evaluation (20)

Dashboard prestasi 3_1 (10)
Dashboard prestasi 3_1 (10)Dashboard prestasi 3_1 (10)
Dashboard prestasi 3_1 (10)
 
Paper Generation Process of PEC.pptx
Paper Generation Process of PEC.pptxPaper Generation Process of PEC.pptx
Paper Generation Process of PEC.pptx
 
Paper Generation Process of PEC.pptx
Paper Generation Process of PEC.pptxPaper Generation Process of PEC.pptx
Paper Generation Process of PEC.pptx
 
Toppers Elearning Presentation
Toppers Elearning PresentationToppers Elearning Presentation
Toppers Elearning Presentation
 
Toppers Elearning Pres
Toppers Elearning PresToppers Elearning Pres
Toppers Elearning Pres
 
Lab_student_evaluation_2016
Lab_student_evaluation_2016Lab_student_evaluation_2016
Lab_student_evaluation_2016
 
NAG - Butler SD Aaron Decker ES Richard Butler MS
NAG - Butler SD Aaron Decker ES Richard Butler MSNAG - Butler SD Aaron Decker ES Richard Butler MS
NAG - Butler SD Aaron Decker ES Richard Butler MS
 
Using ExamSoft Data to Prepare For and Ease the Accreditation Process
Using ExamSoft Data to Prepare For and Ease the Accreditation ProcessUsing ExamSoft Data to Prepare For and Ease the Accreditation Process
Using ExamSoft Data to Prepare For and Ease the Accreditation Process
 
Handbook
HandbookHandbook
Handbook
 
LITR221 Quiz RubricExemplary LevelAccomplished L.docx
LITR221 Quiz RubricExemplary LevelAccomplished L.docxLITR221 Quiz RubricExemplary LevelAccomplished L.docx
LITR221 Quiz RubricExemplary LevelAccomplished L.docx
 
Generating chemistry majors and graduates at utep using plus two pltl
Generating chemistry majors and graduates at utep using plus two pltlGenerating chemistry majors and graduates at utep using plus two pltl
Generating chemistry majors and graduates at utep using plus two pltl
 
lesson 3 presentation of data and frequency distribution
lesson 3 presentation of data and frequency distributionlesson 3 presentation of data and frequency distribution
lesson 3 presentation of data and frequency distribution
 
20110419 tws for edg 4410
20110419   tws for edg 441020110419   tws for edg 4410
20110419 tws for edg 4410
 
NOLASCO_ORiorden_BSC1025C_63870_SP15
NOLASCO_ORiorden_BSC1025C_63870_SP15NOLASCO_ORiorden_BSC1025C_63870_SP15
NOLASCO_ORiorden_BSC1025C_63870_SP15
 
2012.10.08 school board meeting
2012.10.08 school board meeting2012.10.08 school board meeting
2012.10.08 school board meeting
 
The Anatomy of a 21st Century Educator
The Anatomy of a 21st Century Educator The Anatomy of a 21st Century Educator
The Anatomy of a 21st Century Educator
 
Upper Sec Academic Report Card
Upper Sec Academic Report CardUpper Sec Academic Report Card
Upper Sec Academic Report Card
 
002709_2012-2013_BUILD
002709_2012-2013_BUILD002709_2012-2013_BUILD
002709_2012-2013_BUILD
 
Ca executive leadership forum (0101112)
Ca executive leadership forum (0101112)Ca executive leadership forum (0101112)
Ca executive leadership forum (0101112)
 
3.LACJanuary_VJCPresentation.pptx
3.LACJanuary_VJCPresentation.pptx3.LACJanuary_VJCPresentation.pptx
3.LACJanuary_VJCPresentation.pptx
 

Course Evaluation

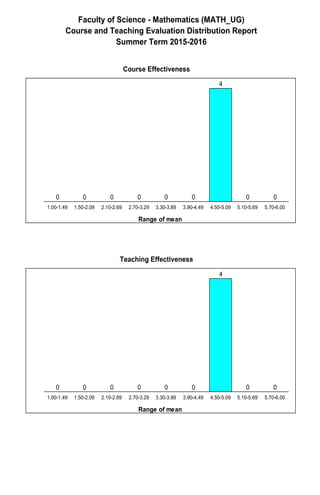
  • 1. Faculty of Science - Mathematics (MATH_UG) Course and Teaching Evaluation Distribution Report Summer Term 2015-2016 1.00-1.49 1.50-2.09 2.10-2.69 2.70-3.29 3.30-3.89 3.90-4.49 4.50-5.09 5.10-5.69 5.70-6.00 0 0 0 0 0 0 4 0 0 Range of mean Course Effectiveness 1.00-1.49 1.50-2.09 2.10-2.69 2.70-3.29 3.30-3.89 3.90-4.49 4.50-5.09 5.10-5.69 5.70-6.00 0 0 0 0 0 0 4 0 0 Range of mean Teaching Effectiveness (Q17) Departmental Average: 4.83 Adjusted Mean: 5.05 (Q18) Departmental Average: 4.73 Adjusted Mean: 4.99
  • 2. Faculty of Science - Mathematics (MATH_UG) Course and Teaching Evaluation Individual Report, Summer Term 2015-2016 97.56% (40) a. Faculty Affiliation: h. Grade Self-Expected g. Time Spent on Course Outside Class (Hrs per week) Perceived Supplementary Language Spoken (can select more than one) Perceived Percentage of Usage of English f. Perceived Primary Language Spoken in Class e. Sex d. Course Type c. Year of Study b. Level 80.49% (33)19.51% (8) 97.56% (40)2.44% (1)0.00% (0)0.00% (0)0.00% (0) Course Code: MATH3280B Introductory Probability 41Class Size: 60 68.33% Dr SHEN ShuangCourse Title: No. Returned: Teacher: Response Rate: ART 0.00% (0) BAS 14.63% (6) 19.51% (8) 4.88% (2) 0.00% (0) 0.00% (0) 4.88% (2) EDU ERG LAW MED SCI SSC OTHER 4.88% (2)51.22% (21) Other 1 4.88% (2) 2 46.34% (19) 39.02% (16) 7.32% (3) 2.44% (1) 0.00% (0) 3 4 5 ≥6 Major required 9.76% (4) 58.54% (24) 9.76% (4) 9.76% (4) 12.20% (5) Major elective Minor Elective U Core N/A 0.00% (0) MaleFemale Cantonese Others 0.00% (0)0.00% (0)0.00% (0)100.00% (41) 61-70% 71-80% 81-90%51-60% 91-100% 2.44% (1) Cantonese Others N/A 75.61% (31)0.00% (0)14.63% (6)2.44%(1) 14.63% (6) 53.66% (22) 17.07% (7) 9.76% (4) 2.44% (1) 12.0+8.1-12.04.1-8.02.1-4.00-2.0 N/A 2.44% (1) 12.20% (5) N/A 2.44% (1) C+ or below 7.32% (3) B/B- 39.02% (16) B+ 17.07% (7) A- 21.95% (9) A 2.44% (1) 0.00% (0) Putonghua PutonghuaEnglish English Undergraduate Postgraduate AdjustedRaw QuartileSDMean TotalQ1 Med. Q3 (1) (2) (3) (4) (6)(5) Invalid Answers A/A- B+/B/B- C+ or below Strongly Agree AgreeSlightly Agree Slightly Disagre DisagreeStrongly Disagree Mean by Self-Expected grade 1 Presentation is clear # % 0 0.00 2 5.00 3 7.50 10 25.00 15 37.50 10 25.00 40 1 4.70 4.94 1.08 4.00 5.00 5.75 4.80 5.00 0.98 4.00 4.88 5.88 5.27 4.05 4.00 2 Examples relevant to learning # % 0 0.00 0 0.00 2 4.88 11 26.83 17 41.46 11 26.83 41 4.90 5.05 0.85 4.00 5.00 6.00 4.83 5.04 1.02 4.25 4.75 5.94 5.25 4.47 5.00 3 Teacher was enthusiastic # % 0 0.00 0 0.00 4 9.76 15 36.59 11 26.83 11 26.83 41 4.71 4.89 0.97 4.00 5.00 6.00 4.77 4.98 1.04 4.06 4.88 5.94 5.00 4.26 5.00 4 Class participation encouraged # % 1 2.44 3 7.32 8 19.51 9 21.95 13 31.71 7 17.07 41 4.24 4.51 1.28 3.00 4.00 5.00 4.38 4.62 1.23 3.50 4.25 5.31 4.75 3.79 5.00 5 Communication was effective # % 0 0.00 2 5.00 9 22.50 9 22.50 11 27.50 9 22.50 40 1 4.40 4.61 1.20 3.00 4.50 5.00 4.54 4.78 1.22 3.63 4.63 5.31 4.94 3.72 5.00 6 The course was interesting # % 0 0.00 1 2.44 1 2.44 13 31.71 17 41.46 9 21.95 41 4.78 4.95 0.90 4.00 5.00 5.00 4.64 4.87 1.09 4.00 4.88 5.25 5.19 4.42 5.00 7 The course was stimulating # % 0 0.00 1 2.44 2 4.88 12 29.27 17 41.46 9 21.95 41 4.76 4.95 0.93 4.00 5.00 5.00 4.70 4.93 1.09 4.00 5.00 5.50 5.25 4.32 5.00 8 Subject knowledge is enhanced # % 0 0.00 0 0.00 1 2.44 12 29.27 17 41.46 11 26.83 41 4.93 5.05 0.81 4.00 5.00 6.00 4.82 5.03 1.03 4.00 5.00 5.75 5.25 4.53 5.00 9 The course was well-organized # % 0 0.00 0 0.00 1 2.44 13 31.71 17 41.46 10 24.39 41 4.88 5.00 0.80 4.00 5.00 5.50 4.77 4.95 0.91 4.25 4.88 5.31 5.19 4.58 5.00 10 Clear learning outcomes # % 0 0.00 1 2.44 3 7.32 9 21.95 17 41.46 11 26.83 41 4.83 5.05 0.99 4.00 5.00 6.00 4.81 5.02 1.03 4.19 5.00 6.00 5.06 4.47 5.00 11 Appropriate assessment method # % 0 0.00 0 0.00 3 7.32 9 21.95 16 39.02 13 31.71 41 4.95 5.14 0.91 4.00 5.00 6.00 4.96 5.18 0.97 4.50 5.00 5.75 5.06 4.68 5.00 12 Appropriate workload amount # % 0 0.00 0 0.00 3 7.32 9 21.95 17 41.46 12 29.27 41 4.93 5.11 0.89 4.00 5.00 6.00 4.82 5.03 0.99 4.00 5.00 5.75 5.25 4.53 5.00 Amount of workload #% 00.00Too Much 3100.00Too Little 13 Recommended readings useful # % 0 0.00 1 2.78 1 2.78 6 16.67 17 47.22 11 30.56 36 5 5.00 5.22 0.91 5.00 5.00 6.00 4.85 5.06 0.99 4.25 5.00 5.56 5.20 4.75 5.00 14 Content difficulty appropriate # % 1 2.44 0 0.00 2 4.88 11 26.83 16 39.02 11 26.83 41 4.80 5.03 1.04 4.00 5.00 6.00 4.79 5.03 1.04 4.13 5.00 5.63 4.75 4.68 5.00 Content difficulty #% 133.33Too Difficult 266.67Too Simple 15 Supported by library resources # % 0 0.00 0 0.00 4 14.81 4 14.81 11 40.74 8 29.63 27 14 4.85 5.08 1.01 4.00 5.00 6.00 4.92 5.12 0.90 4.19 5.00 5.56 5.14 4.22 5.00 16 Supported by IT resources # % 0 0.00 1 3.85 3 11.54 3 11.54 11 42.31 8 30.77 26 15 4.85 5.13 1.10 4.00 5.00 6.00 4.88 5.09 0.96 4.25 5.00 5.75 5.07 4.25 5.00 17 Satisfaction with course # % 0 0.00 0 0.00 2 5.00 8 20.00 20 50.00 10 25.00 40 1 4.95 5.11 0.80 4.25 5.00 5.75 4.83 5.05 0.98 4.44 4.88 5.44 5.25 4.56 5.00 18 Satisfaction with teacher # % 0 0.00 0 0.00 6 15.00 9 22.50 15 37.50 10 25.00 40 1 4.73 4.92 1.00 4.00 5.00 5.75 4.73 4.99 1.15 4.25 5.00 5.50 5.13 4.28 5.00 Notes 1. 'Invalid answers' include (a) non-response and (b) selection more than one category. All other data are considered valid answers. 3. Definitions: (a) Raw Mean: mean based on all valid answers (b) Adjusted Mean: Mean with bottom 10% valid answers removed; (c) SD: Standard Deviation; (d) Q1: 25th percentile; Med.: Median; Q3: 75th percentile; (e) #: number of respondents selecting the respective category; (f) %: percentage of # divided by number of valid answers; (g) Mean by Expected Grade: Raw mean based on responses of students expecting the corresponding grade. 2. For each numbered question, top row (not shaded) reports Course Statistics, bottom row 4. All statistics, except adjusted means, are compiled based on valid answers. reports Departmental/Programme/School/College Statistics.(shaded)