1. Pahau
Kaweka
Pahau
Kaweka
C) N
100 km
Previously published literature indicates a
paleo-flow that runs parallel along
the ECB,but whether flow direction was
Northward or Southward is still debated.
Young zircon grains deposited only
in the Northern Raukumara sub-basin
from Middle Miocene to Early Pliocene
indicate that flow direction may have
limited dispersal of young volcanic
sediment to the Southern Wairarapa
sub-basin.
Pahau
Kaweka
Pahau
Kaweka
N
100 km
A & B)
A & B both inhibited
volcanic sediment
flow to the Wairarapa
sub-basin.
Kaweka
Pahau
N
100 km
We conclude that contribution of Pahau terrane sediment
to both sub-basins 23- 3.6 Ma indicate that the Pahau
basement terrane was above sea level by at least Early Miocene.
Kaweka
Pahau
B) N
100 km
B.There were reverse
thrust fault barriers
between the sub-basins
that blocked sediment
dispersal from the
Raukumara to
Wairarapa sub-basin.
Depositional Age
RelativeProbabilities
Detrital Zircon Age (Ma)
0
1
0 200 400 600 800
0
1
0 200 400 600 800
0
1
0 200 400 600 800
0
1
0 200 400 600 800
0
1
0 200 400 600 800
0
1
0 200 400 600 800
0
1
0 200 400 600 800
Probability Density Plots (PDPs)
Early Pliocene
(~5-3.6 Ma)
Late Miocene
(~12-5 Ma)
Middle
Miocene
(~16-12 Ma)
Early Miocene
(~23-16 Ma)
42 mm/yr
48 mm/yr
HikurangiTrench
A)1(a)
Taupo
Volcanic Zone
Axial
Ranges
Forearc
Basin
(km)
100 km
Subduction
Young grains Old grains
b
C)
a
1(c)
Taranaki
Wairarapa
Region
Raukumara
Region
HIKURANGITRENCH
A)
Taupo
Kaweka
basem
ent
terrane
Pahau
basement
terrane
b
a
1(b)
Figure 1- Present-day NewZealand (NZ). a) Geographic
location and key for map. b) North Island of NZ;Yellow
region is East Coast Basin (ECB).c) Cross-section,from a to b,
of figure 1(b) map.Adapted from maps and cross-section
made by N.Nieminski.
Subduction Wedge
Pacific plate
Indo- Australian
plate
Detrital Zircon Provenance of Neogene Forearc Sub-basin Sandstone: East Coast Basin of New Zealand TEXAS
THE UNIVERSITY OF
AT AUSTIN
WHAT STARTS HERE CHANGES THE WORLD
Laura N.Dafov1,Nora M.Nieminski2,Lauren E.Shumaker2,Stephan A.Graham2
1
The University of Texas at Austin, Jackson School of Geosciences,Austin,TX,78712,US
2
Stanford University, School of Earth,Energy,& Environmental Sciences,Stanford,California,94305,US
Interpretations
Acknowledgements
Results
Geologic Setting and Background
Introduction and Purpose
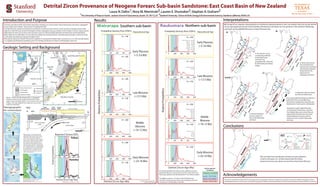
Southern sub-basin Northern sub-basin
Probability Density Plots (PDPs)
RelativeProbabilities
Detrital Zircon Age (Ma)
0
1
0 200 400 600 800
0
1
0 200 400 600 800
0
1
0 200 400 600 800
0
1
0 200 400 600 800
0
1
0 200 400 600 800
0
1
0 200 400 600 800
Depositional Age
Early Pliocene
(~5-3.6 Ma)
Late Miocene
(~12-5 Ma)
Middle
Miocene
(~16-12 Ma)
Early Miocene
(~23-16 Ma)
The East Coast Basin (ECB) of the North Island,New Zealand,is an active forearc basin that features sub-basins segregated
by low-angle reverse faults. The purpose of studying the ECB:
1) Understand the spatial and temporal contribution of sediment from distinct source terranes to Neogene deep-water
deposits in the ECB may constrain the degree of basin segregation during evolution of the modern tectonic regime,permit
delineation of active source areas,and constrain source-to-sink boundaries between terrestrial and marine deposition.
2) Elucidate the far-field effects of west-directed subduction along the Pacific-Australian plate boundary and onset of slip
on the plate-bounding transgressional Alpine Fault.
3) Study the dynamics of basin-fill and how sediment is transported to deep-water sub-basins (i.e.is it a fill-and-spill system
or a stepped ponded/partial-ponded system?) to facilitate prediction of where to drill Neogene reservoirs.
Key for age bins
of interest:
Cretaceous (~145-66 Ma)
Jurassic (~199-145 Ma)
Triassic (~251-199 Ma)
Permian (~299-251 Ma)
The authors would like to thank AGU for the opportunity to present this research.Funding for this project has been provided by Stanford’s Summer
Undergraduate Research in Geosciences and Engineering program (SURGE) and the Stanford Project On Deep-water Depositional Systems (SPODDS) consortium.
RaukumaraWairarapa
0 100 200 300 400 500
1
0 100 200 300 400 500
1
RelativeProbabilities
Basement Terrane PDPs
Pahau
Kaweka
Detrital Zircon Age (Ma)
Modified figure from Adams et al., 2013
KEY
Volcano
within Taupo
volcanic zone
Paleo-flow
direction
Raukumara
sub-basin
Wairarapa
sub-basin
Rivers
Uplifted basement
terrane/ mountain
range
Reverse
thrust
fault
Boundary
separating
Kaweka
basement terrane
from Western
basement terranes
Boundary
separating
Pahau
basement
terrane
from Kaweka
basement
terrane
Ocean
A through C are separate interpretations of sediment dispersal patterns that can explain why the young detrital
zircon age signatures found in the Northern Raukumara sub-basin are not present in the Southern Wairarapa
sub-basin during Middle Miocene to Early Pliocene time.
We hypothesized that the Pahau terrane uplifted sometime
during the Pliocene to present time,but the results show that
Pahau age signatures are already present in our oldest samples.
The biggest surprise in our data is that the Raukumara
sub-basin contains young volcanic age signatures which are
not present in the Wairarapa sub-basin.
Pahau
Kaweka
Pahau
Kaweka
A) N
100 km
A.The volcanic source
contributing sediment
to the Raukumara
sub-basin was
geographically restricted
by the Kaweka and Pahau
ranges.
C.Paleo-flow direction along
the ECB was Northward.
N = 200
N = 200
N = 100
N = 200
N = 100
N = 200
N = 100
N = 200
N = 200
N = 100
N = 200
N = 200
N = 100
Number of grains analyzed (N) =
number of grains plotted
242
475
118
217
317
429 490
624
109
126
153
246
387
523
283
472
Volcanic ages- 15.5 ± .2
16.1 ± .6
16.5 ± .8
18.4 ± .35
20.1 ± .29
21.2 ± .4
Volcanic ages- 12.2 ± 0.8
13.82 ± 0.78
13.95 ± 0.64
15.5 ± 0.79
16.2 ± 1.5
16.5 ± 1.1
17.3 ± 1.4
25.5 ± 1.9
27.6 ± 4.6
Volcanic ages- 10.6 ± 0.6
11.87 ± 0.81
17.4 ± 0.9
Volcanic ages- 4.5 ± 0.4 8.09 ± 0.46
4.96 ± 0.31 8.6 ± 0.7
5.09 ± 0.19 8.9 ± 0.5
5.42 ± 0.31 9.1 ± 0.8
5.8 ± 0.6 9.28 ± 0.43
6.85 ± 0.4 9.5 ± 1
7 ± 0.5 10 ± 0.7
7.36 ± 0.33 10.1 ± 0.7
7.66 ± 0.57 10.3 ± 0.9
7.7 ± 0.4 11.29 ± 0.72
8 ± 0.5 11.6 ± 1
119
245
516
116
222
315 488
120
230
480
107
246
500
125
237
441
16.8
30.8
119
175
241
339 510
14.4
19.2
121
187
234
325 494
136
246
10.5
13.5
120
231
323 453
4.5
9
125108
186
243
Paleogeographic
Re-constructions
Paleogeographic re-constructions (Present,
10 Ma, and 20 Ma) of New Zealand from King
2000. Bold line depicts paleo-coastline. Colour
coding: white = terrestrial non-deposition;
green = terrestrial deposition; yellow = marginal
marine sand-dominated facies; pale blue-grey =
shelf; mid-blue = slope or submarine rise; dark
blue = deep ocean. Basins depicted include:
Taranaki (TB), East Coast (ECB), Canterbury (CB),
Great South (GSB), and Western Southland (WS).
ChP = Challenger Plateau, CP = Campbell Plateau,
CR = Chatham Rise; NCB = New Caledonia Basin;
NB = Norfolk Basin; PT = Puysegur Trench; EB =
Emerald Basin. Faults, subduction zones, and
seafloor spreading centres shown in red. Pink
circles = active volcanism.
20 Ma
Present
10 Ma
70 Ma
Figure above (70 Ma) from- E. McSaveney and R. Sutherland,
New Zealand adrift. 2nd ed. Lower Hutt: Institute of
Geological & Nuclear Sciences, 2005
Drifting of New Zealand from Gondwana after breakup 85 Ma.
Conclusions