
Recommended
More Related Content
Viewers also liked
Viewers also liked (20)
More from LEQUEUX Philippe
LLS Vietnam
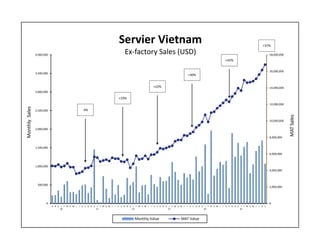
- 1. 0 2,000,000 4,000,000 6,000,000 8,000,000 10,000,000 12,000,000 14,000,000 16,000,000 18,000,000 0 500,000 1,000,000 1,500,000 2,000,000 2,500,000 3,000,000 3,500,000 4,000,000 O N D J 00 F M A M J J A S O N D J 01 F M A M J J A S O N D J 02 F M A M J J A S O N D J 03 F M A M J J A S O N D J 04 F M A M J J A S O N D J 05 F M A M J J A S MAT Sales Monthly Sales Servier Vietnam Ex‐factory Sales (USD) Monthly Value MAT Value ‐4% +19% +22% +40% +42% +37%