SlideShare a Scribd company logo
1 of 1
Download to read offline
Abstract
Cold-blooded animals develop faster at warmer temperatures than cold temperatures,
but not all processes change evenly with temperature. Developmental processes,energy
usage, and feeding behavior are all affected by temperature, but separating these
processes has remained elusive. Though the total time of embryogenesis varies over
two-fold, the relative timing of events in embryogenesis scales uniformly. However, larval
growth does not scale uniformly between warmer temperatures and colder temperatures.
Therefore, how energy is utilized as developmental and feeding rates change with
temperature is unknown. To understand this mechanism better, I set up a time-lapse
imaging assay system where developmental rates and post-hatching survival were
determined. I observed the effect of starvation in Drosophila melanogaster through the
first instar following incubation and hatching at different temperatures (18˚C, 21˚C, 28˚C)
for 3-4 days. On average, post-hatch survival lasted 83% of embryonic development, with
no significant changes between temperatures detected. I found that energy usage likely
scales evenly across temperatures during embryogenesis and early development.
Therefore, any molecular mechanism driving development forward equally affects
energy usage independent of temperature. To further understand this mechanism,
different mutant lines that govern metabolism, chrb, CG16758, and Thor, are being tested
at starvation with the same range of temperatures to explain what is responsible for
controlling the rate of development forward.
Introduction
Recently, time-lapse imaging to track the progress of embryogenesis from egg lay through
hatching has established the relationship between developmental rate and temperature
(Kuntz and Eisen (2014) Plos Genetics). To better understand how energy and resources
are utilized in the face of changing developmental and feeding rates, I am investigating
how the rate of energy usage changes across a range of temperatures.
Figure 1 D. melanogaster embryos respond to temperature uniformly
A) Each point represents an event in embryogenesis. Larval growth does not scale
uniformly between warm and cold temperatures. Total of time of embryogenesis varies
over two-fold.
B) When normalized the relative timing of events scales uniformly.
Eisen and Kuntz
,PLoS Genet.2014
;10(4):e1004293
Methods
Figure 2. Embryonic development and larval survival are observed with a time-lapse assay.
I set up a time-lapse imaging assay system where developmental rates and post-hatching survival
were determined.
Time lapse camera
Tripod
Light table
96-microwell plate
Figure 3. Oxygen-permeable membrane
retains moisture over long time-scales but
prevents hypoxia. Membrane placed on top of
wells prevents evaporation and dehydration of
embryos.
Oxygen Permeable Membrane
Figure 4. Timelapse imaging captures
changes in larval movement. Up to twelve
wells (with 50µLwater and 3-5 embryos each)
in a 96-microwell plate were imaged
simultaneously.
Embryos placed in well
Figure 5. Picture of D. melanogaster embryo Figure 6. D. melanogaster 1st instar larva
Key Issues with Assay Solution
Throughput Set up imaging in 96-well plate for
simultaneous, independent observations
Focal depth Added high-contrast edges to target auto-
focus
Dehydration Filled wells with 50µL water
Evaporation Sealed wells with semi-permeable
membrane
Condensation Vented the semi-permeable membrane
Temperature inconsistency Incubation
Lighting Light table for high-constrast bright-field
imaging
Transferring embryos into wells Developed cooper wire tool
Table: Assay required maintaining quality
imaging as well as fly larval fly survival across
3-4 days
Video is a time lapse from Thor mutant
developing at 27°C (goo.gl/pdxvcf)
Results
Temperature
Figure 7. Hatching and arrest in wildtype
D. melanogaster follow similar responses to
temperature, both slowing as temperatures
decrease. Hatching is defined
as initial movement of embryos and arrest
a stoppage of movements.
Averageratio
(post-hatchsurvival
/hatching)
Figure 8. The ratio of post-hatch
survival time to embryonic
development time remains consistent
across temperatures. The time that larvae
can move scales evenly with the time it
takes embryos to develop.
Any molecular mechanism controlling the developmental rate appears to equally affect
energy usage independent of temperature.To further understand this mechanism, I analyzed
three lines with mutations in metabolic genes known to change expression with temperature.
Temperature
Averagetime(hrs)
chrb (Redd1) CG16758 (PNP) Thor (4E-BP)
Figure 9. Hatching and arrest time in mutant flies respond to temperature similarly to
wildtype. Across the three different mutations (chrb, CG16758, and Thor), embryos at
warmer temperatures developed faster than at colder temperatures,with no mutant specific
changes in developmental rate between temperatures.
Temperature
Figure 10. Ratio of hatching to
arrest may differ in Thor mutants
compared to wildtype. With the
limited trials with chrb, CG16758, and
Thor mutants, it appears that Thor
warrants further testing, as at 17°C
and 27 °C Thor is surviving
proportionally longer than wildtype
following hatching.
Time Lapse Video In wildtype Drosophila melanogaster at
17.5°C post-hatching survival lasts
27±12 hours, at 21°C survival lasts
13±5 hours, and 27.5°C lasts 9±4 hours.
On average, post-hatch survival lasted
83% of embryonic development, with no
significant changes between temperatures
detected. Thus, energy usage is likely
conserved across temperatures during
embryogenesis and early development.
Conclusions
The three different mutant lines that govern
metabolism, chrb, CG16758, and Thor, are still
being tested at starvation with the same range
of temperatures to further understand the
mechanism controlling energy usage. Currently,
Thor seems like the most interesting mutant to
provide unique insights to this mechanism.
Therefore, more trials are being tested on Thor.
The distribution of movement may change
across temperatures and between mutants, so
comparisons between the two will be
conducted to look for trends.
Further Work
Acknowledgements
I want like to thank my mentor and post-doc Steven Kuntz for allowing me the opportunity to
participate in research and teaching me so much. This project wouldn’t be the same without your
insight. Thank you also to the Eisen lab and to Mike Eisen for providing a fun environment to learn
and grow. Finally, thank you to Ugo Nwosu for your time and effort in helping to create this poster.
Starvation of Drosophilia melanogaster during early development reveals energy conservation across temperatures
Khalid Al-Rayess , Michael Eisen, PhD , Steven Kuntz, PhD
Molecular Cell & Biology: Cell and Developmental Emphasis
Department of Molecular & Cell Biology, University of California, Berkeley
1,2 2 2
1
2
Averageratio
(post-hatchsurvival
/hatching)
Temperature
Averagetime(hrs)

More Related Content

Similar to Poster Layout (April 11)

Thermoregulation responses of broiler chickens to humidity
Thermoregulation responses of broiler chickens to humidityThermoregulation responses of broiler chickens to humidity
Thermoregulation responses of broiler chickens to humiditybabuvet
 
TDS in Turtles.pptx
TDS in Turtles.pptxTDS in Turtles.pptx
TDS in Turtles.pptxssuser880f82
 
Development of a State-Space Thermal Model for High Precision Temperature Con...
Development of a State-Space Thermal Model for High Precision Temperature Con...Development of a State-Space Thermal Model for High Precision Temperature Con...
Development of a State-Space Thermal Model for High Precision Temperature Con...iosrjce
 
BE 4120 project poster .pptx
BE 4120 project poster .pptxBE 4120 project poster .pptx
BE 4120 project poster .pptxCarlyFitzMorris1
 
The influence (basic biology) unm
The influence (basic biology) unmThe influence (basic biology) unm
The influence (basic biology) unmJeny Hardiah
 
KEET-Larva Ikan.pdf
KEET-Larva Ikan.pdfKEET-Larva Ikan.pdf
KEET-Larva Ikan.pdfssuser3c26b8
 
Fetal and neonatal thermoregulation
Fetal and neonatal thermoregulation Fetal and neonatal thermoregulation
Fetal and neonatal thermoregulation Rizwan Naqishbandi
 
1-s2.0-S0531556514002551-main(1)
1-s2.0-S0531556514002551-main(1)1-s2.0-S0531556514002551-main(1)
1-s2.0-S0531556514002551-main(1)Xavier Manière
 
Heat distribution under microwave heating treatment
Heat distribution under microwave heating treatmentHeat distribution under microwave heating treatment
Heat distribution under microwave heating treatmentjournalBEEI
 
How Tube 3 Changed Colors Into An Orange-Brown
How Tube 3 Changed Colors Into An Orange-BrownHow Tube 3 Changed Colors Into An Orange-Brown
How Tube 3 Changed Colors Into An Orange-BrownLisa Olive
 
Poster Presentation-This is Research
Poster Presentation-This is ResearchPoster Presentation-This is Research
Poster Presentation-This is ResearchVictoria Holland
 
Sleight and lenski_pbz_2007
Sleight and lenski_pbz_2007Sleight and lenski_pbz_2007
Sleight and lenski_pbz_2007danteess
 
Sleight and lenski
Sleight and lenskiSleight and lenski
Sleight and lenskidanteess
 
Phragmites Poster 2014 (Final)
Phragmites Poster 2014 (Final)Phragmites Poster 2014 (Final)
Phragmites Poster 2014 (Final)Anjelle Martinez
 
1 edwin j. alvarado annotated bibliography
1 edwin j. alvarado annotated bibliography1 edwin j. alvarado annotated bibliography
1 edwin j. alvarado annotated bibliographyEdwin Alvarado
 
About Heat shock proteins.
About Heat shock proteins.About Heat shock proteins.
About Heat shock proteins.SohelAnsari12
 
McCall K.E. et al.: Using EIT to determine the role of gestational age on lun...
McCall K.E. et al.: Using EIT to determine the role of gestational age on lun...McCall K.E. et al.: Using EIT to determine the role of gestational age on lun...
McCall K.E. et al.: Using EIT to determine the role of gestational age on lun...Hauke Sann
 

Similar to Poster Layout (April 11) (20)

Thermoregulation responses of broiler chickens to humidity
Thermoregulation responses of broiler chickens to humidityThermoregulation responses of broiler chickens to humidity
Thermoregulation responses of broiler chickens to humidity
 
G010625257
G010625257G010625257
G010625257
 
TDS in Turtles.pptx
TDS in Turtles.pptxTDS in Turtles.pptx
TDS in Turtles.pptx
 
Development of a State-Space Thermal Model for High Precision Temperature Con...
Development of a State-Space Thermal Model for High Precision Temperature Con...Development of a State-Space Thermal Model for High Precision Temperature Con...
Development of a State-Space Thermal Model for High Precision Temperature Con...
 
BE 4120 project poster .pptx
BE 4120 project poster .pptxBE 4120 project poster .pptx
BE 4120 project poster .pptx
 
Article 9
Article 9Article 9
Article 9
 
Poster 2
Poster 2Poster 2
Poster 2
 
The influence (basic biology) unm
The influence (basic biology) unmThe influence (basic biology) unm
The influence (basic biology) unm
 
KEET-Larva Ikan.pdf
KEET-Larva Ikan.pdfKEET-Larva Ikan.pdf
KEET-Larva Ikan.pdf
 
Fetal and neonatal thermoregulation
Fetal and neonatal thermoregulation Fetal and neonatal thermoregulation
Fetal and neonatal thermoregulation
 
1-s2.0-S0531556514002551-main(1)
1-s2.0-S0531556514002551-main(1)1-s2.0-S0531556514002551-main(1)
1-s2.0-S0531556514002551-main(1)
 
Heat distribution under microwave heating treatment
Heat distribution under microwave heating treatmentHeat distribution under microwave heating treatment
Heat distribution under microwave heating treatment
 
How Tube 3 Changed Colors Into An Orange-Brown
How Tube 3 Changed Colors Into An Orange-BrownHow Tube 3 Changed Colors Into An Orange-Brown
How Tube 3 Changed Colors Into An Orange-Brown
 
Poster Presentation-This is Research
Poster Presentation-This is ResearchPoster Presentation-This is Research
Poster Presentation-This is Research
 
Sleight and lenski_pbz_2007
Sleight and lenski_pbz_2007Sleight and lenski_pbz_2007
Sleight and lenski_pbz_2007
 
Sleight and lenski
Sleight and lenskiSleight and lenski
Sleight and lenski
 
Phragmites Poster 2014 (Final)
Phragmites Poster 2014 (Final)Phragmites Poster 2014 (Final)
Phragmites Poster 2014 (Final)
 
1 edwin j. alvarado annotated bibliography
1 edwin j. alvarado annotated bibliography1 edwin j. alvarado annotated bibliography
1 edwin j. alvarado annotated bibliography
 
About Heat shock proteins.
About Heat shock proteins.About Heat shock proteins.
About Heat shock proteins.
 
McCall K.E. et al.: Using EIT to determine the role of gestational age on lun...
McCall K.E. et al.: Using EIT to determine the role of gestational age on lun...McCall K.E. et al.: Using EIT to determine the role of gestational age on lun...
McCall K.E. et al.: Using EIT to determine the role of gestational age on lun...
 

Poster Layout (April 11)

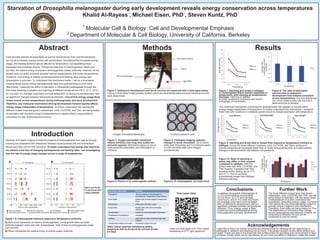
  • 1. Abstract Cold-blooded animals develop faster at warmer temperatures than cold temperatures, but not all processes change evenly with temperature. Developmental processes,energy usage, and feeding behavior are all affected by temperature, but separating these processes has remained elusive. Though the total time of embryogenesis varies over two-fold, the relative timing of events in embryogenesis scales uniformly. However, larval growth does not scale uniformly between warmer temperatures and colder temperatures. Therefore, how energy is utilized as developmental and feeding rates change with temperature is unknown. To understand this mechanism better, I set up a time-lapse imaging assay system where developmental rates and post-hatching survival were determined. I observed the effect of starvation in Drosophila melanogaster through the first instar following incubation and hatching at different temperatures (18˚C, 21˚C, 28˚C) for 3-4 days. On average, post-hatch survival lasted 83% of embryonic development, with no significant changes between temperatures detected. I found that energy usage likely scales evenly across temperatures during embryogenesis and early development. Therefore, any molecular mechanism driving development forward equally affects energy usage independent of temperature. To further understand this mechanism, different mutant lines that govern metabolism, chrb, CG16758, and Thor, are being tested at starvation with the same range of temperatures to explain what is responsible for controlling the rate of development forward. Introduction Recently, time-lapse imaging to track the progress of embryogenesis from egg lay through hatching has established the relationship between developmental rate and temperature (Kuntz and Eisen (2014) Plos Genetics). To better understand how energy and resources are utilized in the face of changing developmental and feeding rates, I am investigating how the rate of energy usage changes across a range of temperatures. Figure 1 D. melanogaster embryos respond to temperature uniformly A) Each point represents an event in embryogenesis. Larval growth does not scale uniformly between warm and cold temperatures. Total of time of embryogenesis varies over two-fold. B) When normalized the relative timing of events scales uniformly. Eisen and Kuntz ,PLoS Genet.2014 ;10(4):e1004293 Methods Figure 2. Embryonic development and larval survival are observed with a time-lapse assay. I set up a time-lapse imaging assay system where developmental rates and post-hatching survival were determined. Time lapse camera Tripod Light table 96-microwell plate Figure 3. Oxygen-permeable membrane retains moisture over long time-scales but prevents hypoxia. Membrane placed on top of wells prevents evaporation and dehydration of embryos. Oxygen Permeable Membrane Figure 4. Timelapse imaging captures changes in larval movement. Up to twelve wells (with 50µLwater and 3-5 embryos each) in a 96-microwell plate were imaged simultaneously. Embryos placed in well Figure 5. Picture of D. melanogaster embryo Figure 6. D. melanogaster 1st instar larva Key Issues with Assay Solution Throughput Set up imaging in 96-well plate for simultaneous, independent observations Focal depth Added high-contrast edges to target auto- focus Dehydration Filled wells with 50µL water Evaporation Sealed wells with semi-permeable membrane Condensation Vented the semi-permeable membrane Temperature inconsistency Incubation Lighting Light table for high-constrast bright-field imaging Transferring embryos into wells Developed cooper wire tool Table: Assay required maintaining quality imaging as well as fly larval fly survival across 3-4 days Video is a time lapse from Thor mutant developing at 27°C (goo.gl/pdxvcf) Results Temperature Figure 7. Hatching and arrest in wildtype D. melanogaster follow similar responses to temperature, both slowing as temperatures decrease. Hatching is defined as initial movement of embryos and arrest a stoppage of movements. Averageratio (post-hatchsurvival /hatching) Figure 8. The ratio of post-hatch survival time to embryonic development time remains consistent across temperatures. The time that larvae can move scales evenly with the time it takes embryos to develop. Any molecular mechanism controlling the developmental rate appears to equally affect energy usage independent of temperature.To further understand this mechanism, I analyzed three lines with mutations in metabolic genes known to change expression with temperature. Temperature Averagetime(hrs) chrb (Redd1) CG16758 (PNP) Thor (4E-BP) Figure 9. Hatching and arrest time in mutant flies respond to temperature similarly to wildtype. Across the three different mutations (chrb, CG16758, and Thor), embryos at warmer temperatures developed faster than at colder temperatures,with no mutant specific changes in developmental rate between temperatures. Temperature Figure 10. Ratio of hatching to arrest may differ in Thor mutants compared to wildtype. With the limited trials with chrb, CG16758, and Thor mutants, it appears that Thor warrants further testing, as at 17°C and 27 °C Thor is surviving proportionally longer than wildtype following hatching. Time Lapse Video In wildtype Drosophila melanogaster at 17.5°C post-hatching survival lasts 27±12 hours, at 21°C survival lasts 13±5 hours, and 27.5°C lasts 9±4 hours. On average, post-hatch survival lasted 83% of embryonic development, with no significant changes between temperatures detected. Thus, energy usage is likely conserved across temperatures during embryogenesis and early development. Conclusions The three different mutant lines that govern metabolism, chrb, CG16758, and Thor, are still being tested at starvation with the same range of temperatures to further understand the mechanism controlling energy usage. Currently, Thor seems like the most interesting mutant to provide unique insights to this mechanism. Therefore, more trials are being tested on Thor. The distribution of movement may change across temperatures and between mutants, so comparisons between the two will be conducted to look for trends. Further Work Acknowledgements I want like to thank my mentor and post-doc Steven Kuntz for allowing me the opportunity to participate in research and teaching me so much. This project wouldn’t be the same without your insight. Thank you also to the Eisen lab and to Mike Eisen for providing a fun environment to learn and grow. Finally, thank you to Ugo Nwosu for your time and effort in helping to create this poster. Starvation of Drosophilia melanogaster during early development reveals energy conservation across temperatures Khalid Al-Rayess , Michael Eisen, PhD , Steven Kuntz, PhD Molecular Cell & Biology: Cell and Developmental Emphasis Department of Molecular & Cell Biology, University of California, Berkeley 1,2 2 2 1 2 Averageratio (post-hatchsurvival /hatching) Temperature Averagetime(hrs)