
Recommended
More Related Content
What's hot
What's hot (20)
Similar to Power factor vs. displacement power factor
Similar to Power factor vs. displacement power factor (20)
Recently uploaded
Recently uploaded (20)
Power factor vs. displacement power factor
- 1. True power factor (PF) and displacement power factor (DPF) are commonly available on power analyzers and loggers. At first glance (and in POWER QUALITY & RELIABILITY Power Factor Vs. Displacement Power Factor What’s the difference? Chris Mullins 1 | Jun 28, 2017
- 2. some situations), they appear to measure the same thing, but there is an important difference. A review of their definitions and an explanation of when to use each are presented here. PF and DPF are both measures of the “efficiency” of power delivery, in the sense that they are ratios of the useful energy delivered to a load versus the “effort” or “burden” on the electrical system by that load. PF, or “true power factor,” has the most straightforward definition, but DPF is perhaps more familiar in terms of the traditional power triangle relating watts, VARs (Volt-Amps-Reactive), and VA (Volt-Amps). Displacement power factor Related: Spotting Loose Neutrals with Waveform Capture The DPF is the “power factor” of just the 60-Hz portion of the waveform for voltage and current. Harmonic effects are inherently excluded from the calculation and have no direct effect on the result. DPF is computed as the cosine of the phase angle between the current and voltage fundamental sine waves: DPF = cos Related: Low-Energy Lighting and Power Quality
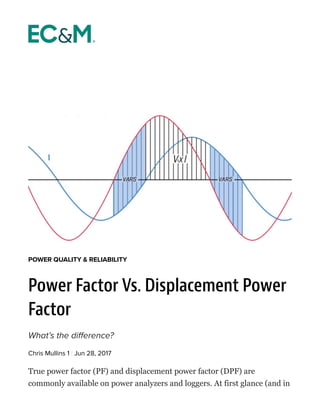
- 3. Figure 1 shows a sample voltage (red) and current (blue) waveform, where the current is shifted in phase from the voltage. This phase shift is typically caused by inductive loads such as motors. Instantaneous real power is the voltage times the current. Portions of the waveforms where the V × I product is positive contribute to positive real power flow (energy delivered to the load), while negative values represent reactive power, which subtracts from the net real power over a 60-Hz cycle. If there is no phase shift, the V × I product is always positive, and every sample contributes to the real power. On the other hand, if the phase shift is 90°, the positive values exactly cancel with the negative values, and no real power is delivered. The familiar power triangle relations quantify this effect (Fig. 2). Fig. 1. Voltage and current waveforms with current (blue line) shifted in phase from the voltage (red line).
- 4. A low DPF is often mitigated with power factor correction capacitors (PFCs). These capacitors are sized based on the amount of VARs needed to cancel out the inductive VARs of typical loads. Another equivalent interpretation is that they shift the lagging current back into phase with the voltage. In either case, the net VARs is reduced, thus increasing the real power for a given VA, according to the triangle relation: VA = √(W + VAR ) Since harmonic currents don’t contribute significantly to real or reactive power flow, they should not be included in sizing a PFC — or in judging PFC effectiveness in lowering VARs. For this purpose, DPF is the best choice. If harmonics are present, DPF is still useful for measuring PFC effectiveness. But another metric is needed for overall system efficiency — true power factor. Power factor PF is the ratio of real power to apparent power, and is given by the Fig. 2. The relationship of real power, reactive power, and power factor are presented in this power triangle. 2 2
- 5. formula: PF = (W ÷ VA) Where W is the real power over at least one 60-Hz period, and VA is the apparent power. The apparent power (VA) is simply the RMS voltage times the RMS current (over the same period as the real power calculation). This is called “true” power factor because it’s valid and equally meaningful regardless of the waveform shape of the voltage or current. Waveform distortion, or deviation from the ideal 60-Hz sine wave, can be quantified by harmonics. The RMS computations (and thus VA) and the real power calculations include the effects of any harmonic (and even interharmonic) distortion that may be present in the voltage or current. The PF can be viewed as an efficiency metric, with the real power (W) representing the power actually delivered to a load and the apparent power (VA) representing the burden of that load on the system. The real power may be reduced due to phase shift between the voltage and current waveforms (also captured by DPF, as described above), thus reducing the PF value. More significantly for PF, harmonic currents will increase the VA measurement without appreciably increasing the real power — again, reducing the PF. In Fig. 3, a typical electronic load is shown with the Fig. 3. Typical nonlinear electronic load shows the relationship between voltage (red line) and current (blue line).
- 6. voltage in red and very non-sinusoidal current in blue. The harmonic breakdown of these waveforms is shown in Fig. 4, along with harmonic power. The top chart is voltage, where the fundamental is large, and the 3rd and 5th harmonics are just barely visible. The current (middle plot) shows severe distortion — the 3rd and 5th harmonics are almost as tall as the 60 Hz fundamental (circled in orange). The harmonic real power in the bottom plot reveals that only the fundamental shows any significant power. The 5th harmonic power is the highest of the harmonics, and it’s still very small. Mathematically, harmonic currents can only produce harmonic real or reactive power if the corresponding voltage harmonic is high.
- 7. In general, harmonic current components deliver very little real power, and their presence only increases the RMS current. Thus, as harmonics increase, the VA increases and the PF worsens. The burden on the distribution network is quantified by VA (transformer heating, resistive Fig. 4. Harmonic breakdown of the nonlinear load from Fig. 3 reveals the 3rd and 5th harmonics are almost as large as the 60-Hz fundamental.
- 8. losses at a fixed nominal voltage, etc.) so the PF value is a good metric for overall system efficiency, valid for all waveform shapes and harmonic levels. PF or DPF? If the actual waveforms are pure 60-Hz sine waves with no harmonics, then the PF and DPF measurements will be equal. As harmonics (or interharmonics) are added, the PF gets smaller, but the DPF stays the same (all else remaining equal). Use DPF for 60-Hz reactive power issues, primarily for PFC investigations. If the DPF is low, there is an opportunity to improve efficiency by installing (or adjusting) a PFC. If the DPF is different on three phases, a phase on an existing capacitor bank may be blown. A strip chart graph of DPF may be used to help set timers or trip points on an adjustable PFC (the VAR strip chart may also be used for this). Use PF for quantifying overall system efficiency, including the effects of harmonics. If the PF is low but the DPF is high, a PFC will probably not help. A low PF may indicate increased transformer heating or other losses due to high harmonics. Improving this requires harmonic mitigation, a K- rated transformer, or upsizing/derating a regular transformer. With low PF and high DPF, harmonics are present, and a full IEEE 519 harmonic investigation may be warranted. In conclusion PF and DPF are both measures of system efficiency that are equivalent in non-harmonic situations. Although superficially similar, they are best used for very different purposes. DPF is a good measure of phase shift and PFC
- 9. Source URL: http://www.ecmweb.com/power-quality-reliability/power-factor-vs-displacement-power- factor performance, while PF is better for overall system efficiency determination in the presence of harmonics. When DPF and PF differ numerically, harmonics are present, and a deeper investigation may be required. Mullins is VP of operations and engineering for Power Monitors, Inc. He can be reached at cmullins@powermonitors.com .