1. RESTRICTED APPRAISAL:
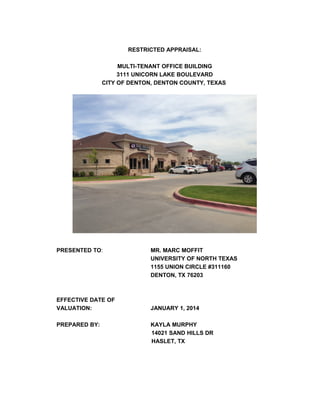
MULTI-TENANT OFFICE BUILDING
3111 UNICORN LAKE BOULEVARD
CITY OF DENTON, DENTON COUNTY, TEXAS
PRESENTED TO: MR. MARC MOFFIT
UNIVERSITY OF NORTH TEXAS
1155 UNION CIRCLE #311160
DENTON, TX 76203
EFFECTIVE DATE OF
VALUATION: JANUARY 1, 2014
PREPARED BY: KAYLA MURPHY
14021 SAND HILLS DR
HASLET, TX
2. May 5, 2014
MR. Marc Moffit
University of North Texas
1155 Union Circle #311160
Denton, TX 76203
Re: The Parks at Unicorn Lake Blk B Lot 6
Dear Mr. Moffit
Per your request, investigations and analyses have been concluded to determine a market value
estimate of the leased fee estate in the subject property, "as is". It is the appraiser’s understanding
that the intended use of this restricted appraisal report is to assist the client in evaluation of class
assignment. The appraiser has read and attempted to comply with the Uniform Standards of
Professional Appraisal Practice as approved by the Appraisal Standards Board and promulgated by
the Appraisal Foundation; and believe this report is in compliance with the aforementioned.
Based upon the data, analyses and conclusions, the Market Value of the leased fee estate interest
in the subject property, "as is", as of January 1, 2014, subject to the specific and general underlying
assumptions and limiting conditions, set forth in this report, is:
- - TWO MILLION TWO HUNDRED THOUSAND DOLLARS - -
- - - $2,200,000 - - -
My firm appreciates the opportunity to provide this appraisal for you. If we can be of further service,
please contact us.
Respectfully submitted,
KJ MURPHY LLC.
____________________________
Kayla Murphy, President
Career Student
14021 Sand Hills Dr.
Haslet, TX 76052
(432) 425-3734
3. SUMMARY OF PERTINANT INFORMATION
Client/Intended user Marc Moffit (Client)
Intended Use Assist the client in evaluation of a class assignment
Identification of Property
Multi-tenant Office building, 3111 Unicorn Lake boulevard Denton,
TX
Current Use Office/Medical
Ownership History
Bushwood Properties, LLC has held ownership since January
2009.
Bushwood has been the sole owner of this building since
construction.
Highest and Best Use Continue in the current use as an office facility.
Real Property Interest Valued Leased Fee Estate
Purpose of Assignment
To develop an opinion of the market value as defined by the
agencies that regulate financial institutions in the United States
and published by the Appraisal Institute in the Dictionary of Real
Estate Appraisal, 3rd
Edition.
Effective Date of Value Opinion January 1, 2014
Date of Report May 5, 2014
Scope of Work
Provide a restricted appraisal in conformance with USPAP.
Investigations and analysis were implemented to estimate subject
property value. There is limited presentation of information in this
report. Supporting documentation, adequate to prepare a
Summary report, is retained in the appraiser’s file. The Cost
Approach, Sales Comparison Approach and Income Approach are
developed to estimate subject property value.
Report Option
This report is a Restricted Appraisal Report in accordance with
Standards Rule 2-2 (c) of the Uniform Standards of Professional
Appraisal Practice. As such, it presents limited discussions of the
data, reasoning and analysis that were used in the appraisal
process to develop the appraiser’s opinion of value. Supporting
documentation concerning the data, reasoning and analysis is
retained in the appraiser’s file.
Extra-Ordinary Assumptions None
Hypothetical Conditions None
Departures from Standard 1 None
Market Value Estimate $2,200,000
Marketing Period 1-Year
4. SUMMARY HIGHEST AND BEST ANALYSIS
Highest and Best Use, As Vacant
4
AREA COMMENTARY
The subject property is situated in the D/FW Region. The region experienced economic decline from
2008-2010, showing some gradual improvements in 2011-2013. Conditions in D/FW are superior to
the majority other Metro areas in the U.S. Job growth remains positive, exceeding most areas of the
State and Nation, solid increase noted from mid-year 2012-2013. Subsequently to most property
types being over-built during the peak period of 2006-2008, new construction has slowed and
absorption is positive for most property types within the region, some types and submarkets
approaching equilibrium demand/supply. The subject property is located in the southern section of
the community of Denton in an area of relatively new commercial and multi-family uses as well as
relatively new residential communities. The area remains in the growth stage of the real estate life
cycle. Stable population increases are noted and some new commercial development is evident,
mainly being single-tenant/service industry/office uses. There is a major hospital across the highway
it is located near (Denton Regional Hospital) that houses an entire medical complex office on its
campus as well.
SITE COMMENTARY
Site Size 44,031 SF (1.1081-Acre)
Site Shape Generally Rectangular
Thoroughfare frontage
Private drive frontage (2-lanes, concrete-paved) within close
proximity to Interstate 35, a major highway.
Topography Gently rolling and above street grade.
Easements/Encroachments
None Detrimental. Shared access and utility easements pose
no adverse impact.
Hazards Nuisances None Detrimental
Flood Plain
Non-Hazardous portion of Zone X, outside of the 100-Year flood
plain.
Utilities All Available
Zoning
“RCC-D”, Regional Center Commercial Downtown (Allows
common commercial uses).
Tax Account/Assessment Nos. 583094 Total Assessment is $46,361.25
Immediate Area Uses
The subject is near a man-made lake, additional office Facility’s
and a moderate sized commercial tract that extends to Unicorn
Lake Blvd. and I35, being held for future development. An office
use is highly compatible with immediate area uses.
IMPROVEMENTS COMMENTARY
11,492 SF Good to Excellent Class C Office Facility. Interior finish-out is in accordance with
professional office space that includes an area that has medical related finish items, as well.
Condition is rated good, reflective of construction in 2009. 20,202 SF paved parking area as well as
a 6,600 SF land scape that is in good condition. The L:B Ratio is 3.83:1
5. Legally Permissible: Those use-types that are legally permissible are studied further in regard to
physical suitability and feasibility of development. The subject property exhibits a zoning
designation that allows for common commercial uses, including office and retail.
Physically Possible: From a physical standpoint, the subject site is suited to various types of
commercial development. All utilities are available with no significant adverse characteristics noted.
Financially Feasible:The uses that are physically possible and legally permissible must be
analyzed further to determine those that are likely to produce some income, or return, greater than
the combined income needed to satisfy operating expenses, financial expenses, and capital
amortization. All uses that are expected to produce a positive return are regarded as financially
feasible.
Retail: As mentioned, common retail uses are legally permissible and physically possible on the
subject site. Even so, the subject property exhibits location rated too secondary to support a
speculative retail related use, which is a property type commonly situated along primary
thoroughfares and intersections that exhibit added traffic exposure. Taking this into consideration,
retail uses are not considered further in regard to financial feasibility.
5
6. Office: In assessment of office market conditions, the primary source for data was Costar
Property. Market conditions for the region, a submarket area more specific to the subject and
immediate surrounding area, are evaluated in following paragraphs.
D/FW Region: The following table summarizes office market conditions and trends in the region:
Office vacancy levels have remained above the stabilized level during the last five years. The
D/FW region has remained overbuilt with office space since the 1980’s. Solid positive net
absorption is noted from 2005 to 2008; however, demand was unable to keep pace with a large
level of new space being added. Absorption was negative in 2009 and the first part of 2010, turning
positive by a small level in 2011-2013. Office space deliveries are reduced relative to preceding
years; however, some are noted with demand keeping pace with a reduced level of new additions,
resulting in reduced vacancy relative to the last 4 years. Average rents are reported at $20.30/SF,
according to a full service lease structure. Overall, the D/FW area is over-supplied with office
space, a trend that has remained in recent decades. Speculative development is warranted only in
select submarkets and key development nodes.
6
7. Immediate Subject Area: The appraiser reviewed information regarding market conditions of
office properties within the community of Denton, which is considered the competitive market area
for the office property type.
Office vacancy in the Denton area at 9% is notably below that of the DFW region at 15%, which is
generally considered to be at the stabilized level. Vacancy drastically declined during the second
quarter of 2013, subsequent to peaking at approximately 10.5% in the first quarter of 2103. New
deliveries in 1Q10 resulted in an increase in vacancy but the space has subsequently absorbed.
Average rents are $19.39/SF, according to a full service lease structure. The Market has an
oversupply of office space as we can see by multiple negative Absorption dips in 2009, 2010, 2011,
2012, and even in 2013. Even so, the subject property exhibits very good competitive location
rating for an office facility. Even with the negative indications of the submarket this office is located
in an area that features new construction and seeing early market growth in a preferred location.
Maximally Productive: Those uses that are legally permissible and physically possible
include common commercial uses, such as office and medical uses. The timing for development
for office/medical use space is considered similar based on immediate area market conditions.
Competitive location rating is considered good for office and better for medical use, the property
including frontage on a thoroughfare that provides primary interior neighborhood ingress-egress,
and being located near a major medical district allows better exposure to better accommodate
medical and retail uses in the area. The subject site exhibits size that is well-suited to multiple-
7
8. tenant commercial uses. The typical purchaser for a site with characteristics to the subject would be
a multiple-tenant/end-user.
Giving consideration to the preceding, the highest and best use of the subject property is to market
for multiple-tenant/end-user related commercial.
HIGHEST AND BEST USE OF THE SITE, AS IMPROVED
The subject site is improved with a multi-tenant office facility. The improvements are functional in
layout and design. The value of land and improvements notably exceeds land value. Demolishing
or altering the improvements would not result in a property value exceeding the current value of
land and improvements. The subject is a good to excellent quality facility; however, it is common
for top quality facilities to be constructed in the immediate competitive area. Therefore, considering
the preceding, the highest and best use of the subject, as improved, is to continue in the current
use.
8
9. APPRAISAL PROCESS – SUMMARY FORMAT
The Cost Approach, Sales Comparison Approach and Income Approach are developed in order to
estimate the subject property value. The Cost Approach is developed on the basis of the cost of a
suitable replacement of the improvements with depreciation taken into account based on the
age/life method. The Sales Comparison Approach is based on similar buildings equal in use,
design and construction as the subject. Finally, the Income Approach to value analyzes property
value based on net income applied to market supported return requirements.
9
10. COST APPROACH – SUMMARY FORMAT
The appraisal approach utilized to estimate the value of the subject land as of the date of this report
is the Sales Comparison Approach, an approach in appraisal analysis that is predicated on the
assumption that an informed purchaser would pay no more for a property than the cost of acquiring
an equally desirable substitute in the open market.
Land Value Estimate: In order to estimate subject property land value, the appraiser reviewed
comparable sales information regarding comparably adapted properties completed during recent
years in various sections of the competitive market area. The subject property exhibits secondary
thoroughfare frontage in an area mainly composed of office related uses. The typical sales price
range for small secondary commercial tracts was determined to be approximately $8.00/SF to
$11.00/SF. The upper-end of the range is reflective of sites with added traffic exposure relative to
the subject with the lower-end being reflective of sites that have slightly inferior submarket position,
situated a greater distance from major community hospitals and areas of relatively new office
development, such as the subject location. Based on consideration of subject and physical
characteristics, a unit land value estimate of $10.00/SF is deemed reasonable for the subject
property. The concluding subject property land value estimate is provided, as follows:
$10.00/SF x 44,031 SF = $440,310
10
11. IMPROVEMENTS COST ANALYSIS
Replacement Cost New: The first step in determining the cost of reproduction or replacement is to
determine which cost is most applicable. Replacement cost estimates are based on substitute
materials of equal utility and allow for the benefit of changing construction standards. A summary of
replacement cost new is provided in the following table:
Improvements Quantity Unit Unit Price Total
Office Building 11,492 SF 137.21 $1,576,840
Parking/Drives 20,202 SF 4.03 $81,414
Landscaping 6,600 SF 4.98 $32,868
Total Hard Costs $1,691,122
Estimated Total Soft Costs (Approx. 5% Hard Costs) $84,556
Enreprenurial Profit (Approx. 10% Hard Costs) $169,112
TOTAL REPLACEMENT COST NEW $1,944,790
REPLACEMENT COST NEW
Building cost is within the ranges established for good to excellent quality office space. A common
level of soft costs (5% Hard Costs) is included. Entrepreneurial profit is not typically associated with
small garden office facilities so none is applied. .
Depreciation: Physical depreciation, incurable, is defined as that loss from cost new, which is
impossible to offset or which would involve expenditure substantially in excess of the value increase
caused by the expenditure. This type of depreciation results from typical wear and tear associated
with age. The building and site improvements were constructed approximately 5 years ago with
effective age being commensurate with actual age. The effective life span for the property type is
45 years, subject effective age being commensurate with actual age. A summary of physical
incurable depreciation is provided in the table on the following page.
11
12. Improvements Depreciation Total
Office Building 9% $141,916
Parking/Drives 20% $16,283
Landscaping 20% $6,574
Total Physical Incurable Depreciation $164,773
PHYSICAL INCURABLE DEPRECIATION
5 Year Effective Age / 45 Year Life Span
5 Year Effective Age /20 Year Life Span
5 Year Effective Age / 20 Year Life Span
Physical curable depreciation results from deferred maintenance. The subject is well maintained
with no deferred maintenance noted. No deduction is made for physical curable depreciation.
In addition to physical depreciation, functional and external obsolescence must be examined.
External obsolescence is the diminished utility of the building caused by negative influences such
as neighborhood decline, the property's location in a community, and/or area market conditions. No
added depreciation due to these factors are noted. Although decline in economic climate is noted
in recent years, unit price trends of small office facilities have not declined by a level that would
warrant deduction of this depreciation item.
Functional obsolescence is an element of depreciation that is caused by a deficiency or
superadequacy in the materials or design of the building. No superadequacy or deficiency in the
improvements is noted. The subject exhibits good to excellent quality construction components. It
is common to construct good to excellent quality properties in submarkets exhibiting characteristics
similar to the subject area.
12
13. COST APPROACH CONCLUSION
The following tables summarize cost approach value conclusions:
TOTAL COST SUMMARY
Total Replacement Cost New $1,944,790
Less: Physical Incurable Depreciation ($163,773)
Less: Physical Curable Depreciation -0-
Less: Functional Obsolescence -0-
Less: External Obsolescence -0-
Depreciated Cost of Improvements $1,781,017
Add: Land Value $440,310
Total Value Indicated Via Cost Approach $2,221,327 Rounded to $2,300,000
COST APPROACH VALUE CONCLUSION
$2,300,000
13
14. SALES COMPARISON APPROACH – SUMMARY FORMAT
The Sale Price Per Square Foot (SP/SF) unit of comparison is derived by dividing the sale price by
the net rentable area (NRA). This physical unit of comparison can be adjusted to account for
dissimilarities between market sales and the subject property. This unit of comparison is then
applied to the subject's net rentable area to indicate a value for the subject property. The SP/SF
Method is developed in this report. A summary of comparable sales deemed indicative of subject
property value is provided in the following table with more detailed information and photographs
provided in the Addenda section of this report.
14
15. CAMERON APPRAISAL GROUP
SUMMARY OF COMPARABLE IMPROVED SALES
Sale No. & Date Location
NRA (SF)
L:B Ratio
Quality of Construction
Y.O.C.
SP/SF
1
04/13
3351 Colorado Blvd. Denton,
TX
2,711
6.0:1
Good-Exc Class C Medical Office
Condominium
2008
$193.82
2
10/12
1901 Wind River Lane Denton,
TX
8,576
4.32:1
Good Class B Medical Office
Facility
2005
$202.60
3
05/09
3321 Unicorn lake Blvd
Denton, TX
5,800
5.4:1
Good-Exc Class C Medical Office
2008
$260.00
4
05/11
3303 Colorado Blvd Denton,
TX
4,061
9.9:1
Good Class C Office Facility
2003
$198.23
5
08/12
3317 Unicorn Lake Blvd
Denton, TX
5,500
Good-Exc Class B Medical Office
Facility
2009
$189.73
SP/SF ADJUSTMENT ANALYSIS
15
Subject
Comp 6 & 3
Comp 5
Comp 2 & 4
Comp 1
16. Property Rights Conveyed: All sales transactions were reported to be common leased fee/fee
simple conveyances with no adjustments warranted.
Conditions of Sale: Buyer/seller motivation is considered typical among each of the comparable
sales with no adjustments applied.
Financing Terms: All of the comparable sales were reported to have occurred on either a cash
basis or with the grantee obtaining financing at prevailing market rates. Therefore, no adjustments
are warranted.
Market Conditions: The sales utilized in this analysis occurred between May 2009 and April 2013.
The Sales occurred during a time frame when unit sales price trends have remained generally
similar, subsequent to decline in economic climate being evident. No adjustments are applied.
Location: Sales 2, 3, and 5 are located in the immediate subject neighborhood, exhibiting
similar access/visibility, secondary thoroughfare frontage and immediate area office use intensity,
resulting in no adjustments being applied. Sales 1 and 5 exhibit similar secondary thoroughfare
frontage; however, the properties are situated in a more medical specific location nearer to the
hospital, submarket position rated very similar, no adjustments made.
Size: The subject is an 11,492 SF facility. All comps except for 2 and 3 involved facilities that are
slightly smaller and in a similar size category, ranging from 2,711 SF to 5,800 SF, warranting 10%
downward adjustment for comp 3 seeing that it was gaining a higher price per square foot. Comp 2
received only a 5% boost for size. Comp 5 also received a 10% upward adjustment.
Land to Building Ratio: The subject exhibits a 3.83:1 land to building ratio, within the common
range for the property type. All of the comparable sales exhibit a land to building ratio within the
common range noted for the property type. Sale 4 exhibits larger 9.9:1 land to building ratio;
however, a portion of the property is drainage area with useable site area having common land to
building ratio. No adjustments are applied in this category.
Construction Quality: The subject is a good to excellent quality Class C office facility that includes
professional office finish-out. All of the comps chosen display very similar Good to excellent class
16
17. C, or for Comp 2 class B type construction with very similar brick exterior, this warranting no
adjustments for construction quality.
Condition/Age:
Comps 1, 2, 4, and 5 involved properties built in the mid to late 2000’s, being rated generally equal
to the subject in this category with no adjustments applied. Sale 4 exhibits modestly increased
effective age, constructed in 2003 with a modest 5% upward adjustment applied. Sales 3, although
being built in 2008, displays excellent condition and age therefore this comp received a downward
-10% adjustment.
Sale No. 1 2 3 4 5
SP/SF $184.59 $202.60 $260.00 $172.37 $172.48
Conditions of Sale 0% 0% 0% 0% 0%
Adjusted SP/SF $184.59 $202.60 $260.00 $172.37 $172.48
Financing Terms 0% 0% 0% 0% 0%
Adjusted SP/SF $184.59 $202.60 $260.00 $172.37 $172.48
Market Conditions 0% 0% 0% 0% 0%
Adjusted SP/SF $184.59 $202.60 $260.00 $172.37 $172.48
Location 0% 0% 0% 0% 0%
Size 5% 0% -10% 5% 10%
Land to Building Ratio 0% 0% 0% 10% 0%
Quality of Construction 0% 0% 0% 0% 0%
Condition/Age 0% 0% -10% 0% 0%
Net Adjustment 5% 0% -20% 15% 10%
Adjusted SP/SF $193.82 $202.60 $208.00 $198.23 $189.73
Mean Adjusted SP/SF $198.47
Median Adjusted SP/SF $198.23
IMPROVED SALES ADJUSTMENT GRID
The adjusted sale price range is $189.73/SF to $208/SF with mean/median adjusted sale prices
stated above. Similar emphasis is placed on the adjusted sales price range, overall. In
reconciliation, the value estimate determined via the Sales Comparison Approach is $198.47/SF x
11,492 SF = $2,280,817.24 rounded to $2,300,000.
SALES COMPARISON APPROACH VALUE CONCLUSION
$2,300,000
17
18. THE INCOME CAPITALIZATION APPROACH – SUMMARY FORMAT
In order to estimate the subject property value via the Income Approach, the Direct Capitalization
Method and DCF Method are employed. The appraiser confirmed quoted and actual lease data for
similar lease space in the subject submarket area, subsequently evaluated relative to actual income
received at the subject facility.
Rental Trends: The following ranges are according to NNN lease structure, which is
common of office facilities with similar characteristics to the subject. Relatively new office facilities
in the subject competitive market area typically range from $14.00/SF to $19.00/SF. The lower-end
of the range is for professional office space positioned an added distance from area hospitals and
sections of the community that have a high concentration of relatively new office facilities.
Professional office space in areas composed primarily of relatively new office facilities commonly
exhibit a range of $15.00/SF to $17.00/SF while medical office space with good competitive location
rating typically command a range of $17.00/SF to $19.00/SF. Preceding rental rate ranges are
down $1.00/SF to $2.00/SF relative to period of peak market conditions in 2006-2007.
Actual Income/Gross Rent Revenues (GRR): The subject property rent roll is provided, as
follows:
SUMMARY OF SUBJECT RENTAL INFORMATION
Tenant Rental (SF)
Current Lease
Rate/SF
Rental Information
Internal Medicine Assoc.
(Property Owner)
3,605
$20.00
NNN
Lease Term: 1/1/2007-1/1/2014
Liberty Insurance 4,300
$16.00
NNN
Lease Term: 11/1/2011-11/1/2017
Lease Rate Escalates to $16.50/SF in
1/1/2014
Dr. Smith, Cardiologist 3,587
$18.00
NNN
Lease Term: 11/1/2011-11/1/2018
Lease Rate Escalates to $19.00/SF in
1/1/2015
These rents are in the higher and even surpassing the average market rent that is typical of this
office type facility. Being as this office is relatively new (5 years old), in excellent condition, and in
an area of town that is considered to be prime location it demands and retains rents that are topping
the market average for this area.
18
19. TENANT SIZE (SF) Rate/$SF Annual
Retail Space:
Internal Medicine Assoc. 3,605 20.00 $72,100
Liberty Insurance 4,300 16.00 68,800
Dr. Smith, Cardiologist 3,587 18.00 64,566
Total GRR: 11,492 205,466
GROSS RENT REVENUES (GRR)
Reimbursement Income: In our estimation of Potential Gross Income (PGI), pass-through
income paid by the tenant for property expenses are added to the gross rental revenue. Gross
rental revenue is estimated according to NNN leases where the tenants pay pro-rata share of
property tax, insurance and common area maintenance (C.A.M). Management expense is also
commonly reimbursed for suburban office facilities in the area, included as reimbursement income
below. The additional pass-through income is summarized as follows:
Property Tax: $ 44,074
Insurance: $ 4,022
C.A.M. $ 14,365
Management $ 8,219
Total Pass-through Income: $ 70,680 ($6.15/SF)
Potential Gross Income (PGI): Pass-through income generated by tenant payment of NNN
expenses is an addition to gross income. Adding Gross Rental Revenue to Pass-through Income
results in a PGI estimate of $276,146 ($205,466 + $70,680).
Vacancy/Credit Loss: The comparable rentals commonly exhibit vacancy above the stabilized
level. Even so, all were small properties that exhibited only one or two vacant rental units with a
number of properties within the subject development and immediate neighborhood retaining full
occupancy, particularly small facilities. The subject is fully occupied, including a portion by the
owner, therefore a stabilized V/CL estimate of 9% is deemed appropriate.
Effective Gross Income (EGI): EGI is determined from subtracting V/CL from PGI with the
estimate provided in stabilized operating pro-forma provided on the following page.
Operating Expenses: Operating expenses are estimated from various sources. Sources include
actual expenses confirmed for the property. Management is estimated at 4% GRR. Maintenance
and insurance expense are in accordance with the market. A common reserve allowance is
applied, as well as a small level of miscellaneous expense to cover un-scheduled expenses. Tax
expense is according to the actual expense for 2012. The operating expenses are summarized in
the stabilized operating pro-forma below.
19
20. Net Operating Income (NOI): NOI is the anticipated net income remaining after deducting all
operating expenses from effective gross income. Resulting NOI from estimated income less
operating expenses is summarized in the following table:
Per SF
Total GRR: 205,466 $17.88
Add: NNN Reimbursement: 70,680 $6.15
PGI: $276,146 $24.03
Less: V/CL: (24,853) ($2.16)
Total EGI $251,293 $21.87
Less: Operating Expenses:
Expense Per SF
Property Tax 44,074 3.84
Management 8,219 0.72
Insurance 4,022 0.35
Maintenance/Repairs 14,365 1.00
Reserves 1,724 0.15
Miscellaneous 575 0.05
Total Expenses ($72,978) (6.35)
Net Operating Income $178,314 15.52
STABILIZED OPERATING PRO-FORMA
Direct Capitalization: The appraiser considers Ro ranges that are reported by market sources,
according to survey information. The main source of information is provided by Realtyrates.com,
which compiles direct capitalization rates from surveying market participants, specific to property
type. The information is as of 2Q13, summarized in the following table:
20
21. In reconciliation, an Ro estimate within and toward the upper-end of the range estimated from
comparable sales and similar and modestly below the average range in the table above is
considered reasonable for the subject property. The concluding Ro estimate is 9 %. The indicated
value determined by the Direct Capitalization Method is provided as follows:
$196,264 NOI ÷ 0.09 = $2,180,711, rounded to $2,200,000.
21
22. DISCOUNTED CASH FLOW ANALYSIS
Income Projection
The appraiser constructed a 5-year discounted cash flow (DCF) model for the subject property.
Income projection is in accordance with actual remaining lease terms associated with the subject
space. Any increases during the course of remaining lease term are reflected. Subsequent to
leases expiring, annual rent is increased 5% annually in following years, in accordance with
inflation/CPI and expense increase.
Vacancy/Collection Loss
In the DCF Model, vacancy/collection loss is projected at 9% during the holding term. The subject
is a small facility that is currently 100% occupied, a small level of vacancy associated with periodic
tenant turn-over being considered reasonable.
Operating Expense Projection
Operating expenses are increased 2.5% annually to take inflation and increasing costs into
consideration. Management expense is projected at 4% gross rent revenues through the holding
period.
Reversion: The estimated net operating income for Year 6 is capitalized at a terminal rate of 9%.
The slightly higher direct capitalization rate associated with the reversion is reflective of added
depreciation over the holding period. Year 11 NOI is based on projected rental income increasing
in accordance with lease agreements or by 2.5% from Year 10 with 5% V/CL loss factor. A 3%
Cost of Sale estimate is deducted from the reversion sale price to reflect brokerage commission
paid by the seller.
Derivation of the Discount Rate: The rate used to discount the projected cash flows reflect
acceptable expectations of yields to be achieved by investors currently dealing with similar
properties. Yield rates differ from direct capitalization rates (such as the equity dividend rate) in that
all equity benefits, including equity reversion at the time of resale and the annual cash flow are
taken into consideration.
22
23. Based on alternative yield analysis, a common yield rate range of 8.35% to 11% is indicated. In
addition to alternative yield study, the appraiser referred to the Investor Survey, 3rd Quarter 2013
by RealtyRates.com (data is as of 2Q13), considered most appropriate for the property type. For
property types most similar to the subject, the discount rate range is summarized in the table on the
following page.
A discount rate estimate at the upper-end of the alternative investment range and slightly below the
average in the table above is considered reasonable for the subject. The discount rate estimate for
the subject is 9.0%.
23
24. YEAR 1 YEAR 2 YEAR 3 YEAR 4 YEAR 5 REVERSION
Base Rental Revenue $205,466 $208,271 $208,271 $214,899 $214,899 $220,272
NNN Reimbursements: 72,967 74,698 76,357 78,322 80,066 82,067
PGI $278,433 $282,969 $284,628 $293,222 $294,965 $302,339
Less: Land Lease V/CL (25,059) (25,467) (25,616) (26,390) (26,547) (27,211)
Total EGI $253,374 $257,501 $259,011 $266,832 $268,418 $275,129
Less Expenses
Property Tax 46,361 47,520 48,708 49,926 51,174 52,453
Management 8,219 8,331 8,331 8,596 8,596 8,811
Insurance 4,022 4,123 4,226 4,331 4,440 4,551
Maintenance/Repairs 14,365 14,724 15,092 15,470 15,856 16,253
Reserves 1,724 1,767 1,811 1,856 1,903 1,950
Miscellaneous 575 589 604 619 635 651
Total OE (75,265) (77,054) (78,772) (80,798) (82,603) (84,668)
NOI: $178,108 $180,448 $180,239 $186,034 $185,815 $190,460
DCF: $161,917 $149,130 $135,416 $127,064 $115,377
Reversion Derived From Direct Capitalization of 6th Year NOI: $2,116,226
Less: Sales Commission Estimate: (63,487)
Net Sale Proceeds: $2,052,740
Present Value of Future Sale: $1,274,590
Net Present Value Of Cash Flows $688,903
Total Value Estimate: $1,963,493
SUBJECT PROPERTY VALUE ESTIMATE: (Rounded)
DISCOUNTED CASH FLOW MODEL
$2,000,000
24
25. INCOME APPROACH CONCLUSION
The appraiser estimated the subject property value by applying the Direct Capitalization Method
and Discounted Cash Flow Analysis. The resulting value conclusions are as follows:
Method Value Estimates
Direct Capitalization $2,200,000
DCF Analysis $2,000,000
Emphasis is placed on both methods, which had highly similar value indications, exhibiting less
than 5% variance. In reconciliation, the value estimates for the subject property determined via the
Income Approach are provided, as follows:
INCOME APPROACH VALUE CONCLUSION
$2,100,000
25
26. FINAL RECONCILATION AND VALUE ESTIMATE
The value estimates from each approach are summarized in the following table.
SUBJECT PROPERTY VALUE ESTIMATES – IMPROVEMENTS ON UTILIZED SITE AREA
COST APPROACH $2,300,000
SALES COMPARISON APPROACH $2,300,000
INCOME APPROACH $2,100,000
The approaches utilized to estimate subject property value resulted in generally similar value
conclusions, exhibiting less than 15% variance. Most emphasis is placed on the Income
Approach considering multi-tenant property type. Remaining concluding value estimates are
similar to that determined in the Income Approach. The reconciled value estimate for the
subject is provided, as follows:
FINAL MARKET VALUE ESTIMATE
$2,200,000
26
27. CERTIFICATION OF APPRAISER
I, Kayla Murphy, certify that to the best of my knowledge and belief:
- the statements of fact contained in this report are true and correct.
- the analyses, opinions, and conclusions are limited by the reported assumptions and
limiting conditions set forth, and are my personal, unbiased professional analyses,
opinions and conclusions.
- I have no present or prospective interest in the property that is the subject of this report,
and I have no personal interest or bias with respect to the parties involved.
- my compensation is not contingent upon the reporting of a predetermined value or
direction in value that favors the cause of the client, the amount of the value estimate,
the attainment of a stipulated result, or the occurrence of a subsequent event.
- the analyses, opinions, and conclusions were developed, and this report has been
prepared, in conformity with the Code of Professional Ethics established in the Uniform
Standards of Professional Appraisal Practice for a Restricted Appraisal.
- I, Kayla Murphy, made a personal inspection of the property that is the subject of this
report.
- No one required the appraisal assignment to be based on a minimum valuation, a
specific valuation, or the approval of a loan.
- the value estimate shown on the following page is not valid unless this certification is
included in the complete appraisal.
- the reported analyses, opinions and conclusions were developed, and this report has
been prepared, in conformity with the Code of Professional Ethics and Standards of
Professional Appraisal Practice of the Appraisal Institute.
- the use of this report is subject to the requirements of the Appraisal Institute relating to
review by its duly authorized representatives.
- I, Kayla Murphy, have appraised the subject upon educational purposes set forth within
classroom assignment restrictions.
27
28. Certification of Appraiser - Continued
- Based upon the data, analyses and conclusions, the Market Value of the fee simple
estate interest in the subject property, “as is”, as of January 1 2014, subject to the
specific and general underlying assumptions and limiting conditions, set forth in this
report, is:
- - TWO MILLION TWO HUNDRED THOUSAND DOLLARS - -
- - - $2,200,000 - - -
KJ MURPHY LLC
_____________________________________
Kayla Murphy, President
Career Student
14021 Sand Hills Dr.
Haslet, TX 76052
(432) 425-3734
28