
Recommended
More Related Content
Similar to Ph.D Course_Gas chromatography.ppt
Similar to Ph.D Course_Gas chromatography.ppt (20)
Recently uploaded
Recently uploaded (20)
Ph.D Course_Gas chromatography.ppt
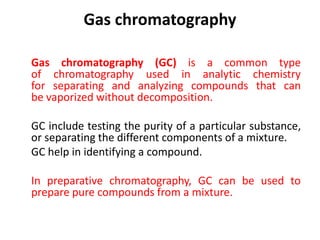
- 1. Gas chromatography Gas chromatography (GC) is a common type of chromatography used in analytic chemistry for separating and analyzing compounds that can be vaporized without decomposition. GC include testing the purity of a particular substance, or separating the different components of a mixture. GC help in identifying a compound. In preparative chromatography, GC can be used to prepare pure compounds from a mixture.
- 3. Filters/Traps Air Hydrogen Gas Carrier Column Gas Chromatography • gas system • inlet • column • detector • data system Data system Syringe/Sampler Inlets Detectors Regulators H RESET
- 4. Schematic Diagram of Gas Chromatography
- 5. Schematic Diagram of Gas Chromatography
- 7. In gas chromatography, the moving phase (or "mobile phase") is a carrier gas, usually an inert gas such as helium or an unreactive gas such as nitrogen. The stationary phase is a microscopic layer of liquid or polymer on an inert solid support, inside a piece of glass or metal tubing called a column. The instrument used to perform gas chromatography is called a gas chromatograph (or "aerograph", "gas separator"). The gaseous compounds being analyzed interact with the walls of the column, which is coated with different stationary phases. This causes each compound to elute at a different time, known as the retention time of the compound. The comparison of retention times is what gives GC its analytical usefulness.
- 8. • Gas chromatography is in principle similar to column chromatography (as well as other forms of chromatography, such as HPLC, TLC), but has several notable differences. • Firstly, the process of separating the compounds in a mixture is carried out between a liquid stationary phase and a gas moving phase, whereas in column chromatography the stationary phase is a solid and the moving phase is a liquid. (Hence the full name of the procedure is "Gas-liquid chromatography", referring to the mobile and stationary phases, respectively.) • Secondly, the column through which the gas phase passes is located in an oven where the temperature of the gas can be controlled, whereas column chromatography (typically) has no such temperature control. • Thirdly, the concentration of a compound in the gas phase is solely a function of the vapor pressure of the gas.
- 9. Gas chromatography is also similar to fractional distillation, since both processes separate the components of a mixture primarily based on boiling point (or vapor pressure) differences. However, fractional distillation is typically used to separate components of a mixture on a large scale, whereas GC can be used on a much smaller scale (i.e. micro scale). Gas chromatography is also sometimes known as vapor-phase chromatography (VPC), or gas-liquid partition chromatography (GLPC).
- 10. GC analysis A gas chromatograph is a chemical analysis instrument for separating chemicals in a complex sample. A gas chromatograph uses a flow-through narrow tube known as the column, through which different chemical constituents of a sample pass in a gas stream (carrier gas,mobile phase) at different rates depending on their various chemical and physical properties and their interaction with a specific column filling, called the stationary phase. As the chemicals exit the end of the column, they are detected and identified electronically. The function of the stationary phase in the column is to separate different components, causing each one to exit the column at a different time (retention time). Other parameters that can be used to alter the order or time of retention are the carrier gas flow rate, and the temperature.
- 11. In a GC analysis, a known volume of gaseous or liquid analyte is injected into the "entrance" (head) of the column, usually using a micro syringe (or, solid phase microextraction fibers, or a gas source switching system). As the carrier gas sweeps the analyte molecules through the column, this motion is inhibited by the adsorption of the analyte molecules either onto the column walls or onto packing materials in the column. The rate at which the molecules progress along the column depends on the strength of adsorption, which in turn depends on the type of molecule and on the stationary phase materials. Since each type of molecule has a different rate of progression, the various components of the analyte mixture are separated as they progress along the column and reach the end of the column at different times (retention time). A detector is used to monitor the outlet stream from the column; thus, the time at which each component reaches the outlet and the amount of that component can be determined. Generally, substances are identified (qualitatively) by the order in which they emerge (elute) from the column and by the retention time of the analyte in the column.
- 12. Columns • Packed columns are 1.5 – 10 m in length and have an internal diameter of 2 – 4 mm. The tubing is usually made of stainless steel or glass and contains a packing of finely divided, inert, solid support material (e.g. diatomaceous earth) that is coated with a liquid or solid stationary phase. The nature of the coating material determines what type of materials will be most strongly adsorbed. Thus numerous columns are available that are designed to separate specific types of compounds. • Capillary columns have a very small internal diameter, on the order of a few tenths of millimeters, and lengths between 25–60 meters are common. The inner column walls are coated with the active materials (WCOT columns), some columns are quasi solid filled with many parallel micropores (PLOT columns). Most capillary columns are made of fused- silica(FSOT columns) with a polyimide outer coating. These columns are flexible, so a very long column can be wound into a small coil.
- 13. Detectors A number of detectors are used in gas chromatography. The most common are the flame ionization detector (FID) and the thermal conductivity detector(TCD). Both are sensitive to a wide range of components, and both work over a wide range of concentrations
- 14. Methods • The method is the collection of conditions in which the GC operates for a given analysis. Method development is the process of determining what conditions are adequate and/or ideal for the analysis required. • Conditions which can be varied to accommodate a required analysis include inlet temperature, detector temperature, column temperature and temperature program, carrier gas and carrier gas flow rates, the column's stationary phase, diameter and length, inlet type and flow rates, sample size and injection technique. Depending on the detector(s) (see below) installed on the GC, there may be a number of detector conditions that can also be varied. Some GCs also include valves which can change the route of sample and carrier flow. The timing of the opening and closing of these valves can be important to method development.
- 15. Carrier gas selection and flow rates Typical carrier gases include helium, nitrogen, argon, hydrogen and air. Which gas to use is usually determined by the detector being used.
- 16. Stationary compound selection The polarity of the solute is crucial for the choice of stationary compound, which in an optimal case would have a similar polarity than the solute. Common stationary phases in open tubular columns are cyanopropylphenyl dimethyl polysiloxane, carbowax polyethyleneglycol, biscyanopropyl cyanopropylphenyl polysiloxane and diphenyl dimethyl polysiloxane. For packed columns there are more options available.
- 17. Instrumentation Injection Port - Sample introduction Manual - Direct Injection Automated - Autosampler - Purge and Trap
- 21. GAS LIQUID CHROMATOGRAPHY Principles Partition of molecules between gas (mobile phase) and liquid (stationary phase).
- 22. THE CHROMATOGRAPHIC PROCESS - PARTITIONING (gas or liquid) MOBILE PHASE STATIONARY PHASE Sample out Sample in (solid or heavy liquid coated onto a solid or support system)
- 23. Most Common Stationary Phases 1. Separation of mixture of polar compounds Carbowax 20M (polyethylene glycol) 2. Separation of mixtures of non-polar compounds OV101 or SE-30 (polymer of methylsilicone) 3. Methylester of fatty acids DEGS (diethylene glycol succinate)
- 24. DETECTORS Flame Ionization Detector (Nanogram - ng) High temperature of hydrogen flame (H2 +O2 + N2) ionizes compounds eluted from column into flame. The ions collected on collector or electrode and were recorded on recorder due to electric current.
- 25. Schematic Diagram of Flame Ionization Detector Collector Jet Flame Detector electronics - 220 volts Column Chassis ground Signal output
- 26. Thermal Conductivity Detector Measures the changes of thermal conductivity due to the sample (mg). Sample can be recovered.
- 27. Thermal Conductivity Detector Principal: The thermal balance of a heated filament Electrical power is converted to heat in a resistant filament and the temperature will climb until heat power loss form the filament equals the electrical power input. The filament may loose heat by radiation to a cooler surface and by conduction to the molecules coming into contact with it.
- 28. Thermal Conductivity Basics When the carrier gas is contaminated by sample , the cooling effect of the gas changes. The difference in cooling is used to generate the detector signal. The TCD is a nondestructive, concentration sensing detector. A heated filament is cooled by the flow of carrier gas . Flow Flow
- 29. When a compound elutes, the thermal conductivity of the gaseous mixture of carrier gas and compound gas is lowered, and the filament in the sample column becomes hotter than the other control column. Its resistance increased, and this imbalance between control and sample filament resistances is measured by a simple gadget and a signal is recorded Thermal Conductivity Detector
- 30. • Responds to all compounds • Adequate sensitivity for many compounds • Good linear range of signal • Simple construction • Signal quite stable provided carrier gas glow rate, block temperature, and filament power are controlled • Nondestructive detection Thermal Conductivity Detector
- 31. Electron Capture Detector For pesticide analysis (picogram). Accept electrons of carrier gas.
- 32. Exhaust Chimney Igniter Hydrogen Inlet Column Effluent Polarizing Electrode Collector Electrode Schematic Diagram of Flame Ionization Detector
- 36. SEMI- QUANTITATIVE ANALYSIS OF FATTY ACIDS C C C Detector Response RetentionTime 14 16 18 Peak Area (cm ) Sample Concentration (mg/ml) 2 4 6 8 10 0.5 1.0 1.5 2.0 2.5 3.0 2 The content % of C fatty acids = C C + C + C = the content % of C fatty acids 14 14
- 37. TENTATIVE IDENTIFICATION OF UNKNOWN COMPOUNDS Response GC Retention Time on Carbowax-20 (min) Mixture of known compounds Hexane Octane Decane 1.6 min = RT Response Unknown compound may be Hexane 1.6 min = RT Retention Time on Carbowax-20 (min)
- 38. Response GC Retention Time on SE-30 Unknown compound RT= 4 min on SE-30 Response GC Retention Time on SE-30 Hexane RT= 4.0 min on SE-30 Retention Times
- 39. GLC ADVANTAGES 1. Very good separation 2. Time (analysis is short) 3. Small sample is needed - ml 4. Good detection system 5. Quantitatively analyzed
- 40. DISADVANTAGES OF GAS CHROMATOGRAPHY Material has to be volatilized at 250C without decomposition. R C OH CH3OH H2SO4 O R C O CH3 O CH2 O C R CH O C R CH2 O C R O O O CH3OH O R C O CH3 CH3ONa Fatty Acids Methylester Reflux + 3 Volatile in Gas Chromatography Volatile in Gas Chromatography + +
- 41. GC-MS Gas Chromatography-Mass Spectrometry An Hybrid technique which couples the powerful separation potential of gas chromatography with the specific characterization ability of mass spectroscopy. Supporting & Servicing Excellence
- 42. • GC History • What is GC • Key Components • Separation Process • GC Theory • Carrier Gas • Injectors • Columns Overview
- 43. What is GC? • GC is a Separation Technique • Sample is usually a complex mixture we require to separate into constituent components. • Why: usually to quantify some or all components e.g. Pharmaceuticals, Environmental pollutants, etc • Occasionally as a qualitative tool
- 44. What is the sample? • Usually a mixture of several components • Sample usually introduced as a liquid • Components of interest (analytes) usually in low concentrations (<1% to ppb levels) • Samples dissolved in volatile solvent
- 45. Comaparison: HPLC & GC HPLC • non-volatile samples • thermally unstable compounds • macromolecules • inorganic and ionic samples • More complex interface to Mass Spec . GC •volatile & thermally stable •rapid analysis •good resolution •easily interfaced to Mass Spec
- 46. Key components of GC • Hardware to introduce the sample • Technique to separate the sample into components • Hardware to detect the individual components. • Data Processing to process this information.
- 47. Separation Process • Sample is introduced into system via hot, vaporising injector. • Typically 1ul injected • Flow of “Carrier Gas” moves vaporised sample (i.e. gas) onto column • Column is coated with wax type material with varying affinity for components of interest • Components are separated in the column based on this affinity. • Individual analytes are detected as they emerge from the end of the column through the Detector.
- 48. Example Chromatogram (Capillary) 1 2 3 4 5 Minutes -87 0 250 500 750 mVolts 0.541 0.754 1.113 1.474 2.038 2.853 3.210 4.463 5.320 5.562 c:starexampleslevel4.run File: Channel: Last recalc: c:starexampleslevel4.run A = TCD Results 25/07/1993 18:35 WI:2 WI:4 Time Inject Point Detector Response
- 49. • 1 2 4 6 3 5 7 8 10 9 11 12 13 14 15 16 17 18 1. -HCH 2. -HCH 3. -HCH 4. Heptachlor 5. -HCH 6. Aldrin 7. Heptachlor epoxide 8. Endosulfan I 9. 4,4’-DDE 10. Dieldrin 11. Endrin 12. 4,4’-DDD 13. Endosulfan II 14. 4,4’-DDT 15. Endrin aldehyde 16. Endosulfan sulfate 17. Methoxychlor 18. Endrin ketone Analysis of Halogenated Pesticides 2ppb in Water
- 50. Chromatogram
- 51. GC Step by Step • Carrier Gas • Injector • Column – Capillary – Stationary Phase • Detectors – Mass Spectrometer
- 52. Carrier Gas Inert Helium Choice dictated by detector, cost, availability Pressure regulated for constant inlet pressure Flow controlled for constant flow rate Chromatographic grade gases (high purity)
- 53. Column Types Packed Columns Length: <2m Diameter: 1/8” & ¼” OD Capillary Columns Length: 10m to 100m Diameter: 180um, 250um, 320um & 530um I.d
- 54. • Capillary Column Flow – 250 um 1 ml/min – 320 um 1.5 ml/min – 530um up to 2.0 ml/min Typical column flow rates
- 55. Purpose of Injection • Deposit the sample into the column in the narrowest band possible • The shorter the band at the beginning of the chromatographic process - tall narrow peaks • Gives maximum resolution and sensitivity • Therefore type of injection method and operating conditions is critical in obtaining precise and accurate results
- 56. Splitless injector Design “Unique”Dual Split Vent design •Improved Precision •More Efficient Sweep Graphite/Viton Seal •Reduced Sample Contact Shortened Capillary Guide •Minimal Cold Spots •Minimal Upswept Volume Large Internal Volume •Minimum Solvent Tailing
- 57. Cross Section of PTV Injector Modern Temperature Programmable Injector (Varian 1079) Programmable Temperature Vapourising Injector
- 58. Split & Splitless Injection • Most common method of Injection into Capillary Columns • Most commonly misunderstood also! • Same injector hardware is used for both techniques • Electronically controlled Solenoid changes Gas Flow to determine Injector function.
- 59. Split Injection • Mechanism by which a portion of the injected solution is discarded. • Only a small portion (1/1000 - 1/20) of sample goes through the column • Used for concentrated samples (>0.1%) • Can be performed isothermally • Fast injection speed • Injector and septa contamination not usually noticed
- 60. Splitless Injection • Most of the sample goes through the column (85-100%) • Used for dilute samples (<0.1%) • Injection speed slow • Should not be performed isothermally • Solvent focusing is important • Controlled by solenoid valve • Requires careful optimisation
- 61. On Column Injection • All of the sample is transferred to the column • Needle is inserted directly into column or into insert directly above column o Trace analysis o Thermally labile compounds e.g Pesticides, Drugs o Wide boiling point range o High molecular weight
- 62. Large Volume Injection • To enhance sensitivity in Envoirnmental applications. • Uses 100µL syringe: Inject up to 70 µl • Very slow injection with injector temperature a few degrees below solvent boiling point, split open, flow at about 150 mls/ min • Solvent vents out of split vent, thus concentrating the analytes • Close split • Fast temperature ramp to top column temperature +20°C • Column programming as per sample requirements
- 63. Columns
- 64. Material of Construction • Metal (1957) • Glass (1959) • Fused Silica (1979) • Aluminium Clad (1984) • Inert Metal (1990)
- 65. Capillary Column Characteristics • Length (10M - 50M) • Internal Diameter (0.1mm - 0.53mm) • Liquid Stationary Phase • Film Thickness (0.1um - 5um) • Polarity (Non-polar - Polar)
- 66. Stationary Phases Choice of phase determines selectivity Hundred of phases available Many phases give same separation Same phase may have multiple brand names Stationary phase selection for capillary columns much simpler Like dissolves like Use polar phases for polar components Use non-polar phases for non-polar components
- 67. Column Bleed Bleed increases with film thickness Polar columns have higher bleed Bleed is excessive when column is damaged or degraded Avoid strong acids or bases Adhere to manufacturer’s recommended temperature limits Avoid leaks
- 68. Choosing a Column • Internal Diameter • Film Thickness • Length • Phase
- 69. Internal Diameter, Smaller ID’s • Good resolution of early eluting compounds • Longer analysis times • Limited dynamic range
- 70. ID Effects - larger ID’s • Have less resolution of early eluting compounds • Shorter analysis times • Sufficient resolution for complex mixtures • Greater dynamic range
- 71. Film Thickness Amount of stationary phase coating Affects retention and capacity Thicker films increase retention and capacity Thin films are useful for high boilers Standard capillary columns typically 0.25µm 0.53mm ID (Megabore) typically 1.0 - 1.5µm
- 72. The maximum amount that can be injected without significant peak distortion Column capacity increases with :- film thickness temperature internal diameter stationary phase selectivity If exceeded, results in :- peak broadening asymmetry leading Column Capacity
- 73. Length effects - isothermal analysis • Retention more dependant on length • Doubling column length doubles analysis times • Resolution a function of Square Root of Length • Gain 41% in resolution • Is it worth the extra time and expense?-
- 74. Length effects - programmed analysis • Retention more dependant on temperature • Marginally increases analysis times • Run conditions should be optimised
- 75. Summary - Effect of ID, Film Thickness, and Length ID • Choice based on capacity and resolution • Use 0.25mm for MSDs • Use 0.32mm for split/splitless & DI • Use 0.53mm for DI & • purge & trap Film Thickness • Thick film for low boilers • Thin film for high boilers • Thicker films for larger ID's Length Gain in resolution is not double Isothermal: tR L Programmed: tR is more dependent on temperature
- 76. Basic GCMS
- 77. • Basic Mass Spectrometry Theory • Types of Ionisation - Electronic Ionisation - Chemical Ionisation • Interpretation of Mass Spectra • Ion Trap Theory • Components of the Ion Trap Overview
- 78. Ion Trap Mass Spectrometry
- 79. Basic Mass Spec.Theory • Mass Spec. is a Microanalytical Technique used to obtain information regarding structure and Molecular weight of an analyte • Destructive method ie sample consumed during analysis • In all cases some form of energy is transferred to analyte to cause ionisation • In principle each Mass Spectrum is unique and can be used as a “fingerprint” to characterise the sample • GC/MS is a combination technique that combines the separation ability of the GC with the Detection qualities of Mass Spec.
- 80. Basic GCMS Theory(1) • Sample injected onto column via injector • GC then separates sample molecules • Effluent from GC passes through transfer line into the Ion Trap/Ion source • Molecules then undergo electron /chemical ionisation • Ions are then analysed according to their mass to charge ratio • Ions are detected by electron multiplier which produces a signal proportional to ions detected
- 81. Basic GCMS Theory(2) • Electron multiplier passes the ion current signal to system electronics • Signal is amplified • Result is digitised • Results can be further processed and displayed
- 82. Types of Ionisation • Electron impact ionisation • Chemical Ionisation
- 83. Definition of Terms Molecular ion The ion obtained by the loss of an electron from the molecule Base peak The most intense peak in the MS, assigned 100% intensity M+ Symbol often given to the molecular ion Radical cation +ve charged species with an odd number of electrons Fragment ions Lighter cations formed by the decomposition of the molecular ion. These often correspond to stable carbcations.
- 84. Electron Ionisation(1) • Sample of interest vaporised into mass spec • Energy sufficient for Ionisation and Fragmentation of analyte molecules is acquired by interaction with electrons from a hot Filament • 70 eV is commonly used • Source of electrons is a thin Rhenium wire heated electrically to a temp where it emits free electrons
- 86. Electron Ionisation • The physics behind mass spectrometry is that a charged particle passing through a magnetic field is deflected along a circular path on a radius that is proportional to the mass to charge ratio, m/e. In an electron impact mass spectrometer, a high energy beam of electrons is used to displace an electron from the organic molecule to form a radical cation known as the molecular ion. If the molecular ion is too unstable then it can fragment to give other smaller ions. The collection of ions is then focused into a beam and accelerated into the magnetic field and deflected along circular paths according to the masses of the ions. By adjusting the magnetic field, the ions can be focused on the detector and recorded.
- 87. Chemical ionisation • Used to confirm molecular weight • Known as a “soft” ionisation technique • Differs from EI in that molecules are ionised by interaction or collision with ions of a reagent gas rather that with electrons • Common reagent gases used are Methane , Isobutane and Ammonia • Reagent gas is pumped directly into ionisation chamber and electrons from Filament ionise the reagent gas
- 88. Chemical Ionisation(2) • First - electron ionization of CH4: – CH4 + e- CH4 + + 2e- • Fragmentation forms CH3 +, CH2 +, CH+ • Second - ion-molecule reactions create stable reagent ions: – CH4 + + CH4 CH3 + CH5 + – CH3 + + CH4 H2 + C2H5 + • CH5 + and C2H5 + are the dominant methane CI reagent ions
- 89. Chemical Ionisation(3) • Form Pseudomolecular Ions (M+1) – CH5+ + M CH4 + MH+ – M+1 Ions Can Fragment Further to Produce a Complex CI Mass Spectrum • Form Adduct Ions – C2H5+ + M [M + C2H5]+ M+29 Adduct – C3H5+ + M [M + C3H5]+ M+41 Adduct • Molecular Ion by Charge Transfer – CH4+ + M M+ + CH4 • Hydride Abstraction (M-1) – C3H5+ + M C3H6 + [M-H]+ » Common for saturated hydrocarbons
- 90. EI vs CI for Cocaine analysis • EI Spectrum of Cocaine • Extensive Fragmentation • Molecular Ion is Weak at m/z 303
- 91. Methane CI of Cocaine Pseudomolecular Ion and Fragment Ions
- 92. Proton Affinity • Proton Affinity Governs CI Susceptibility • The higher the affinity the more tightly bound the proton is to the parent species • The greater the difference in proton affinities between the analyte and reagent gas the more energy transferred to the protonated molecule –more fragmentation
- 93. Interpretation of Mass Spectra(1)
- 94. Intepretation of Mass Spectra(2) •The MS of a typical hydrocarbon, n-decane is shown above. The molecular ion is seen as a small peak at m/z = 142. •Notice the series ions detected that correspond to fragments that differ by 14 mass units, formed by the cleave of bonds at successive -CH2- units
- 95. Interpretation of Mass Spectra(3)
- 96. Interpretation of Mass Spectra(4) •The MS of benzyl alcohol is shown above. •The molecular ion is seen at m/z = 108. •Fragmentation via loss of 17 (-OH) gives a common fragment seen for alkyl benzenes at m/z = 91. •Loss of 31 (-CH2OH) from the molecular ion gives 77 corresponding to the phenyl cation. • Note the small peaks at 109 and 110 which correspond to the presence of small amounts of 13C in the sample (which has about 1% natural abundance).
- 97. Determining Isotope Patterns in Mass Spectra •Mass spectrometers are capable of separating and detecting individual ions even those that only differ by a single atomic mass unit. •As a result molecules containing different isotopes can be distinguished. •This is most apparent when atoms such as bromine or chlorine are present (79Br : 81Br, intensity 1:1 and 35Cl : 37Cl, intensity 3:1) where peaks at "M" and "M+2" are obtained. •The intensity ratios in the isotope patterns are due to the natural abundance of the isotopes. •"M+1" peaks are seen due the the presence of 13C in the sample.
- 98. THIN LAYER CHROMATOGRAPHY Stationary Phase ---------> Silica Gel Mobile Phase ------------->Solvent (developing)
- 100. •Examples of haloalkanes with characteristic isotope patterns. •The first MS is of 2-chloropropane. •Note the isotope pattern at 78 and 80 that represent the M and M+2 in a 3:1 ratio. •Loss of 35Cl from 78 or 37Cl from 80 gives the base peak a m/z = 43, corresponding to the secondary propyl cation. •Note that the peaks at m/z = 63 and 65 still contain Cl and therefore also show the 3:1 isotope pattern.
- 101. 1,Bromopropane
- 102. • The second MS is of 1-bromopropane. • Note the isotope pattern at 122 and 124 that represent the M amd M+2 in a 1:1 ratio. • Loss of 79Br from 122 or 81Br from 124 gives the base peak a m/z = 43, corresponding to the propyl cation. • Note that other peaks, such as those at m/z = 107 and 109 still contain Br and therefore also show the 1:1 isotope pattern.
- 103. ION TRAP THEORY
- 104. • Ionize analytes within the ion trap – Use energetic electrons to ionize • Store ions and continue to ionize until the optimum trap capacity is reached – Optimum ion time calculated by software • Increase the voltage on the Ring Electrode of the ion trap to scan ions out in order from low to high mass – This voltage-time relationship called the EI/MS Scan Function • Store the mass-intensity information as a mass spectrum
- 105. Gate Filament Ring Electrode Trapped Ions Analytes + He Carrier Gas Gate Filament Ring Electrode Trapped Ions Analytes + He Carrier Gas Filament Trapped Ions CARRIER GAS Ring electrode Gate Electron Ionization Happens Inside the Ion Trap
- 106. Mass Spectrum of Toluene
- 107. Mass Spectrum of Caffeine
- 108. Mass Spectrum of Glycerin
- 109. Mass Spectrum of Cholesterol
- 110. Mass Spectrum of Aspirin
- 111. The detector contains two filaments: one exposed only to carrier gas, while the other is exposed to the carrier gas for sample analysis. When the gas for the sample analysis is only carrier gas , the two filaments can be balanced. Instead of a direct measurement of filament temperature, the filament resistant, which is a function of temperature, is measured. Thermal Conductivity Detector
- 112. The ability of a colliding molecule to carry off heat depending on its thermal conductivity. Hydrogen and helium have high thermal conductivity and therefore will be more efficient at “cooling” a heated filament than other gases will Thermal Conductivity Detector
- 113. Thermal Conductivity Detector The TCD will respond to any substance different from the carrier gas as long as its concentration is sufficiently high enough.
- 116. Electron capture compound, X (highly electonegative element), tends to capture free electrons and increase the amount to ion recombination X (F, Cl and Br) + e X- Ion recombination : X- + N2 + = X + N2 The current will decrease and this decrease constitutes the signal. Halogens, lead, phosphorous, nitro groups, silicone and polynuclear aromatics. Insecticides, pesticides, vinyl chloride, and fluorocarbons Electron Capture Detector
- 118. HPLC
- 119. Picture of HPLC instrument
- 120. Components • Mobile phase reservoirs • HPLC Pump(s) • Mixing valves • Sample injector (manual or auto) • Column • Detector • Plumming • Mobile phase waste container
- 121. HPLC-UV Mobile Phases A and B HPLC Pump syringe 6-port valve Sample loop HPLC column Detector MP waste Jacket for controlling column temperature
- 122. HPLC Separations • Different analytes have different equilibria between the mobile phase and stationary phase • Equilibrium is dynamic; thus we can view it as a given analyte molecule spending a fraction of time dissolved in the mobile phase • Since different solutes gave different fractions, a separation of the analytes occur as they are pushed through the column by the mobile phase
- 123. Types of HPLC • Reverse-phase (polar mobile phase/non-polar stationary phase/somewhat polar analytes) • Normal Phase (non-polar mobile phase/polar stationary phase/non-polar analytes) • Adsorption (non-polar mobile phase/polar stationary phase/non-polar analytes); isomer separation • Ion-Exchange (salts/ionic stationary phase) • Size-exclusion (aqueous/gel for large MW solutes, >104)
- 124. Columns • Length (5-15 cm); much shorter than GC column • Diameter (4 mm down to 50mm) • Particle size (3, 5, or 10 mm) • Different phases bonded to silica • Typically detection limit is decreased by decreasing the column diameter • Optimal linear flow rate conserved; so optimal volumetric flow rate decreases with the square of the radius • 4 mm/ 1.0 mL/min; 1 mm/60 mL/min
- 125. Reversed phase stationary phase • Most common; n-octyldecyl, C18 Si-O-Si-(CH2)17-CH3 CH3 CH3 Si-O-Si-(CH 2 ) 17 -CH 3 CH 3 CH 3 Si-O-Si-(CH 2 ) 17 -CH 3 CH 3 CH 3 Si-O-Si-(CH 2 ) 17 -CH 3 CH 3 CH 3
- 126. P P C18 Phase designed to retain very polar compounds
- 127. Reverse-phase mobile phases • Water • Methanol • Acetonitrile • THF • Additives, salts, acids, bases • Ion pairing
- 128. Gradients in reverse-phase • For complex mixtures • Polar non-polar – Buffer A 100 % H2O – Buffer B 100 % MeOH or acetonitrile
- 129. 0 5 10 15 20 25 30 35 40 45 Time (min) 0 5 10 15 20 25 30 35 40 45 50 55 60 65 70 75 80 85 90 95 100 Relative Abundance 11.36 17.23 12.57 12.74 17.68 36.21 1.21 15.13 24.95 24.53 22.46 2.54 3.01 21.73 5.43 6.14 25.20 20.41 48.55 27.31 37.18 29.53 32.43 40.11 45.43 RP-HPLC Separation of a Tryptic Digest of BSA
- 130. HPLC Method Development • Isocratic, Fig 25-25 Harris • Find the best methanol separation • Use Table 25-25 to guide you in finding the best acetonitrile and THF separations • Based on separations try binary mixtures – Methanol, 38 % – Acetonitrile, 30 % – THF, 22 % – 19 % MeOH/15% acetonitrile, 15 % acetonitrile/11% THF, 19 % MeOH/11% THF – Trinary mixture, 13:10:7 • Temperature/computer simulations
- 131. Gradients • First step – long, simple gradient – Adjust accordingly – Can become complex • Do you need a gradient? If Dt/tG > 0.25, then a gradient is appropriate Dt = time between first and last peak tG = time of gradient
- 132. RT: 0.00 - 35.03 0 2 4 6 8 10 12 14 16 18 20 22 24 26 28 30 32 34 Time (min) 0 5 10 15 20 25 30 35 40 45 50 55 60 65 70 75 80 85 90 95 100 8.59 10.02 12.56 3.15 2.99 13.93 3.60 14.61 2.38 5.53 16.89 17.78 7.53 20.03 1.70 22.71 32.84 29.14 31.25 25.24 27.28 NL: 2.27E8 Base Peak F: + c ESI Full ms [ 300.00- 1300.00] MS chem361gbsaf Dt = 22-8 = 14 min tG = 22-4 min = 18 min Dt/tG = 14/18 = 0.63 > 0.25
- 133. Normal Phase • Bare silica – Mobile phases, (ethyl acetate/ hexane) • HILIC columns – Attach polar groups to silica – Methanol to water
- 134. Ion Exchange • Ion exchange resins – Strong cation, -SO3 -H+ – Weak cation, - COO-H+ – Strong anion, - N(CH3)3 +OH- – Weak anion, - NH3 +OH- • Bound to polystyrene support • Mechanism – RSO3 -H+ + P RSO3 -P+ + H+
- 135. Ion Exchange Gradients • Mobile Phase A – H2O • Mobile Phase B – 500 mM NaAc
- 136. Ion chromatography • Separation of small ionic species – PO4 3+, SO4 2-, BrO3-, NO2-, F-, Cl-, ect – Mg2+, Na+, Ca2+, Li+, Ba2+, ect – -Detected by differences in conductivity
- 137. Size Exclusion Chromatography • Stationary phase is a gel • Fractionates sample on the basis of size • Elution volume vs. molecular weight • Pore size of the gel defines the MW range • Exclusion limit – (10 6), permeation limit (103) • Ve = V0 + KVi • Large molecules can not diffuse into the pore, Ve = V0
- 138. Stationary and Mobile phases • Gel filtration – hydrophilic packing (styrene and divinylbenzene) and aqueous mobile phase • Gel permeation –hydrophobic packing (sulfanated divinylbenzenes and polyacrylamides) and non-polar organic mobile phases
- 139. Affinity Chromatography • A “handle” is attached to a solid support, which is packed into a column • This handle selectively binds to a certain analyte or group of analytes • Examples – Antibodies to capture specific proteins – avidin binds to biotin
- 140. ICAT reagent • Selectively capture cysteine-containing peptides Wall of column avidin biotin linker iodoacetamide C S A T W M P A
- 141. Introduction • HPLC is a form of liquid chromatography used to separate compounds that are dissolved in solution. HPLC instruments consist of a reservoir of mobile phase, a pump, an injector, a separation column, and a detector. • Compounds are separated by injecting a sample mixture onto the column. The different component in the mixture pass through the column at differentiates due to differences in their partition behavior between the mobile phase and the stationary phase. The mobile phase must be degassed to eliminate the formation of air bubbles.
- 142. HPLC system
- 143. FOUR TYPES OF LIQUID CHROMATOGRAPHY • Partition chromatography • Adsorption, or liquid-solid • chromatography • Ion exchange chromatography • Size exclusion, or gel, chromatography
- 144. COMPOSITION OF A LIQUID CHROMATOGRAPH SYSTEM • Solvent • Solvent Delivery System (Pump) • Injector • Sample • Column • Detectors (Diode Array) • Waste Collector • Recorder (Data Collection)
- 145. Uses of HPLC • This technique is used for chemistry and biochemistry research analyzing complex mixtures, purifying chemical compounds, developing processes for synthesizing chemical compounds, isolating natural products, or predicting physical properties. It is also used in quality control to ensure the purity of raw materials, to control and improve process yields, to quantify assays of final products, or to evaluate product stability and monitor degradation. • In addition, it is used for analyzing air and water pollutants, for monitoring materials that may jeopardize occupational safety or health, and for monitoring pesticide levels in the environment. Federal and state regulatory agencies use HPLC to survey food and drug products, for identifying confiscated narcotics or to check for adherence to label claims.
- 146. HPLC Chromatograph injectors • The function of the injector is to place the sample into the high-pressure flow in as narrow volume as possible so that the sample enters the column as a homogeneous, low-volume plug. To minimize spreading of the injected volume during transport to the column, the shortest possible length of tubing should be used from the injector to the column. • When an injection is started, an air actuator rotates the valve: solvent goes directly to the column; and the injector needle is connected to the syringe. The air pressure lifts the needle and the vial is moved into position beneath the needle. Then, the needle is lowered to the vial.
- 147. HPLC columns • The column is one of the most important components of the HPLC chromatograph because the separation of the sample components is achieved when those components pass through the column. The High performance liquid chromatography apparatus is made out of stainless steel tubes with a diameter of 3 to 5mm and a length ranging from 10 to 30cm. • Normally, columns are filled with silica gel because its particle shape, surface properties, and pore structure help to get a good separation. Silica is wetted by nearly every potential mobile phase, is inert to most compounds and has a high surface activity which can be modified easily with water and other agents. Silica can be used to separate a wide variety of chemical compounds, and its chromatographic behavior is generally predictable and reproducible.
- 148. Picture of an HPLC column
- 149. WHAT AFFECTS SYSTEM Column Parameters • Column Material • Deactivation • Stationary Phase • Coating Material Instrument Parameters • Temperature • Flow • Signal • Sample Sensitivity • Detector
- 150. WHAT AFFECTS SYSTEM Sample Parameters • Concentration • Matrix • Solvent Effect • Sample Effect
- 151. Several column types (can be classified as ) • Normal phase • Reverse phase • Size exclusion • Ion exchange
- 152. Normal phase • In this column type, the retention is governed by the interaction of the polar parts of the stationary phase and solute. For retention to occur in normal phase, the packing must be more polar than the mobile phase with respect to the sample
- 153. Reverse phase • In this column the packing material is relatively nonpolar and the solvent is polar with respect to the sample. Retention is the result of the interaction of the nonpolar components of the solutes and the nonpolar stationary phase. Typical stationary phases are nonpolar hydrocarbons, waxy liquids, or bonded hydrocarbons (such as C18, C8, etc.) and the solvents are polar aqueous-organic mixtures such as methanol-water or acetonitrile-water.
- 154. Size exclusion • In size exclusion the HPLC column is consisted of substances which have controlled pore sizes and is able to be filtered in an ordinarily phase according to its molecular size. Small molecules penetrate into the pores within the packing while larger molecules only partially penetrate the pores. The large molecules elute before the smaller molecules.
- 155. Ion exchange • In this column type the sample components are separated based upon attractive ionic forces between molecules carrying charged groups of opposite charge to those charges on the stationary phase. Separations are made between a polar mobile liquid, usually water containing salts or small amounts of alcohols, and a stationary phase containing either acidic or basic fixed sites.
- 156. Selectivity Factor • K’ values tell us where bands elute relative to the void volume. These values are unaffected by such variables as flow rate and column dimensions. The value tell us where two peaks elute relative to each other. This is referred to as the selectivity factor or separation factor (now and then as the chemistry factor).
- 157. Types of Liquid Column Chromatography (LCC) • LLC (Liquid Liquid) • LSC (Liquid Solid - adsorption) • SEC (Size Exclusion) • GLC GSC • SFC (Supercritical Fluid)
- 158. Types of Detectors • Absorbance (UV with Filters, UV with Monochromators) • IR Absorbance • Fluorescence • Refractive-Index • Evaporative Light Scattering Detector (ELSD) • Electrochemical • Mass-Spectrometric • Photo-Diode Array
- 159. EVALUATION PARAMETERS • EFFICIENCY • RESOLUTION • INERTNESS • RETENTION INDEX • COLUMN BLEED • CAPACITY FACTOR