SlideShare a Scribd company logo
1 of 22
Download to read offline
Journal of Communication ISSN 0021-9916
ORIGINAL ARTICLE
Parent and Child Media Exposure,
Preschooler Dietary Intake, and Preschooler
Healthy-Meal Schemas in the Context of
Food Insecurity
Kristen Harrison1, Mericarmen Peralta1, & STRONG Kids Team2
1 Department of Communication Studies and Research Center for Group Dynamics, Institute for Social
Research, University of Michigan, Ann Arbor, MI 48104, USA
2 Family Resiliency Center, University of Illinois, Urbana, IL 61801, USA
Media exposure is correlated with child obesity, yet the family behaviors underlying
this link remain poorly understood. Using data from a sample of U.S. parents and their
preschoolers, this study assessed parent and child exposure to 5 different media along
with child dietary intake. Child healthy-meal schemas were measured with the Placemat
Protocol, a novel play-based pretend meal assembly activity. Child and parent commercial
TV viewing predicted greater obesogenic dietary intake for children in food-secure but
not food-insecure households. Child commercial TV viewing also predicted a greater
proportion of energy-dense to total foods in children’s pretend healthy meals. Discussion
focuses on food insecurity as a potential moderator of marketing effects and calls for
continued research on child meal schema development.
Keywords: Parents, Television, Preschoolers, Healthy Meals, Schemas, Food Insecurity.
doi:10.1111/jcom.12153
Although the rate of child obesity in the United States has leveled out since 2003,
it remains high among preschoolers (Ogden, Carroll, Kit, & Flegal, 2014). Defining
overweight as a body weight at or above the 85th percentile of the peer population and
obesity as the portion at or above the 95th percentile, overweight and obesity together
increased from 5.0 to 13.9% among 2- to 5-year-olds from 1976 to 2004 (CDC, 2007).
In 2011–2012, more than 20% of U.S. 2- to 5-year-olds were overweight or obese
(Ogden et al., 2014), and overweight between ages 2 and 5 is a robust predictor of
adult obesity (McCarthy et al., 2007). The preschool years are a sensitive window of
development because the adiposity rebound (i.e., the point in life when a person’s
Corresponding author: Kristen Harrison; e-mail: krishar@umich.edu
Journal of Communication 65 (2015) 443–464 © 2015 International Communication Association 443
TV and Child Healthy-Meal Schemas K. Harrison et al.
weight at a given height hits its lowest point and begins to rise again) in children who
later become obese is roughly age 3, compared with age 6 among those who grow up
normal-weight (Rolland-Cachera, Deheeger, Maillot, & Bellisle, 2006).
Children’s social and family contexts constrain and influence their food choices
(Harrison et al., 2011). U.S. children spend $200 billion annually, mostly on food
products (Institute of Medicine, 2006). Children ages 2 to 14 influence an additional
$500 billion in family purchases (Institute of Medicine, 2006), over 75% of which
are grocery items (McNeal, 1998). Most TV advertisements targeting children sell
foods high in energy and low in vital macronutrients and micronutrients (Gantz,
Schwartz, Angelini, & Rideout, 2007; Harrison & Marske, 2005), and TV viewing
predicts poorer nutritional knowledge and reasoning among 6-year-olds (Harrison,
2005). These findings suggest that children become receptive to commercial media
information and misinformation about food and eating even before kindergarten.
Parents (Wethington & Johnson-Askew, 2009) and childcare providers (Kim &
Dev, 2011) are the primary gatekeepers of preschooler food intake, so adults exert
more control over preschoolers’ daily food intake than do preschoolers themselves.
However, between ages 3 and 5, children begin relating foods to health (Singleton,
Achterberg, & Shannon, 1992). By school age, their beliefs about food guide children’s
independent food choices and eating behaviors (Kandiah & Jones, 2002; Lakshman,
Sharp, Ong, & Forouhi, 2010). Children as young as 6 who have completed nutri-
tion education curricula display greater nutritional knowledge and more healthful
independent food intake (Baskale & Bahar, 2011) and food preferences (Kandiah
& Jones, 2002). As children’s independence over their dietary intake increases with
entry into formal schooling, it is important to gauge preschoolers’ food schemas to
understand what they think “healthy” meals are and how sociocultural factors such as
family commercial media exposure may influence these perceptions. Communication
researchers have a hand in the effort to understand and limit sociocultural influ-
ences on early childhood overweight and obesity because we specialize in analyzing
media and interpersonal messages and the influence of these messages on individu-
als’ and families’ beliefs and behaviors. The collection of factors that influence family
food buying behaviors and children’s energy intake and output is enormous (Harrison
et al., 2011) and beyond the scope of this article, but as research consistently points
to obesogenic food marketing as a key sociocultural factor, the relationship between
commercial media exposure and child weight remains a research priority.
Commercial TV and child obesogenic dietary intake
Research linking children’s exposure to media, especially TV, to an increased risk of
child overweight and obesity is now plentiful. Jordan and Robinson (2008) evaluated
evidence for four mechanisms—reduced resting metabolic rate, displaced physical
activity, obesogenic food purchasing in response to food marketing, and appetitive
priming in response to food marketing and portrayals—and concluded that the most
supported mechanisms were the latter two. Through food marketing in commercial
media, viewers are urged to buy foods that seem rewarding to eat. Once those foods
444 Journal of Communication 65 (2015) 443–464 © 2015 International Communication Association
K. Harrison et al. TV and Child Healthy-Meal Schemas
are in the pantry, the same marketing messages (and other environmental cues) may
prime cravings. Experimental research on appetitive priming (i.e., an externally cued
desire for food to satisfy hedonic hunger, not produced by a physical deficit in energy;
see Lowe & Butryn, 2007) revealed that children exposed to TV food advertising for
salty snacks ate more of a nonadvertised salty snack during exposure than children
exposed to advertisements for healthful foods or nonfood products (Harris, Bargh,
& Brownell, 2009). In recognition of the power of marketing, the biological effects of
food advertising on children’s ability to exert control over their eating have become a
pediatric research priority (Gearhardt & Brownell, 2013).
Before appetitive priming can lead to consumption, food must be purchased.
The chief theoretical process assumed in most research on food marketing’s effects is
social learning, specifically behavioral modeling urging audiences to buy on the basis
of anticipated gratification (Bandura, 2002). Exposure to advertising for obesogenic
foods is typically hypothesized to increase the likelihood of parents buying such foods
and of children urging their parents to buy them. Research supports this hypothesis
(Hingle & Kunkel, 2012) for both the chief purchasers (parents) and their children.
For example, Harrison and Liechty (2012) and Miller, Taveras, Rifas-Shiman, and
Gillman (2008) reported that preschoolers’ TV viewing predicted increased child
intake of obesogenic foods and reduced intake of fruits and vegetables, which receive
virtually no food advertising (Gantz et al., 2007).
Despite evidence for both modeling and priming, Hingle and Kunkel (2012)
argued that the mechanisms connecting family media exposure to obesogenic food
consumption remain unclear, in part because the dynamics of requesting, demand-
ing, buying, bargaining, instructing, compromising, sneaking, hoarding, stealing,
and otherwise engaging with food are rarely observed in vivo by researchers. To the
extent that children are learning about food from family negotiations and exchanges
of information, and to the extent that commercial media have some role in this
process, an empirical connection should exist between child commercial media
exposure, child dietary intake, and children’s perceptions of healthy foods and meals.
However, parent media exposure likely matters as well. Preschoolers are not as skilled
as older children at remembering food brands and asking for them by name (Oates,
Blades, & Gunter, 2002), so the power of TV advertising to influence parent buying
through young children is limited. Although most studies on the media-obesity link
have only measured child media exposure (Jordan & Robinson, 2008), it is helpful
to measure both parent and child media exposure, especially since the TV viewing
habits (Barradas, Fulton, Blanck, & Huhman, 2007) and dietary habits (Sonneville
et al., 2012) of parents and children are correlated.
Food insecurity as contextual variable
A household variable of central interest in this article is food insecurity, which influ-
ences the quantity and types of foods parents buy. Food insecurity exists when nutri-
tious and safe foods are limited or when the ability to acquire them in socially accept-
able ways is limited or uncertain, with more severe forms resulting in persistent child
Journal of Communication 65 (2015) 443–464 © 2015 International Communication Association 445
TV and Child Healthy-Meal Schemas K. Harrison et al.
hunger (Bickel, Nord, Price, Hamilton, & Cook, 2000). Food insecurity is associ-
ated with increased overweight and obesity among adults, but the link is inconsistent
among children (Dinour, Bergen, & Yeh, 2007). Most food-insecure families have
limited incomes; according to the United States Department of Agriculture (USDA),
those with gross monthly incomes at or below 130% of the U.S. poverty guideline
($2,498 for a family of four in 2013) qualify for the Supplemental Nutrition Assistance
Program (SNAP), formerly the Food Stamp Program (USDA, 2013a). Families who
do not qualify for SNAP may also be food-insecure if the family budget is perceived
to be inadequate to cover the family’s dietary needs.
With respect to their receptivity to food marketing, food-secure and food-insecure
parents may both be influenced by obesogenic food marketing, but in different ways.
Food-secure families are likely to be influenced in the traditional, research-supported
way: Greater exposure should be associated with greater consumption based on the
theoretical mechanisms (modeling and priming) described earlier in this article.
When family resources are perceived to be plentiful enough that there is no threat of
starvation, food advertising should have more potential to lead to buying with fewer
budgetary disincentives. Thus, for food-secure parents, we hypothesized that both
parent and child exposure to commercial TV would predict (H1a) increased child
intake of obesogenic foods and (H1b) decreased child intake of nonobesogenic foods
(fruits and vegetables).
Following this reasoning, it seems that anxiety over resources would limit effects
of food advertising for food-insecure parents because there is little perceived “wig-
gle room” in the family budget to satisfy advertising-cued hedonic hunger without
threatening the goal of meeting the family’s nutritional needs on a limited income. In
spite of this, food-insecure families may remain susceptible to the persuasive effects
of food marketing and may even be uniquely susceptible during vulnerable times
of their income cycle. Dinour et al. (2007) proposed a conceptual framework link-
ing the monthly food-stamp cycle to a feast-famine pattern based on evidence that
episodic food insecurity can lead to binge eating when food is plentiful, typically when
the monthly allowance is received (Towensend, Peerson, Love, Achterberg, & Mur-
phy, 2001). As this allowance is fixed, feasting early in the month increases the risk
of famine later. The experience of hunger predisposes the family to feast again the
next month, repeating the cycle. Even food-insecure families that do not participate
in the SNAP program may experience this cycle, leading to greater attraction to and
consumption of energy-dense foods (Harris et al., 2009) and rendering food advertis-
ing particularly potent during the famine period. Given these competing rationales,
we asked whether parent and child exposure to commercial TV would be related to
child obesogenic dietary intake (RQ1a) and nonobesogenic dietary intake (RQ1b) for
food-insecure families.
It is unclear whether there is any reason to expect the relationship between
commercial TV exposure and dietary intake to be stronger for food-secure than
food-insecure families or vice versa. Given the lack of published research on food
insecurity as a moderator in the media-obesity relationship, we asked (RQ2) whether
446 Journal of Communication 65 (2015) 443–464 © 2015 International Communication Association
K. Harrison et al. TV and Child Healthy-Meal Schemas
food insecurity would moderate the relationship between child and parent commer-
cial TV exposure and child obesogenic and nonobesogenic food intake, as evidenced
by significantly different relationships for food-secure and food-insecure families.
Commercial TV and child healthy-meal schemas
To parallel our hypotheses for child dietary intake, we also hypothesized that (H2)
commercial TV viewing would predict child healthy-meal schemas emphasiz-
ing more obesogenic (energy-dense) foods. Researchers have attempted to map
food-schema development in children as young as 3 (Holub & Musher-Eizenman,
2010; Nguyen, 2007; Nguyen, Gordon, & McCullough, 2011). Defining healthy food
schemas as evaluative categories that include items sharing the same value-laden
assessment (e.g., “healthy” vs. “junky”) and operationalizing correct classification
of foods such as apples as “healthy” and cookies as “junky,” these investigators have
documented emerging nutrition knowledge among preschoolers. This knowledge is
just better than chance (59%) at age 3 and improves to almost 80% by age 7 (Nguyen,
2007). Holub and Musher-Eizenman (2010) asked 69 3- to 6-year-olds to assemble
pretend meals of four foods and one drink using photographs of 21 different foods
and drinks. Within these constraints, children’s “healthy” meals featured less esti-
mated fat and calories than their unhealthy meals, although few children were able
to explain their choices verbally in nutritional terms.
These foundational studies indicate that evaluative schematic cognitions about
“healthy” foods and meals begin developing during the preschool years and are
likely influenced along with family buying and consumption behaviors by sociocul-
tural agents such as media food marketing. To update the verbal and photographic
schema-assessment methods of past research, we opted to measure child healthy-meal
schemas with a pretend-play procedure (Harrison & Peralta, 2013) involving real-
istic three-dimensional food replicas. The schematic construct of interest in this
study paralleled the “healthy” versus “junky” distinction identified by Nguyen and
colleagues (Nguyen, 2007; Nguyen et al., 2011), since a food’s apparent identity as a
health food or a junk food is a concrete, tangible indicator of food/nutritional quality
from a young child’s perceptually dependent perspective. Half of the food models in
the task were energy-dense (“junky”) and half were nutrient-dense (“healthy”), so
we defined “healthiness” as a lower proportion of energy-dense to total food items in
pretend meals. There was no reason to expect food insecurity to play a moderating
role for children’s meal schemas.
Method
Participants
This study was approved by the University of Michigan Health Sciences and Behav-
ioral Sciences IRB prior to recruitment and data collection. Recruitment was based
on a sample with unequal probability of selection among licensed preschools in a
three-county area in Michigan that (a) were registered with the state Bureau of Chil-
dren and Adult Licensing, a condition for receiving federal food assistance, (b) were
Journal of Communication 65 (2015) 443–464 © 2015 International Communication Association 447
TV and Child Healthy-Meal Schemas K. Harrison et al.
located within 50 miles of the study center in one of nine urban or rural areas selected
to maximize racial and economic diversity, and (c) enrolled a minimum of 10 chil-
dren in the targeted age range. These criteria identified 25 eligible preschools, 18 of
which agreed to participate (response rate = 72%). Parents of all 4- to 6-year-old chil-
dren at each preschool were invited to complete a questionnaire for $50.00 and asked
to provide permission for their children to be interviewed. Parents of more than one
eligible child were asked to choose the oldest. Participants were 278 parents (93%
female) reporting on their children. In addition, biometric (body mass) and meal
schema data were obtained via direct interaction with 247 of participating parents’
children (50% female). Child age based on school-reported birthdates ranged from
40 to 76 months (M = 56.3, SD = 5.3), with 97% (232) between 48 and 72 months.
All analyses involving data collected directly from children were restricted to the 247
complete parent–child pairs. All analyses involving data supplied exclusively by par-
ents utilized the whole parent sample of 278.
According to parent reports, 29% (68) of children were non-Hispanic Black,
59% (145) were non-Hispanic White, 7% (17) were Asian, 4% (11) were Hispanic,
and 2% (6) were Native American Indian. In analyses, race/ethnicity was coded as
Black versus non-Black due to higher obesity rates and greater TV viewing among
African Americans than Anglo Americans (Crespo et al., 2001). About 38% (89) of
parents were unmarried and 37% (87) reported receiving WIC assistance;1 26% (62)
had enrolled their children in Head Start. For parent body mass index (BMI, a ratio
representing weight for height), parents reported their height in feet and inches or
centimeters and their weight in pounds or kilograms. Nonmetric responses were
converted to metric and parent BMI was calculated by dividing weight in kg by
height in cm squared. Education was measured by having parents check one of seven
categories ranging from no formal education to postgraduate work; 46.5% (114)
had obtained less than a 4-year college degree. Parents indicated monthly household
income by checking 1 of 14 categories from 0 to >$6000; the median category was
$2501–$3000 ($30,012–$36,000 annually). About 42% of the sample reported an
annual income at or below the U.S. poverty threshold of $23,550 for a family of four
in 2013 (United States Department of Health and Human Services, 2013).
Procedure and measures
Parents
Parents completed questionnaires online or on paper. The demographic variables
described above were measured for use as controls because they are related to media
use (Roberts & Foehr, 2004). Parent media exposure variables included estimated
weekly personal exposure to commercial TV, digitally recorded (DVR’d) TV with
commercials skipped over, DVDs/VHS tapes, video games, websites, and books. To
distinguish commercial TV from DVR’d TV, commercial TV exposure was measured
first with the item “About how many minutes or hours do you usually watch television
with commercials (not digitally recorded television)?” DVR’d TV exposure was then
measured with the item “DVR (digitally recorded TV without commercials): About
448 Journal of Communication 65 (2015) 443–464 © 2015 International Communication Association
K. Harrison et al. TV and Child Healthy-Meal Schemas
how many minutes or hours do you usually watch?” Similar items were used for video
games, websites, and books. Parents reported the estimated minutes/hours they used
each medium during separate dayparts on a typical weekday (in the morning, while
their child is at preschool, after their child comes home from preschool, and after
dinner) and a typical weekend day (in the morning, after lunch, and after dinner;
see Harrison & Liechty, 2012). Response options included 0 minutes, 15 minutes, 30
minutes, 1 hour, 2 hours, 3 hours, 4 hours, and 5+ hours. Hours were converted to
minutes and scores for dayparts were added, with the weekday total multiplied by 5
added to the weekend day total multiplied by 2, yielding a weekly exposure score in
minutes for each medium. These scores were divided by 60 to yield weekly exposure
in hours. To assess child media exposure, the same set of questions and calculations
were repeated for “your child.” Parents completed their child’s media exposure items
after they had completed their own.
Child dietary intake was estimated with parental reports of children’s consump-
tion of seven foods (fruits, vegetables, sugared beverages, French fries, fast food,
candy/sweets, and salty snacks) using items from the United States Department of
Education’s Early Childhood Longitudinal Study, Birth Cohort (ECLS-B) interview
protocol for 2-year-olds (United States Department of Education, 2008). The protocol
began: “The next questions ask about food your child ate or drank during the past
7 days. Think about all the meals and snacks your child had from the time he/she
got up until he/she went to bed. Be sure to include food your child ate at home,
preschool, restaurants, play dates, anywhere else, and over the weekend.” Response
options included 0 = my child did not eat/drink any _____ during the past 7 days,
1 = once a day, 2 = twice a day, 3 = three times a day, 4 = four or more times a day,
5 = one to three times during the past 7 days, 6 = four to six times during the past 7
days, and 7 = don’t know. Responses 5 and 6 were recoded as fractions representing
average times per day (i.e., one to three times/week = 0.2857 times/day and four to six
times/week = 0.7143 times/day). Responses of 7 (don’t know) were treated as missing
data. Each individual item began “How many times did your child eat (drink)_____”
and named the food in question. An index of obesogenic dietary intake was created
by adding scores for sugared beverages, French fries, fast food, candy/sweets, and
salty snacks; a complementary index of nonobesogenic dietary intake was created by
adding scores for fruits and vegetables.
Food insecurity was measured with the Stage 1 Screen from the USDA Guide to
Measuring Household Food Security (Bickel et al., 2000). These items measure parental
perceptions about adequate finances and adequate meal quality given financial con-
straints. The five items are “I worried whether our food would run out before we got
money to buy more”; “The food that we bought just didn’t last, and we didn’t have
money to get more”; “We couldn’t afford to eat balanced meals”; “We relied on only a
few kinds of low-cost food to feed the children because we were running out of money
to buy food”; and “We couldn’t feed the children a balanced meal because we couldn’t
afford that.” Response options ranged from 0 (never true in the last 12 months) to 4
(often true in the last 12 months). Internal consistency for the five items was α = .88.
Journal of Communication 65 (2015) 443–464 © 2015 International Communication Association 449
TV and Child Healthy-Meal Schemas K. Harrison et al.
About half (155 or 52%) of our parent sample answered “never true” for all five items
and were coded “food secure”; the other half (141, or 48%) expressed at least some
food insecurity and were coded “food insecure.”
Children
Children were interviewed in person at their preschools by trained research assistants.
Healthy-meal schemas were assessed with the Placemat Protocol (Harrison & Peralta,
2013; see Figure 1). The Placemat is a 4′
× 5′
laminated mat with two copies each of 36
highly realistic food replicas in child-sized portions, arranged in categories (vegeta-
bles, fruits, grains, dairy, meat and other proteins, and beverages) consistent with the
USDA MyPlate initiative (USDA, 2012). Half of the items in each category are lower
in calories and higher in micronutrients (nutrient-dense) and half are higher in calo-
ries and lower in micronutrients (energy-dense). Replicas represented the unbranded
food items consumed most frequently nationwide by U.S. preschoolers (Skinner et al.,
1998).2
Each child was asked, “Are you hungry right now?” Response options included
no, a little, or a lot. The researcher then seated the child on the mat in front of a 10’’
white plate, named the foods on the mat, and helped the child assemble the first
meal (preferred foods). Children were told, “We’re going to make a pretend meal
together, using the foods and drinks here. You can put a little food on the plate or
a lot, but don’t put any more than you think you could eat at one time. Let’s start
by making a meal of your FAVORITE foods. If you could pick any of these foods
and drinks— the ones you like best—which would you pick?” When the child was
finished, the plate was cleared and the procedure was repeated for the healthy meal:
“Now we’re going to make a HEALTHY meal. I want you to pick foods and drinks
you think are healthy.” The researcher avoided defining “healthy” to gauge children’s
schemas without priming specific schematic content. To the 42 children who spon-
taneously asked what “healthy” means, the researcher offered the prompt “good for
your body.” All children constructed the preferred meal followed by the healthy
meal, consistent with the preferred-before-healthy procedure used by Holub and
Musher-Eizenman (2010). Energy-dense and nutrient-dense items were counted on
each plate, and the proportion of energy-dense to total food items was calculated for
each meal.
Approximately 1–2 weeks after completing the Placemat Protocol, child height
and weight were measured twice with a portable digital scale and stadiometer
following Centers for Disease Control & Prevention (CDC) standardized pro-
tocol (CDC, 2010). The weight measures correlated at r = .999 and the height
measures at r = .998. BMI percentile was tabulated using the CDC’s BMI Tool for
Schools program (National Center for Health Statistics, 2000a, 2000b). About 3%
of the child sample were in the underweight range (<5th percentile), 73% were
in the normal range (5th to 85th percentile), 23% were in the overweight/obese
range (≥85th percentile), and 9% were in the exclusively obese range (≥95th
percentile).
450 Journal of Communication 65 (2015) 443–464 © 2015 International Communication Association
K. Harrison et al. TV and Child Healthy-Meal Schemas
Figure 1 A 6-year-old girl using Placemat Protocol to complete preferred (top) and healthy
(bottom) pretend meals.
Results
Descriptive statistics
Means, standard deviations, and zero-order correlations for key variables are dis-
played separately for parent (Table 1) and child (Table 2) media exposure variables.
Because parent BMI, parent education, parent and child race/ethnicity, and household
Journal of Communication 65 (2015) 443–464 © 2015 International Communication Association 451
TV and Child Healthy-Meal Schemas K. Harrison et al.
income were correlated with media exposure and dietary intake, they were entered as
controls in analyses.
Hypotheses and research questions
Parent and child media exposure were positively correlated, from r = .23 for website
hours to r = .72 for commercial TV hours. Parents reported media exposure for both
themselves and their children, so these correlations could be inflated by measurement
or could be legitimately high given probable overlap in parent–child viewing in daily
family life. In spite of this overlap, child media predictors were not controlled when
testing parent media predictors and vice versa because our goal was not to test the
predictive power of independent parent and child media use but the gross estimated
media diet of each, including overlapping exposure. Given the potential for inflated
media exposure correlations due to measurement, any differences observed for parent
versus child media exposure should be interpreted with caution.
Hypothesis 1a–b
We predicted that for food-secure parents, both parent and child commercial TV
exposure would predict increased child intake of obesogenic foods (H1a) and
decreased child intake of nonobesogenic foods (H1b). Multiple regression analyses
with all media variables entered along with key demographic controls (see Table 3)
demonstrated clear support for H1a. Both parent and child commercial TV exposure
predicted increased child intake of obesogenic foods in food-secure families. H1b, in
contrast, was supported only for child commercial TV exposure. Parent commercial
TV exposure did not significantly predict decreased fruit and vegetable intake.
Research question 1a–b
These research questions asked whether the relationships between commercial TV
viewing and dietary intake predicted for food-secure families would be observed for
food-insecure families. The answer was no on both counts. As shown in Table 4, there
were no significant relationships between any of the media variables and child dietary
intake for the food-insecure families.
Research question 2
To answer the question of whether the relationships between commercial TV viewing
and child dietary intake differed significantly for food-secure and food-insecure fam-
ilies (RQ2), we conducted multiple regression analyses similar to those above but with
the entire sample and an additional step featuring the interaction between commer-
cial TV viewing and food insecurity. Parent (β = −.16, ΔR2
= .02, p < .05) and child
(β = −.22, ΔR2
= .04, p < .01) commercial TV exposure both interacted significantly
with food insecurity in predicting child obesogenic dietary intake. The slopes reported
for commercial TV and obesogenic dietary intake in Table 3 (food-secure families)
were therefore significantly stronger than their counterparts in Table 4 (food-insecure
families). The analogous analyses for nonobesogenic dietary intake did not produce
452 Journal of Communication 65 (2015) 443–464 © 2015 International Communication Association
K. Harrison et al. TV and Child Healthy-Meal Schemas
Table1Means,StandardDeviations,andIntercorrelationsforFamilyVariablesandParentMediaVariables(ParentN=296,ChildN=247)
Measure12345678910111213141516
M27.880.264.527.9759.922.233.2114.796.505.641.429.748.250.620.390.48
SD7.680.441.174.8128.502.081.6914.809.2810.423.9611.3910.510.220.250.50
1.ParentBMI.25−.22−.37.20.05.00.30.10.22.01.10.21.02.16.26
2.Parentrace/ethnicity−.43−.53.01.22.05.37.09.31.30.07.26−.15.25.18
3.Parenteducation.67−.20−.28.02−.38−.16−.31−.32.09−.12.05−.30−.35
4.Householdincome−.23−.22.08−.36−.03−.32−.21−.06−.32.02−.23−.46
5.ChildBMIpercentile.12.04.12.08.08.13.05.04.13.04.15
6.Childobesogenicdietaryintake.02.24.08.28.20.16.01.01.08−.02
7.Childfruit/vegetableintake−.08.00.02−.01−.05.05.03−.02−.10
8.ParentcommercialTVexposure.31.36.28.23.15−.07.17.04
9.ParentDVR’dTVexposure.14.11.11.05−.02.14−.08
10.ParentDVD/VHSexposure.17.28.25−.08.12.08
11.Parentvideogameexposure−.02.00−.06.04.00
12.Parentwebsiteexposure.10−.01−.06−.05
13.Parentbookexposure.08.06.25
14.Proportionenergy-densefoods,
childpreferredmeal
−.02−.00
15.Proportionenergy-densefoods,
childhealthymeal
.18
16.Foodinsecurity
Note:Parentrace/ethnicitycodedBlack=1,non-Black=0.Foodinsecuritycodedinsecure=1,secure=0.Meansfordietaryintakeindicatenumber
oftimesconsumedperday.Coefficientssignificantatp<.05arenotedinbold.
Journal of Communication 65 (2015) 443–464 © 2015 International Communication Association 453
TV and Child Healthy-Meal Schemas K. Harrison et al.
Table2Means,StandardDeviations,andIntercorrelationsforFamilyVariablesandChildMediaVariables(ParentN=296,ChildN=247)
Measure12345678910111213141516
M27.880.294.527.9759.922.233.2110.884.204.982.481.377.940.620.390.48
SD7.680.461.174.8128.502.081.6912.157.107.605.303.717.220.220.250.50
1.ParentBMI.29−.22−.37.20.05.00.24.07.21.10.03.10.02.16.26
2.Childrace/ethnicity−.42−.52.01.23.02.40.09.24.14.12.28−.11.25.18
3.Parenteducation.67−.20−.28.02−.40−.12−.30−.20−.19−.20.05−.30−.35
4.Householdincome−.23−.22.08−.38.05−.25−.17−.16−.31.02−.23−.46
5.ChildBMIpercentile.12.04.14.02.22.17.08.06.13.04.15
6.Childobesogenicdietaryintake.02.34.15.26.32.20.11.01.08−.02
7.Childfruit/vegetableintake−.18−.03−.05−.16−.12.18.03−.02−.10
8.ChildcommercialTVexposure.19.41.43.36.17−.06.23.05
9.ChildDVRedTVexposure.34.17.35.06−.01.06.00
10.ChildDVD/VHSexposure.29.42.14.06.07.09
11.Childvideogameexposure.49.21.05−.04−.09
12.Childwebsiteexposure.30.09.03.05
13.Childbookexposure.07.05.11
14.Proportionenergy-dense
foods,childpreferredmeal
−.02−.00
15.Proportionenergy-dense
foods,childhealthymeal
.18
16.Foodinsecurity
Note:Childrace/ethnicitycodedBlack=1,non-Black=0.Foodinsecuritycodedinsecure=1,secure=0.Meansfordietaryintakeindicatenumber
oftimesconsumedperday.Coefficientssignificantatp<.05arenotedinbold.
454 Journal of Communication 65 (2015) 443–464 © 2015 International Communication Association
K. Harrison et al. TV and Child Healthy-Meal Schemas
Table 3 Multiple Regression Analyses Predicting Child Obesogenic (OB) and
Nonobesogenic (Non-OB) Dietary Intake as Reported by Parents, for Food-Secure Families
With Parent Media Predictors With Child Media Predictors
OB Non-OB OB Non-OB
Predictor β β β β
Parent BMI −.02 −.04 −.00 .00
Race/ethnicity .21* .29* .35** .16
Parent education .00 .12 .04 .10
Household income .07 .07 .07 .02
Child BMI percentile .03 .01 .08 .06
Commercial TV .43*** −.17 .37*** −.30*
DVR’d noncommercial TV .05 .06 .18* .06
DVD/VHS −.16 −.09 −.21** −.07
Video games .15 .04 .14 −.11
Websites −.17 −.10 .10 .01
Books .01 .27* −.02 .33**
Total R2 .32*** .14 .49 ∗∗∗ .19 ∗
n 114 114 117 117
Note: Analyses using parent media predictors used parent race/ethnicity, and analyses using
child media predictors used child race/ethnicity; other predictor variables are identical across
analyses. Race/ethnicity coded Black = 1, non-Black = 0.
*p < .05.
**
p < .01.
***p < .001.
significant interaction coefficients for either parent commercial TV viewing (β = .08)
or child commercial TV viewing (β = .03). Thus the slopes reported for commercial
TV and nonobesogenic dietary intake in Table 3 (food-secure families) were not sig-
nificantly different from their counterparts in Table 4 (food-insecure families).
Hypothesis 2
This hypothesis predicted that child and parent commercial TV viewing would
predict a greater proportion of energy-dense to total foods in children’s pretend
healthy meals. The multiple regression analyses testing this hypothesis featured the
same demographic variables as the analyses for dietary intake, plus four additional
controls: family food insecurity, child obesogenic dietary intake, child nonobesogenic
dietary intake, and the proportion of energy-dense to total foods in children’s pretend
preferred meals. This controlled the potential influence of family food insecurity and
children’s daily eating habits and preferences on the composition of their pretend
healthy meals. As summarized in Table 5, H2 was supported for child commercial
TV viewing only. More child commercial TV viewing predicted a higher proportion
of energy-dense to total foods in children’s pretend healthy meals. There was no
relationship for parent commercial TV viewing, although the coefficient was positive.
Journal of Communication 65 (2015) 443–464 © 2015 International Communication Association 455
TV and Child Healthy-Meal Schemas K. Harrison et al.
Table 4 Multiple Regression Analyses Predicting Child Obesogenic (OB) and
Nonobesogenic (Non-OB) Dietary Intake as Reported by Parents, for Food-Insecure Families
With Parent Media Predictors With Child Media Predictors
OB Non-OB OB Non-OB
Predictor β β β β
Parent BMI −.05 .08 −.05 .15
Race/ethnicity −.08 −.05 .00 −.04
Parent education −.15 −.15 −.17 −.17
Household income −.03 .10 −.05 .03
Child BMI percentile .02 .11 .02 .13
Commercial TV −.09 −.01 −.10 −.12
DVR’d noncommercial TV −.02 −.05 −.03 .04
DVD/VHS .21 −.02 −.03 −.23
Video games .11 −.06 .23 −.13
Websites .14 .05 .07 .28
Books −.06 .04 −.02 .02
Total R2 .13 .04 .10 .13
n 86 85 85 84
Note: Analyses using parent media predictors used parent race/ethnicity, and analyses using
child media predictors used child race/ethnicity; other predictor variables are identical across
analyses. Race/ethnicity coded Black = 1, non-Black = 0.
Discussion
Both child and parent commercial TV exposure predicted increased child intake of
obesogenic foods such as sugared beverages, French fries, fast food, candy/sweets,
and salty snacks, but only for food-secure families. This finding is consistent with
the argument that food insecurity constrains the influence of external factors such
as food advertising by imposing limits on families’ ability to satisfy hedonic hunger
with gratuitous food expenditures. Although people who receive supplemental nutri-
tional assistance may spend their allotment on obesogenic fast foods and snack foods
(USDA, 2013b) as well as fruits and vegetables, the overall dollar limit on the allot-
ment (as well as limits on the monthly budgets of lower-income families who do not
receive assistance) places a natural cap on food spending overall and demands care-
ful planning regarding grocery expenditures. Food-insecure families, whose periodic
hunger may render them equally if not more vulnerable than food-secure families to
marketing-induced appetitive priming, are generally less able than food-secure fam-
ilies to fulfill their cravings with spontaneous shopping or food expenditures beyond
those planned for any given pay period.
It is interesting that food insecurity operated in this manner given that income
was controlled in the regression analyses. Regardless of income, it seems that the emo-
tional state of food insecurity, which appears based on the screening items to be an
456 Journal of Communication 65 (2015) 443–464 © 2015 International Communication Association
K. Harrison et al. TV and Child Healthy-Meal Schemas
Table 5 Multiple Regression Analyses Predicting Proportion of Energy-Dense to Total
Foods in Children’s Pretend Healthy Meals
With Parent Media Predictors With Child Media Predictors
Predictor β β
Parent BMI .06 .07
Race/ethnicity .20* .12
Parent education −.09 −.12
Household income .06 .05
Child BMI percentile −.04 −.02
Food insecurity .18* .10
Dietary intake (OB) −.09 −.02
Dietary intake (fruit/veg) −.06 −.04
ED foods, preferred meal −.00 .01
Commercial TV .09 .21*
DVR’d noncommercial TV .09 .08
DVD/VHS .04 −.02
Video games −.09 −.17
Websites −.13 .01
Books −.07 −.04
Total R2
.15* .14*
n 195 197
Note: Analysis using parent media predictors used parent race/ethnicity, and analysis
using child media predictors used child race/ethnicity; other predictor variables are iden-
tical across analyses. Race/ethnicity coded Black = 1, non-Black = 0. Food insecurity coded
0 = food-secure, 1 = food-insecure.
*p < .05.
amalgam of worry and powerlessness, may be the driving factor behind its moder-
ating role. The fact that commercial TV viewing and obesogenic dietary intake were
correlated for food-secure but not food-insecure families raises the possibility that
food-related modeling and priming processes are realized as action primarily among
those who feel they can afford to take such action. Our findings also raise the possi-
bility that food insecurity may temporarily protect children in food-insecure homes
from marketing effects on excess dietary intake, even when appetitive priming occurs.
Children cannot eat what their parents cannot buy. Food insecurity is exceptionally
stressful (Bickel et al., 2000) so it would be unwise to argue that it is advantageous; still,
the constraints it imposes on food purchasing may provide children limited protection
against obesity during the preschool years.
Findings for child fruit and vegetable intake were less consistent, with support
for the predicted negative correlation emerging for child commercial TV viewing
in food-secure families only. Perhaps persuasive marketing and media-induced
appetitive priming processes occur primarily for obesogenic food, which is heavily
Journal of Communication 65 (2015) 443–464 © 2015 International Communication Association 457
TV and Child Healthy-Meal Schemas K. Harrison et al.
advertised, and not fruits and vegetables, which are not (Gantz et al., 2007) and for
which purchase and consumption are more strongly influenced by other factors.
The fact that child commercial TV viewing predicted a more energy-dense pretend
healthy meal for all children regardless of family food insecurity raises the possibility
that family spending limits do not constrain the effects of direct exposure to market-
ing on children’s developing meal schemas. Food-insecure children’s perceptions of
healthy meals as containing more energy-dense foods could influence their indepen-
dent food choices when and if the economic constraints of food insecurity are lifted
(Baskale & Bahar, 2011; Kandiah & Jones, 2002). If these children continue to develop
in a state of food insecurity, qualifying for reduced-price school lunches increases the
likelihood that they will eat school lunch as opposed to a home-packed lunch. Panel
research has linked children’s consumption of school lunches with increased over-
weight and obesity over time (Schanzenbach, 2009; but see Kimbro & Rigby, 2010,
for the contextual influence of local factors such as food pricing). Children who enter
school with the perception that energy-dense foods play a prominent role in healthy
meals may end up selecting more of these foods when given the option in the school
lunch line. These possibilities are beyond verification with the current data set, but
they merit investigation in longitudinal research. At this point our interpretation of
the mechanisms by which food insecurity moderates the potential effects of house-
hold commercial TV exposure on child dietary intake is speculative. At the very least,
our data indicate that it would be wise to continue distinguishing food-secure from
food-insecure families when exploring the mechanisms by which food marketing
influences child dietary intake in the home.
The purpose of including other media variables in this study was to compare a
marketing-saturated medium (commercial TV) with media featuring little or no food
marketing. The failure of most of the other media variables to predict child dietary
intake and healthy-meal schemas may be due to the lack of food advertising in those
media or to the possibility that relatively low exposure scores for the non-TV screen
media (see Tables 1 & 2) reduced variance. Parent and child TV viewing are typi-
cally correlated because children and parents often watch together (Barradas et al.,
2007), but the low correlations (r = .19 for children and r = .31 for parents) between
commercial TV and DVR’d TV suggest that some households in our sample watched
mostly commercial TV whereas others watched mostly DVR’d TV. Commercial TV
households may differ from other households on a number of factors linking media
use and obesogenic food consumption through various leisure-time preferences. The
positive correlations for child and parent book-reading and child fruit and vegetable
intake in food-secure households are consistent with this possibility. What makes
one household a book-reading, fruit-and-vegetable-eating dominion and another
a commercial-TV-viewing, fast-food-eating dominion? Identifying how media and
dietary variables cluster together should be a central goal of future research.
Although this study reported some compelling findings, it has some important
limitations. First, parent reports of media exposure and dietary intake are more sus-
ceptible to error than observational data, so supplemental research involving in-home
458 Journal of Communication 65 (2015) 443–464 © 2015 International Communication Association
K. Harrison et al. TV and Child Healthy-Meal Schemas
observation of family media and dietary habits seems necessary. The magnitude of
the observed relationships was also relatively modest, and the survey design precludes
conclusions about causality. Certainly, commercial media exposure is but one of many
factors influencing families’ food-buying decisions and cannot be expected to account
for a large portion of the variance in family dietary intake. At the same time, even a
small influence is important because TV habits are much more easily changed than
factors such as family income or the community retail food environment.
Just as nutrient-dense foods are not void of energy, energy-dense foods are not
void of nutrients; therefore the distinction between energy-dense and nutrient-dense
foods for the meal schema task was somewhat arbitrary, as a diet high in energy-dense
foods can be quite nutritious. However, in terms of nutritional “bang for the buck,”
we maintain that low-to-moderate-energy, micronutrient-dense foods such as
whole-grain spaghetti, carrots, grapes, and milk are preferable to energy-dense,
low-to-moderate-micronutrient foods such a doughnuts, potato salad, Jello, and
fruit punch. This is because more vital macronutrients and micronutrients can be
delivered by the first set of foods without excessive energy. Also, independent of
energy intake, adequate intake of micronutrients delays degenerative aging and is
more healthful than inadequate intake (Ames, 2006).
The Placemat Protocol yields representations of meals as children imagine them
but does not offer information on what children consume. The average pretend
healthy meal for our child sample featured about eight items. Research on children’s
food plating preferences points to an average of seven different items and six different
colors (compared to three items and three colors for adults; Zampollo, Kniffin,
Wansink, & Shimuzu, 2011), so a childhood fondness for variety has been empirically
documented and is not unique to our sample. Food placed on a plate is not necessarily
food eaten, but increased variety and larger portion sizes both encourage greater
intake among children and adults (Wansink, 2006). If larger pretend meals predict
the composition of larger real meals, then children who view more commercial TV
may not only compose more energy-dense meals even when trying to eat healthily,
but end up consuming more calories too.
Lastly, just as adults do not always eat what they believe is healthiest, children’s
perceptions of healthy eating will not necessarily guide their food choices. However,
as nutritional curricula have led to more healthful independent food choices in chil-
dren as young as 6 (Baskale & Bahar, 2011; Kandiah & Jones, 2002), interventions
aimed at altering children’s healthy-meal schemas to include more accurate percep-
tions of healthy eating should increase the frequency with which children choose
nutrient-dense foods over energy-dense foods when they begin making dietary deci-
sions outside the scope of parental supervision.
This project did not involve collecting healthy-meal schema data for parents, so
the correspondence between parents’ and children’s schemas is unknown. Likewise,
without data recording foods available in the home, we are unable to document
whether parent commercial TV exposure was directly correlated with family food
Journal of Communication 65 (2015) 443–464 © 2015 International Communication Association 459
TV and Child Healthy-Meal Schemas K. Harrison et al.
buying behavior. Whatever the case, the relationships between family media expo-
sure, family dietary habits, and parent–child discussions about food and health are
undoubtedly complex and vary enormously within and between food-secure and
food-insecure families. The data summarized here underscore the importance of
measuring food insecurity in future attempts to map media and marketing effects on
early childhood obesity and overweight, along with the need for more observational
research to document these dynamics and their contributions to children’s developing
meal schemas in the early-life context of the family home. A better understanding
of how the processes of media-produced modeling and appetitive priming function
within specific family constraints, financial or otherwise, will be necessary to produce
feasible, realistic, and individually tailored strategies to help families meet their chil-
dren’s nutritional needs while educating children to make the most healthful dietary
choices possible when they begin assembling real meals on their own.
Acknowledgments
The STRONG Kids Team is a transdisciplinary collaborative at the University of
Illinois including founding members Kelly K. Bost, Brent A. McBride, Sharon M.
Donovan, Diana S. Grigsby-Toussaint, Janet M. Liechty, Angela Wiley, Margarita
Teran-Garcia, and Barbara Fiese. The development of the Placemat Protocol was
funded by the Illinois Council for Food and Agriculture Research, the Illinois
Department of Human Services, and the USDA. Thanks to Sarah Brennan, Jennifer
Lynne Buechel, Evan Carpenter, Rachel Hamden, Ana Hauser, Jessica Kaltz, Dugan
Kemple, Jane Kim, Julia Lipowski, Jennifer Park, Elisse Rodriguez, Anna Spigelman,
Nicole Tung, and Hannah Weiner for data collection.
Notes
1 WIC refers to the U.S. Department of Agriculture’s Special Supplemental Nutrition
Program for Women, Infants, and Children. The program provides funding for
“supplemental foods, health care referrals, and nutrition education for low-income
pregnant, breastfeeding, and nonbreastfeeding postpartum women, and to infants and
children up to age five who are found to be at nutritional risk.”
(http://www.fns.usda.gov/wic/women-infants-and-children-wic)
2 The vegetable food models included peas, carrots, and green beans (nutrient-dense) and
French fries, potato salad, and pumpkin pie (energy-dense). Fruits included bananas,
apples, and grapes (nutrient-dense), and Jello, gummy fruit snacks, and chocolate-covered
raisins (energy-dense). Grains included oatmeal, whole-grain bread, and whole-grain
spaghetti (nutrient-dense), and brownies, doughnuts, and tortilla chips (energy-dense).
Dairy included string cheese, cheddar cheese, and cottage cheese (nutrient-dense), and
cheesecake, ice cream, and grilled cheese on white bread (energy-dense). Meats/beans
included sliced turkey, grilled chicken, and beans (nutrient-dense), and fried chicken
nuggets, hot dogs, and fried eggs (energy-dense). Beverages included milk, orange juice,
and water (nutrient-dense), and fruit punch, chocolate milk, and soda pop (energy-dense).
Using portion size data stamped on each food model and nutrition data available through
460 Journal of Communication 65 (2015) 443–464 © 2015 International Communication Association
K. Harrison et al. TV and Child Healthy-Meal Schemas
the USDA National Nutrient Database for Standard Reference (http://ndb.nal.usda.gov/),
we were able to verify that the energy-dense foods in each category collectively had
significantly more estimated Kcal than the nutrient-dense foods in the same category,
p < .001.
References
Ames, B. N. (2006). Low micronutrient intake may accelerate the degenerative diseases of
aging through allocation of scarce micronutrients by triage. Proceedings of the National
Academy of Sciences, 103(47), 17589–17594. doi:10.1073/pnas.0608757103.
Bandura, A. (2002). Social cognitive theory of mass communication. In J. Bryant & D.
Zillmann (Eds.), Media effects: Advances in theory and research (2nd ed., pp. 121–154).
Mahwah, NJ: Erlbaum.
Barradas, D. T., Fulton, J. E., Blanck, H. M., & Huhman, M. (2007). Parental influences on
youth television viewing. Journal of Pediatrics, 151, 369–373.
doi:10.1016/j.jpeds.2007.04.069.
Baskale, H., & Bahar, Z. (2011). Outcomes of nutrition knowledge and healthy food choices
in 5- to 6-year-old children who received a nutrition intervention based on Piaget’s
theory. Journal for Specialists in Pediatric Nursing, 16, 263–279.
doi:10.1111/j.1744-6155.2011.00300.x.
Bickel, G., Nord, M., Price, C., Hamilton, W., & Cook, J. (2000). Guide to measuring household
food security. Retrieved from http://www.fns.usda.gov/fsec/FILES/FSGuide.pdf
Centers for Disease Control & Prevention. (2007). Childhood obesity. Retrieved from
http://www.cdc.gov/nccdphp/dnpa/obesity/childhood/
Centers for Disease Control & Prevention. (2010). Measuring children’s height and weight
accurately at home. Retrieved from http://www.cdc.gov/healthyweight/assessing/bmi/
childrens_bmi/measuring_children.html#Height
Crespo, C. J., Smit, E., Troiano, R. P., Bartlett, S. J., Macera, C. A., & Andersen, R. E. (2001).
Television watching, energy intake, and obesity in U.S. children. JAMA Pediatrics, 155(3),
360–365. doi:10.1001/archpedi.155.3.360.
Dinour, L. M., Bergen, D., & Yeh, M. (2007). The food insecurity-obesity paradox: A review
of the literature and the role food stamps may play. Journal of the American Dietetic
Association, 107, 1952–1961. doi:10.1016/j.jada.2007.08.006.
Gantz, W., Schwartz, N. C., Angelini, J. R., & Rideout, V. (2007). Food for thought: Television
food advertising to children in the United States. Washington, DC: Kaiser Family
Foundation.
Gearhardt, A. N., & Brownell, K. D. (2013). The importance of understanding the impact of
children’s food marketing on the brain. Journal of Pediatrics, 62(4), 672–673.
doi:10.1016/j.jpeds.2012.11.068.
Harris, J. L., Bargh, J. A., & Brownell, K. D. (2009). Priming effects of television food
advertising on eating behavior. Health Psychology, 28(4), 404–413. doi:10.1037/a0014399.
Harrison, K. (2005). Is ‘fat free’ good for me? A panel study of television viewing and
children’s nutritional knowledge and reasoning. Health Communication, 17(2), 117–132.
doi:10.1207/s15327027hc1702_1.
Harrison, K., Bost, K. K., McBride, B. A., Donovan, S. M., Grigsby-Toussaint, D. S., Kim, J., ...
Jacobsohn, G. C. (2011). Toward a developmental conceptualization of contributors to
Journal of Communication 65 (2015) 443–464 © 2015 International Communication Association 461
TV and Child Healthy-Meal Schemas K. Harrison et al.
overweight and obesity in childhood: The Six-Cs Model. Child Development Perspectives,
5, 50–58. doi:10.1111/j.1750-8606.2010.00150.x.
Harrison, K., & Liechty, J. (2012). Preschoolers’ media exposure and dietary habits: The
primacy of television and the limits of parental mediation. Journal of Children and Media,
6(1), 18–36. doi:10.1080/17482798.2011.633402.
Harrison, K., & Marske, A. L. (2005). Nutritional content of foods advertised during the
television programs children watch most. American Journal of Public Health, 95(9),
1568–1574. doi:10.2105/AJPH.2004.048058.
Harrison, K., & Peralta, M. (2013, June). The placemat protocol: Parent TV viewing predicts
energy-dense food choices in preschoolers’ pretend healthy meals. Paper presented at the
63rd Annual Conference of the International Communication Association, London,
United Kingdom.
Hingle, M., & Kunkel, D. (2012). Childhood obesity and the media. Pediatric Clinics of North
America, 59(3), 677–692. doi:10.1016/j.pcl.2012.03.021.
Holub, S. C., & Musher-Eizenman, D. R. (2010). Examining preschoolers’ nutrition
knowledge using a meal creation and food group classification task: Age and gender
differences. Early Child Development and Care, 180, 787–798.
Institute of Medicine (2006). Food marketing to children and youth: Threat or opportunity?
Washington, DC: Author.
Jordan, A. B., & Robinson, T. N. (2008). Children, television viewing, and weight status:
Summary and recommendations from an expert panel meeting. The Annals of the
American Academy of Political and Social Science, 615, 119–132. doi:10.1177/0002716207
308681.
Kandiah, J., & Jones, C. (2002). Nutrition knowledge and food choices of elementary school
children. Early Child Development and Care, 172(3), 269–273. doi:10.1080/0300443
0212123.
Kim, J., & Dev, D. (2011). Child care nutrition environment: Is it related to children’s fruit
and vegetable intake? FASEB Journal, 25, 232.3.
Kimbro, R. T., & Rigby, E. (2010). Federal food policy and childhood obesity: A solution or
part of the problem? Health Affairs, 29(3), 411–418. doi:10.1377/hlthaff.2009.0731.
Lakshman, R. R., Sharp, S. J., Ong, K. K., & Forouhi, N. G. (2010). A novel school-based
intervention to improve nutrition knowledge in children: Cluster randomized controlled
trial. BMC Public Health, 10, 123. doi:10.1186/1471-2458-10-123.
Lowe, M. R., & Butryn, M. L. (2007). Hedonic hunger: A new dimension of appetite.
Physiology and Behavior, 91, 432–439. doi:10.1016/j.physbeh.2007.04.006.
McCarthy, A., Hughes, R., Tilling, K., Davies, D., Smith, G. D., & Ben-Shlomo, Y. (2007).
Birth weight; postnatal, infant, and childhood growth; and obesity in young adulthood:
Evidence from the Barry Caerphilly Growth Study. American Journal of Clinical
Nutrition, 86, 907–913.
McNeal, J. (1998). Tapping the three kids’ markets. American Demographics, 20, 37–41.
Miller, S. A., Taveras, E. M., Rifas-Shiman, S. L., & Gillman, M. W. (2008). Association
between television viewing and poor diet quality in young children. International Journal
of Pediatric Obesity, 3(3), 168–176. doi:10.1080/17477160801915935.
National Center for Health Statistics (2000a). 2 to 20 years: Boys stature-for-age and weight-for
age percentiles. Atlanta, GA: Centers for Disease Control and Prevention. Retrieved from
http://www.cdc.gov/growthcharts/data/set1clinical/cj41c021.pdf.
462 Journal of Communication 65 (2015) 443–464 © 2015 International Communication Association
K. Harrison et al. TV and Child Healthy-Meal Schemas
National Center for Health Statistics (2000b). 2 to 20 years: Girls stature-for-age and
weight-for age percentiles. Atlanta, GA: Centers for Disease Control and Prevention.
Retrieved from http://www.cdc.gov/growthcharts/data/set1clinical/cj41c022.pdf.
Nguyen, S. P. (2007). An apple a day keeps the doctor away: Children’s evaluative categories
of food. Appetite, 48, 114–118. doi:10.1016/j.appet.2006.06.001.
Nguyen, S. P., Gordon, C. L., & McCullough, M. B. (2011). Not as easy as pie: Disentangling
the theoretical and applied components of children’s health knowledge. Appetite, 56,
265–268. doi:10.1016/j.appet.2011.01.008.
Oates, C., Blades, M., & Gunter, B. (2002). Children and television advertising: When do they
understand persuasive intent? Journal of Consumer Behaviour, 1, 238–245.
doi:10.1002/cb.69.
Ogden, C. L., Carroll, M. D., Kit, B. K., & Flegal, K. M. (2014). Prevalence of childhood and
adult obesity in the United States, 2011–2012. JAMA, 311(8), 806–814.
doi:10.1001/jama.2014.732.
Roberts, D. F., & Foehr, U. G. (2004). Kids and media in America. Cambridge, England:
Cambridge University Press.
Rolland-Cachera, M. F., Deheeger, M., Maillot, M., & Bellisle, F. (2006). Early adiposity
rebound: Causes and consequences for obesity in children and adults. International
Journal of Obesity, 30, S11–S17. doi:10.1038/sj.ijo.0803514.
Schanzenbach, D. W. (2009). Do school lunches contribute to childhood obesity? Journal of
Human Resources, 44(3), 684–709.
Singleton, J. C., Achterberg, C. L., & Shannon, B. M. (1992). Role of food and nutrition in the
health perceptions of young children. Journal of the American Dietetic Association, 92,
67–70. doi:10.1177/1049732309334104.
Skinner, J., Carruth, B. R., Moran, J., Houck, K., Schmidhammer, J., Reed, A., ... Ott, D.
(1998). Toddlers’ food preferences: Concordance with family members’ preferences.
Journal of Nutrition Education, 30, 17–22.
Sonneville, K. R., Rifas-Shiman, S. L., Kleinman, K. P., Gortmaker, S. L., Gillman, M. W., &
Taveras, E. M. (2012). Associations of obesogenic behaviors in mothers and obese
children participating in a randomized trial. Obesity, 20, 1449–1454.
doi:10.1038/oby.2012.43.
Towensend, M. S., Peerson, J., Love, B., Achterberg, C., & Murphy, S. P. (2001). Food
insecurity is positively related to overweight in women. Journal of Nutrition, 131,
1738–1745.
United States Department of Agriculture. (2012). Health and nutrition information for
preschoolers. Retrieved from www.choosemyplate.gov/preschoolers.html
United States Department of Agriculture. (2013a). Supplemental nutritional assistance
program: Eligibility. Retrieved from http://www.fns.usda.gov/snap/applicant_
recipients/eligibility.htm
United States Department of Agriculture. (2013b). Supplemental nutritional assistance
program: Eligible food items. Retrieved from http://www.fns.usda.gov/snap/retailers/
eligible.htm
United States Department of Education (2008). Early Childhood Longitudinal Study, Birth
Cohort (ECLS-B): Longitudinal 8-month-preschool restricted-use data file
(NCES-2008-024). Washington, DC: National Center for Education Statistics, Institute of
Educational Sciences, U. S. Department of Education.
Journal of Communication 65 (2015) 443–464 © 2015 International Communication Association 463
TV and Child Healthy-Meal Schemas K. Harrison et al.
United States Department of Health and Human Services. (2013). 2013 poverty guidelines.
Retrieved from http://aspe.hhs.gov/poverty/13poverty.cfm#thresholds
Wansink, B. (2006). Mindless eating: Why we eat more than we think. New York, NY:
Bantam-Dell.
Wethington, E., & Johnson-Askew, W. L. (2009). Contributions of the life course perspective
to research on food decision-making. Annals of Behavioral Medicine, 38(Suppl. 1),
S74–S80. doi:10.1007/s12160-009-9123-6.
Zampollo, F., Kniffin, K. M., Wansink, B., & Shimuzu, M. (2011). Food plating preferences of
children: The importance of presentation on desire for diversity. Acta Paediatrica, 101,
61–66. doi:10.1111/j.1651-2227.2011.02409.x.
464 Journal of Communication 65 (2015) 443–464 © 2015 International Communication Association

More Related Content

What's hot

Nutrition Intervention Prog Lit Review
Nutrition Intervention Prog Lit ReviewNutrition Intervention Prog Lit Review
Nutrition Intervention Prog Lit ReviewJordyn Wheeler
 
Effect of Mothers Working and Non Working Status on the Nutritional Status of...
Effect of Mothers Working and Non Working Status on the Nutritional Status of...Effect of Mothers Working and Non Working Status on the Nutritional Status of...
Effect of Mothers Working and Non Working Status on the Nutritional Status of...YogeshIJTSRD
 
Ruchi-Pandya-FinalCapstoneProject
Ruchi-Pandya-FinalCapstoneProjectRuchi-Pandya-FinalCapstoneProject
Ruchi-Pandya-FinalCapstoneProjectRuchi Pandya
 
Promotion of Healthier Food Habits/ Choices within the family to combat Obesity
Promotion of Healthier Food Habits/ Choices within the family to combat Obesity Promotion of Healthier Food Habits/ Choices within the family to combat Obesity
Promotion of Healthier Food Habits/ Choices within the family to combat Obesity Sorcia D'Arceuil
 
How to Reduce Childhood Obesity
How to Reduce Childhood Obesity How to Reduce Childhood Obesity
How to Reduce Childhood Obesity Eman al-zawwad
 
Childhood Obesity Presentation
Childhood Obesity PresentationChildhood Obesity Presentation
Childhood Obesity Presentationgwmcdona
 
ASHP_2009_-_Anson_-_final[2]
ASHP_2009_-_Anson_-_final[2]ASHP_2009_-_Anson_-_final[2]
ASHP_2009_-_Anson_-_final[2]Christopher Anson
 
Nutritional status of boarding and non boarding children in selected schools ...
Nutritional status of boarding and non boarding children in selected schools ...Nutritional status of boarding and non boarding children in selected schools ...
Nutritional status of boarding and non boarding children in selected schools ...Alexander Decker
 
Urine Bisphenol A (BPA) level in relation to obseity and overweight ins schoo...
Urine Bisphenol A (BPA) level in relation to obseity and overweight ins schoo...Urine Bisphenol A (BPA) level in relation to obseity and overweight ins schoo...
Urine Bisphenol A (BPA) level in relation to obseity and overweight ins schoo...ricguer
 
Federal Support of State-level Food Policy Councils and Networks - CDC Childr...
Federal Support of State-level Food Policy Councils and Networks - CDC Childr...Federal Support of State-level Food Policy Councils and Networks - CDC Childr...
Federal Support of State-level Food Policy Councils and Networks - CDC Childr...Community Food Security Coalition
 
Association Of Breastfeeding Intensity And Bottle Emptying Behaviors At Early...
Association Of Breastfeeding Intensity And Bottle Emptying Behaviors At Early...Association Of Breastfeeding Intensity And Bottle Emptying Behaviors At Early...
Association Of Breastfeeding Intensity And Bottle Emptying Behaviors At Early...Biblioteca Virtual
 

What's hot (19)

Nutrition Intervention Prog Lit Review
Nutrition Intervention Prog Lit ReviewNutrition Intervention Prog Lit Review
Nutrition Intervention Prog Lit Review
 
Effect of Mothers Working and Non Working Status on the Nutritional Status of...
Effect of Mothers Working and Non Working Status on the Nutritional Status of...Effect of Mothers Working and Non Working Status on the Nutritional Status of...
Effect of Mothers Working and Non Working Status on the Nutritional Status of...
 
Ruchi-Pandya-FinalCapstoneProject
Ruchi-Pandya-FinalCapstoneProjectRuchi-Pandya-FinalCapstoneProject
Ruchi-Pandya-FinalCapstoneProject
 
Promotion of Healthier Food Habits/ Choices within the family to combat Obesity
Promotion of Healthier Food Habits/ Choices within the family to combat Obesity Promotion of Healthier Food Habits/ Choices within the family to combat Obesity
Promotion of Healthier Food Habits/ Choices within the family to combat Obesity
 
How to Reduce Childhood Obesity
How to Reduce Childhood Obesity How to Reduce Childhood Obesity
How to Reduce Childhood Obesity
 
Childhood Obesity Presentation
Childhood Obesity PresentationChildhood Obesity Presentation
Childhood Obesity Presentation
 
Undergraduate Research
Undergraduate ResearchUndergraduate Research
Undergraduate Research
 
FinalPaper-3
FinalPaper-3FinalPaper-3
FinalPaper-3
 
Jurnal Promosi Gizi Tingkat Sekolah Dasar
Jurnal Promosi Gizi Tingkat Sekolah DasarJurnal Promosi Gizi Tingkat Sekolah Dasar
Jurnal Promosi Gizi Tingkat Sekolah Dasar
 
ASHP_2009_-_Anson_-_final[2]
ASHP_2009_-_Anson_-_final[2]ASHP_2009_-_Anson_-_final[2]
ASHP_2009_-_Anson_-_final[2]
 
The Links Between the Neighborhood Food Environment & Childhood Nutrition
The Links Between the Neighborhood Food Environment & Childhood Nutrition The Links Between the Neighborhood Food Environment & Childhood Nutrition
The Links Between the Neighborhood Food Environment & Childhood Nutrition
 
Nutritional status of boarding and non boarding children in selected schools ...
Nutritional status of boarding and non boarding children in selected schools ...Nutritional status of boarding and non boarding children in selected schools ...
Nutritional status of boarding and non boarding children in selected schools ...
 
Urine Bisphenol A (BPA) level in relation to obseity and overweight ins schoo...
Urine Bisphenol A (BPA) level in relation to obseity and overweight ins schoo...Urine Bisphenol A (BPA) level in relation to obseity and overweight ins schoo...
Urine Bisphenol A (BPA) level in relation to obseity and overweight ins schoo...
 
Get involved!
Get involved!Get involved!
Get involved!
 
Federal Support of State-level Food Policy Councils and Networks - CDC Childr...
Federal Support of State-level Food Policy Councils and Networks - CDC Childr...Federal Support of State-level Food Policy Councils and Networks - CDC Childr...
Federal Support of State-level Food Policy Councils and Networks - CDC Childr...
 
Childhood Obesity
Childhood ObesityChildhood Obesity
Childhood Obesity
 
Association Of Breastfeeding Intensity And Bottle Emptying Behaviors At Early...
Association Of Breastfeeding Intensity And Bottle Emptying Behaviors At Early...Association Of Breastfeeding Intensity And Bottle Emptying Behaviors At Early...
Association Of Breastfeeding Intensity And Bottle Emptying Behaviors At Early...
 
Feeding Strategies paper
Feeding Strategies paperFeeding Strategies paper
Feeding Strategies paper
 
A19
A19A19
A19
 

Similar to Media exposure and dietary intake

An Analysis of the Socioeconomic Factors that Contribute to Childhood Obesity...
An Analysis of the Socioeconomic Factors that Contribute to Childhood Obesity...An Analysis of the Socioeconomic Factors that Contribute to Childhood Obesity...
An Analysis of the Socioeconomic Factors that Contribute to Childhood Obesity...Michael Gilmartin
 
Childhood Obesity
Childhood ObesityChildhood Obesity
Childhood Obesitypmgboji
 
AbstractComment by Tim Cameron Will you be adding the title page.docx
AbstractComment by Tim Cameron Will you be adding the title page.docxAbstractComment by Tim Cameron Will you be adding the title page.docx
AbstractComment by Tim Cameron Will you be adding the title page.docxbartholomeocoombs
 
Case Study Of Childhood Obesity Essay Example Paper.docx
Case Study Of Childhood Obesity Essay Example Paper.docxCase Study Of Childhood Obesity Essay Example Paper.docx
Case Study Of Childhood Obesity Essay Example Paper.docx4934bk
 
Aene project a medium city public students obesity study
Aene project   a medium city public students obesity studyAene project   a medium city public students obesity study
Aene project a medium city public students obesity studyCIRINEU COSTA
 
NEED BY 061220 CST Chicago, IL time . NO PLAGIARISM ALLOWED!!.docx
NEED BY 061220 CST Chicago, IL  time . NO PLAGIARISM ALLOWED!!.docxNEED BY 061220 CST Chicago, IL  time . NO PLAGIARISM ALLOWED!!.docx
NEED BY 061220 CST Chicago, IL time . NO PLAGIARISM ALLOWED!!.docxTanaMaeskm
 
NEED BY 061220 CST Chicago, IL time . NO PLAGIARISM ALLOWED!!.docx
NEED BY 061220 CST Chicago, IL  time . NO PLAGIARISM ALLOWED!!.docxNEED BY 061220 CST Chicago, IL  time . NO PLAGIARISM ALLOWED!!.docx
NEED BY 061220 CST Chicago, IL time . NO PLAGIARISM ALLOWED!!.docxhallettfaustina
 
Childhood Obesity Scholarly Paper.docx
Childhood Obesity Scholarly Paper.docxChildhood Obesity Scholarly Paper.docx
Childhood Obesity Scholarly Paper.docx4934bk
 
Running head SOURCE SUMMARY 1SOURCE SUMARRY.docx
Running head SOURCE SUMMARY                    1SOURCE SUMARRY.docxRunning head SOURCE SUMMARY                    1SOURCE SUMARRY.docx
Running head SOURCE SUMMARY 1SOURCE SUMARRY.docxagnesdcarey33086
 
Running head LITERATURE REVIEW 1LITERATURE REVIEW 5.docx
Running head LITERATURE REVIEW 1LITERATURE REVIEW 5.docxRunning head LITERATURE REVIEW 1LITERATURE REVIEW 5.docx
Running head LITERATURE REVIEW 1LITERATURE REVIEW 5.docxcowinhelen
 
TO ANALYZE THE ROLE OF RURAL WOMAN'S TO ENSURE CHILD NUTRITION IN DISTRICT RA...
TO ANALYZE THE ROLE OF RURAL WOMAN'S TO ENSURE CHILD NUTRITION IN DISTRICT RA...TO ANALYZE THE ROLE OF RURAL WOMAN'S TO ENSURE CHILD NUTRITION IN DISTRICT RA...
TO ANALYZE THE ROLE OF RURAL WOMAN'S TO ENSURE CHILD NUTRITION IN DISTRICT RA...Hafiz Muhammad Zeeshan Raza
 
Childhood Obesity Research Report
Childhood Obesity Research ReportChildhood Obesity Research Report
Childhood Obesity Research ReportGloriaDreamer
 
1Running head OBESITY IN MIDWESTERN CHILDREN.docx
1Running head OBESITY IN MIDWESTERN CHILDREN.docx1Running head OBESITY IN MIDWESTERN CHILDREN.docx
1Running head OBESITY IN MIDWESTERN CHILDREN.docxherminaprocter
 
Early_Obesity_Prevention_TBF_November_2014
Early_Obesity_Prevention_TBF_November_2014Early_Obesity_Prevention_TBF_November_2014
Early_Obesity_Prevention_TBF_November_2014Allison Bauer
 

Similar to Media exposure and dietary intake (20)

An Analysis of the Socioeconomic Factors that Contribute to Childhood Obesity...
An Analysis of the Socioeconomic Factors that Contribute to Childhood Obesity...An Analysis of the Socioeconomic Factors that Contribute to Childhood Obesity...
An Analysis of the Socioeconomic Factors that Contribute to Childhood Obesity...
 
posterupdate#3
posterupdate#3posterupdate#3
posterupdate#3
 
Childhood Obesity
Childhood ObesityChildhood Obesity
Childhood Obesity
 
Essay On Childhood Obesity
Essay On Childhood ObesityEssay On Childhood Obesity
Essay On Childhood Obesity
 
AbstractComment by Tim Cameron Will you be adding the title page.docx
AbstractComment by Tim Cameron Will you be adding the title page.docxAbstractComment by Tim Cameron Will you be adding the title page.docx
AbstractComment by Tim Cameron Will you be adding the title page.docx
 
Childhood Obesity
Childhood ObesityChildhood Obesity
Childhood Obesity
 
Case Study Of Childhood Obesity Essay Example Paper.docx
Case Study Of Childhood Obesity Essay Example Paper.docxCase Study Of Childhood Obesity Essay Example Paper.docx
Case Study Of Childhood Obesity Essay Example Paper.docx
 
Aene project a medium city public students obesity study
Aene project   a medium city public students obesity studyAene project   a medium city public students obesity study
Aene project a medium city public students obesity study
 
NEED BY 061220 CST Chicago, IL time . NO PLAGIARISM ALLOWED!!.docx
NEED BY 061220 CST Chicago, IL  time . NO PLAGIARISM ALLOWED!!.docxNEED BY 061220 CST Chicago, IL  time . NO PLAGIARISM ALLOWED!!.docx
NEED BY 061220 CST Chicago, IL time . NO PLAGIARISM ALLOWED!!.docx
 
NEED BY 061220 CST Chicago, IL time . NO PLAGIARISM ALLOWED!!.docx
NEED BY 061220 CST Chicago, IL  time . NO PLAGIARISM ALLOWED!!.docxNEED BY 061220 CST Chicago, IL  time . NO PLAGIARISM ALLOWED!!.docx
NEED BY 061220 CST Chicago, IL time . NO PLAGIARISM ALLOWED!!.docx
 
Childhood Obesity Scholarly Paper.docx
Childhood Obesity Scholarly Paper.docxChildhood Obesity Scholarly Paper.docx
Childhood Obesity Scholarly Paper.docx
 
Running head SOURCE SUMMARY 1SOURCE SUMARRY.docx
Running head SOURCE SUMMARY                    1SOURCE SUMARRY.docxRunning head SOURCE SUMMARY                    1SOURCE SUMARRY.docx
Running head SOURCE SUMMARY 1SOURCE SUMARRY.docx
 
Meiler_Final_Paper
Meiler_Final_PaperMeiler_Final_Paper
Meiler_Final_Paper
 
My Deakin Paper
My Deakin PaperMy Deakin Paper
My Deakin Paper
 
Running head LITERATURE REVIEW 1LITERATURE REVIEW 5.docx
Running head LITERATURE REVIEW 1LITERATURE REVIEW 5.docxRunning head LITERATURE REVIEW 1LITERATURE REVIEW 5.docx
Running head LITERATURE REVIEW 1LITERATURE REVIEW 5.docx
 
PS30129_11264
PS30129_11264PS30129_11264
PS30129_11264
 
TO ANALYZE THE ROLE OF RURAL WOMAN'S TO ENSURE CHILD NUTRITION IN DISTRICT RA...
TO ANALYZE THE ROLE OF RURAL WOMAN'S TO ENSURE CHILD NUTRITION IN DISTRICT RA...TO ANALYZE THE ROLE OF RURAL WOMAN'S TO ENSURE CHILD NUTRITION IN DISTRICT RA...
TO ANALYZE THE ROLE OF RURAL WOMAN'S TO ENSURE CHILD NUTRITION IN DISTRICT RA...
 
Childhood Obesity Research Report
Childhood Obesity Research ReportChildhood Obesity Research Report
Childhood Obesity Research Report
 
1Running head OBESITY IN MIDWESTERN CHILDREN.docx
1Running head OBESITY IN MIDWESTERN CHILDREN.docx1Running head OBESITY IN MIDWESTERN CHILDREN.docx
1Running head OBESITY IN MIDWESTERN CHILDREN.docx
 
Early_Obesity_Prevention_TBF_November_2014
Early_Obesity_Prevention_TBF_November_2014Early_Obesity_Prevention_TBF_November_2014
Early_Obesity_Prevention_TBF_November_2014
 

Media exposure and dietary intake

  • 1. Journal of Communication ISSN 0021-9916 ORIGINAL ARTICLE Parent and Child Media Exposure, Preschooler Dietary Intake, and Preschooler Healthy-Meal Schemas in the Context of Food Insecurity Kristen Harrison1, Mericarmen Peralta1, & STRONG Kids Team2 1 Department of Communication Studies and Research Center for Group Dynamics, Institute for Social Research, University of Michigan, Ann Arbor, MI 48104, USA 2 Family Resiliency Center, University of Illinois, Urbana, IL 61801, USA Media exposure is correlated with child obesity, yet the family behaviors underlying this link remain poorly understood. Using data from a sample of U.S. parents and their preschoolers, this study assessed parent and child exposure to 5 different media along with child dietary intake. Child healthy-meal schemas were measured with the Placemat Protocol, a novel play-based pretend meal assembly activity. Child and parent commercial TV viewing predicted greater obesogenic dietary intake for children in food-secure but not food-insecure households. Child commercial TV viewing also predicted a greater proportion of energy-dense to total foods in children’s pretend healthy meals. Discussion focuses on food insecurity as a potential moderator of marketing effects and calls for continued research on child meal schema development. Keywords: Parents, Television, Preschoolers, Healthy Meals, Schemas, Food Insecurity. doi:10.1111/jcom.12153 Although the rate of child obesity in the United States has leveled out since 2003, it remains high among preschoolers (Ogden, Carroll, Kit, & Flegal, 2014). Defining overweight as a body weight at or above the 85th percentile of the peer population and obesity as the portion at or above the 95th percentile, overweight and obesity together increased from 5.0 to 13.9% among 2- to 5-year-olds from 1976 to 2004 (CDC, 2007). In 2011–2012, more than 20% of U.S. 2- to 5-year-olds were overweight or obese (Ogden et al., 2014), and overweight between ages 2 and 5 is a robust predictor of adult obesity (McCarthy et al., 2007). The preschool years are a sensitive window of development because the adiposity rebound (i.e., the point in life when a person’s Corresponding author: Kristen Harrison; e-mail: krishar@umich.edu Journal of Communication 65 (2015) 443–464 © 2015 International Communication Association 443
  • 2. TV and Child Healthy-Meal Schemas K. Harrison et al. weight at a given height hits its lowest point and begins to rise again) in children who later become obese is roughly age 3, compared with age 6 among those who grow up normal-weight (Rolland-Cachera, Deheeger, Maillot, & Bellisle, 2006). Children’s social and family contexts constrain and influence their food choices (Harrison et al., 2011). U.S. children spend $200 billion annually, mostly on food products (Institute of Medicine, 2006). Children ages 2 to 14 influence an additional $500 billion in family purchases (Institute of Medicine, 2006), over 75% of which are grocery items (McNeal, 1998). Most TV advertisements targeting children sell foods high in energy and low in vital macronutrients and micronutrients (Gantz, Schwartz, Angelini, & Rideout, 2007; Harrison & Marske, 2005), and TV viewing predicts poorer nutritional knowledge and reasoning among 6-year-olds (Harrison, 2005). These findings suggest that children become receptive to commercial media information and misinformation about food and eating even before kindergarten. Parents (Wethington & Johnson-Askew, 2009) and childcare providers (Kim & Dev, 2011) are the primary gatekeepers of preschooler food intake, so adults exert more control over preschoolers’ daily food intake than do preschoolers themselves. However, between ages 3 and 5, children begin relating foods to health (Singleton, Achterberg, & Shannon, 1992). By school age, their beliefs about food guide children’s independent food choices and eating behaviors (Kandiah & Jones, 2002; Lakshman, Sharp, Ong, & Forouhi, 2010). Children as young as 6 who have completed nutri- tion education curricula display greater nutritional knowledge and more healthful independent food intake (Baskale & Bahar, 2011) and food preferences (Kandiah & Jones, 2002). As children’s independence over their dietary intake increases with entry into formal schooling, it is important to gauge preschoolers’ food schemas to understand what they think “healthy” meals are and how sociocultural factors such as family commercial media exposure may influence these perceptions. Communication researchers have a hand in the effort to understand and limit sociocultural influ- ences on early childhood overweight and obesity because we specialize in analyzing media and interpersonal messages and the influence of these messages on individu- als’ and families’ beliefs and behaviors. The collection of factors that influence family food buying behaviors and children’s energy intake and output is enormous (Harrison et al., 2011) and beyond the scope of this article, but as research consistently points to obesogenic food marketing as a key sociocultural factor, the relationship between commercial media exposure and child weight remains a research priority. Commercial TV and child obesogenic dietary intake Research linking children’s exposure to media, especially TV, to an increased risk of child overweight and obesity is now plentiful. Jordan and Robinson (2008) evaluated evidence for four mechanisms—reduced resting metabolic rate, displaced physical activity, obesogenic food purchasing in response to food marketing, and appetitive priming in response to food marketing and portrayals—and concluded that the most supported mechanisms were the latter two. Through food marketing in commercial media, viewers are urged to buy foods that seem rewarding to eat. Once those foods 444 Journal of Communication 65 (2015) 443–464 © 2015 International Communication Association
  • 3. K. Harrison et al. TV and Child Healthy-Meal Schemas are in the pantry, the same marketing messages (and other environmental cues) may prime cravings. Experimental research on appetitive priming (i.e., an externally cued desire for food to satisfy hedonic hunger, not produced by a physical deficit in energy; see Lowe & Butryn, 2007) revealed that children exposed to TV food advertising for salty snacks ate more of a nonadvertised salty snack during exposure than children exposed to advertisements for healthful foods or nonfood products (Harris, Bargh, & Brownell, 2009). In recognition of the power of marketing, the biological effects of food advertising on children’s ability to exert control over their eating have become a pediatric research priority (Gearhardt & Brownell, 2013). Before appetitive priming can lead to consumption, food must be purchased. The chief theoretical process assumed in most research on food marketing’s effects is social learning, specifically behavioral modeling urging audiences to buy on the basis of anticipated gratification (Bandura, 2002). Exposure to advertising for obesogenic foods is typically hypothesized to increase the likelihood of parents buying such foods and of children urging their parents to buy them. Research supports this hypothesis (Hingle & Kunkel, 2012) for both the chief purchasers (parents) and their children. For example, Harrison and Liechty (2012) and Miller, Taveras, Rifas-Shiman, and Gillman (2008) reported that preschoolers’ TV viewing predicted increased child intake of obesogenic foods and reduced intake of fruits and vegetables, which receive virtually no food advertising (Gantz et al., 2007). Despite evidence for both modeling and priming, Hingle and Kunkel (2012) argued that the mechanisms connecting family media exposure to obesogenic food consumption remain unclear, in part because the dynamics of requesting, demand- ing, buying, bargaining, instructing, compromising, sneaking, hoarding, stealing, and otherwise engaging with food are rarely observed in vivo by researchers. To the extent that children are learning about food from family negotiations and exchanges of information, and to the extent that commercial media have some role in this process, an empirical connection should exist between child commercial media exposure, child dietary intake, and children’s perceptions of healthy foods and meals. However, parent media exposure likely matters as well. Preschoolers are not as skilled as older children at remembering food brands and asking for them by name (Oates, Blades, & Gunter, 2002), so the power of TV advertising to influence parent buying through young children is limited. Although most studies on the media-obesity link have only measured child media exposure (Jordan & Robinson, 2008), it is helpful to measure both parent and child media exposure, especially since the TV viewing habits (Barradas, Fulton, Blanck, & Huhman, 2007) and dietary habits (Sonneville et al., 2012) of parents and children are correlated. Food insecurity as contextual variable A household variable of central interest in this article is food insecurity, which influ- ences the quantity and types of foods parents buy. Food insecurity exists when nutri- tious and safe foods are limited or when the ability to acquire them in socially accept- able ways is limited or uncertain, with more severe forms resulting in persistent child Journal of Communication 65 (2015) 443–464 © 2015 International Communication Association 445
  • 4. TV and Child Healthy-Meal Schemas K. Harrison et al. hunger (Bickel, Nord, Price, Hamilton, & Cook, 2000). Food insecurity is associ- ated with increased overweight and obesity among adults, but the link is inconsistent among children (Dinour, Bergen, & Yeh, 2007). Most food-insecure families have limited incomes; according to the United States Department of Agriculture (USDA), those with gross monthly incomes at or below 130% of the U.S. poverty guideline ($2,498 for a family of four in 2013) qualify for the Supplemental Nutrition Assistance Program (SNAP), formerly the Food Stamp Program (USDA, 2013a). Families who do not qualify for SNAP may also be food-insecure if the family budget is perceived to be inadequate to cover the family’s dietary needs. With respect to their receptivity to food marketing, food-secure and food-insecure parents may both be influenced by obesogenic food marketing, but in different ways. Food-secure families are likely to be influenced in the traditional, research-supported way: Greater exposure should be associated with greater consumption based on the theoretical mechanisms (modeling and priming) described earlier in this article. When family resources are perceived to be plentiful enough that there is no threat of starvation, food advertising should have more potential to lead to buying with fewer budgetary disincentives. Thus, for food-secure parents, we hypothesized that both parent and child exposure to commercial TV would predict (H1a) increased child intake of obesogenic foods and (H1b) decreased child intake of nonobesogenic foods (fruits and vegetables). Following this reasoning, it seems that anxiety over resources would limit effects of food advertising for food-insecure parents because there is little perceived “wig- gle room” in the family budget to satisfy advertising-cued hedonic hunger without threatening the goal of meeting the family’s nutritional needs on a limited income. In spite of this, food-insecure families may remain susceptible to the persuasive effects of food marketing and may even be uniquely susceptible during vulnerable times of their income cycle. Dinour et al. (2007) proposed a conceptual framework link- ing the monthly food-stamp cycle to a feast-famine pattern based on evidence that episodic food insecurity can lead to binge eating when food is plentiful, typically when the monthly allowance is received (Towensend, Peerson, Love, Achterberg, & Mur- phy, 2001). As this allowance is fixed, feasting early in the month increases the risk of famine later. The experience of hunger predisposes the family to feast again the next month, repeating the cycle. Even food-insecure families that do not participate in the SNAP program may experience this cycle, leading to greater attraction to and consumption of energy-dense foods (Harris et al., 2009) and rendering food advertis- ing particularly potent during the famine period. Given these competing rationales, we asked whether parent and child exposure to commercial TV would be related to child obesogenic dietary intake (RQ1a) and nonobesogenic dietary intake (RQ1b) for food-insecure families. It is unclear whether there is any reason to expect the relationship between commercial TV exposure and dietary intake to be stronger for food-secure than food-insecure families or vice versa. Given the lack of published research on food insecurity as a moderator in the media-obesity relationship, we asked (RQ2) whether 446 Journal of Communication 65 (2015) 443–464 © 2015 International Communication Association
  • 5. K. Harrison et al. TV and Child Healthy-Meal Schemas food insecurity would moderate the relationship between child and parent commer- cial TV exposure and child obesogenic and nonobesogenic food intake, as evidenced by significantly different relationships for food-secure and food-insecure families. Commercial TV and child healthy-meal schemas To parallel our hypotheses for child dietary intake, we also hypothesized that (H2) commercial TV viewing would predict child healthy-meal schemas emphasiz- ing more obesogenic (energy-dense) foods. Researchers have attempted to map food-schema development in children as young as 3 (Holub & Musher-Eizenman, 2010; Nguyen, 2007; Nguyen, Gordon, & McCullough, 2011). Defining healthy food schemas as evaluative categories that include items sharing the same value-laden assessment (e.g., “healthy” vs. “junky”) and operationalizing correct classification of foods such as apples as “healthy” and cookies as “junky,” these investigators have documented emerging nutrition knowledge among preschoolers. This knowledge is just better than chance (59%) at age 3 and improves to almost 80% by age 7 (Nguyen, 2007). Holub and Musher-Eizenman (2010) asked 69 3- to 6-year-olds to assemble pretend meals of four foods and one drink using photographs of 21 different foods and drinks. Within these constraints, children’s “healthy” meals featured less esti- mated fat and calories than their unhealthy meals, although few children were able to explain their choices verbally in nutritional terms. These foundational studies indicate that evaluative schematic cognitions about “healthy” foods and meals begin developing during the preschool years and are likely influenced along with family buying and consumption behaviors by sociocul- tural agents such as media food marketing. To update the verbal and photographic schema-assessment methods of past research, we opted to measure child healthy-meal schemas with a pretend-play procedure (Harrison & Peralta, 2013) involving real- istic three-dimensional food replicas. The schematic construct of interest in this study paralleled the “healthy” versus “junky” distinction identified by Nguyen and colleagues (Nguyen, 2007; Nguyen et al., 2011), since a food’s apparent identity as a health food or a junk food is a concrete, tangible indicator of food/nutritional quality from a young child’s perceptually dependent perspective. Half of the food models in the task were energy-dense (“junky”) and half were nutrient-dense (“healthy”), so we defined “healthiness” as a lower proportion of energy-dense to total food items in pretend meals. There was no reason to expect food insecurity to play a moderating role for children’s meal schemas. Method Participants This study was approved by the University of Michigan Health Sciences and Behav- ioral Sciences IRB prior to recruitment and data collection. Recruitment was based on a sample with unequal probability of selection among licensed preschools in a three-county area in Michigan that (a) were registered with the state Bureau of Chil- dren and Adult Licensing, a condition for receiving federal food assistance, (b) were Journal of Communication 65 (2015) 443–464 © 2015 International Communication Association 447
  • 6. TV and Child Healthy-Meal Schemas K. Harrison et al. located within 50 miles of the study center in one of nine urban or rural areas selected to maximize racial and economic diversity, and (c) enrolled a minimum of 10 chil- dren in the targeted age range. These criteria identified 25 eligible preschools, 18 of which agreed to participate (response rate = 72%). Parents of all 4- to 6-year-old chil- dren at each preschool were invited to complete a questionnaire for $50.00 and asked to provide permission for their children to be interviewed. Parents of more than one eligible child were asked to choose the oldest. Participants were 278 parents (93% female) reporting on their children. In addition, biometric (body mass) and meal schema data were obtained via direct interaction with 247 of participating parents’ children (50% female). Child age based on school-reported birthdates ranged from 40 to 76 months (M = 56.3, SD = 5.3), with 97% (232) between 48 and 72 months. All analyses involving data collected directly from children were restricted to the 247 complete parent–child pairs. All analyses involving data supplied exclusively by par- ents utilized the whole parent sample of 278. According to parent reports, 29% (68) of children were non-Hispanic Black, 59% (145) were non-Hispanic White, 7% (17) were Asian, 4% (11) were Hispanic, and 2% (6) were Native American Indian. In analyses, race/ethnicity was coded as Black versus non-Black due to higher obesity rates and greater TV viewing among African Americans than Anglo Americans (Crespo et al., 2001). About 38% (89) of parents were unmarried and 37% (87) reported receiving WIC assistance;1 26% (62) had enrolled their children in Head Start. For parent body mass index (BMI, a ratio representing weight for height), parents reported their height in feet and inches or centimeters and their weight in pounds or kilograms. Nonmetric responses were converted to metric and parent BMI was calculated by dividing weight in kg by height in cm squared. Education was measured by having parents check one of seven categories ranging from no formal education to postgraduate work; 46.5% (114) had obtained less than a 4-year college degree. Parents indicated monthly household income by checking 1 of 14 categories from 0 to >$6000; the median category was $2501–$3000 ($30,012–$36,000 annually). About 42% of the sample reported an annual income at or below the U.S. poverty threshold of $23,550 for a family of four in 2013 (United States Department of Health and Human Services, 2013). Procedure and measures Parents Parents completed questionnaires online or on paper. The demographic variables described above were measured for use as controls because they are related to media use (Roberts & Foehr, 2004). Parent media exposure variables included estimated weekly personal exposure to commercial TV, digitally recorded (DVR’d) TV with commercials skipped over, DVDs/VHS tapes, video games, websites, and books. To distinguish commercial TV from DVR’d TV, commercial TV exposure was measured first with the item “About how many minutes or hours do you usually watch television with commercials (not digitally recorded television)?” DVR’d TV exposure was then measured with the item “DVR (digitally recorded TV without commercials): About 448 Journal of Communication 65 (2015) 443–464 © 2015 International Communication Association
  • 7. K. Harrison et al. TV and Child Healthy-Meal Schemas how many minutes or hours do you usually watch?” Similar items were used for video games, websites, and books. Parents reported the estimated minutes/hours they used each medium during separate dayparts on a typical weekday (in the morning, while their child is at preschool, after their child comes home from preschool, and after dinner) and a typical weekend day (in the morning, after lunch, and after dinner; see Harrison & Liechty, 2012). Response options included 0 minutes, 15 minutes, 30 minutes, 1 hour, 2 hours, 3 hours, 4 hours, and 5+ hours. Hours were converted to minutes and scores for dayparts were added, with the weekday total multiplied by 5 added to the weekend day total multiplied by 2, yielding a weekly exposure score in minutes for each medium. These scores were divided by 60 to yield weekly exposure in hours. To assess child media exposure, the same set of questions and calculations were repeated for “your child.” Parents completed their child’s media exposure items after they had completed their own. Child dietary intake was estimated with parental reports of children’s consump- tion of seven foods (fruits, vegetables, sugared beverages, French fries, fast food, candy/sweets, and salty snacks) using items from the United States Department of Education’s Early Childhood Longitudinal Study, Birth Cohort (ECLS-B) interview protocol for 2-year-olds (United States Department of Education, 2008). The protocol began: “The next questions ask about food your child ate or drank during the past 7 days. Think about all the meals and snacks your child had from the time he/she got up until he/she went to bed. Be sure to include food your child ate at home, preschool, restaurants, play dates, anywhere else, and over the weekend.” Response options included 0 = my child did not eat/drink any _____ during the past 7 days, 1 = once a day, 2 = twice a day, 3 = three times a day, 4 = four or more times a day, 5 = one to three times during the past 7 days, 6 = four to six times during the past 7 days, and 7 = don’t know. Responses 5 and 6 were recoded as fractions representing average times per day (i.e., one to three times/week = 0.2857 times/day and four to six times/week = 0.7143 times/day). Responses of 7 (don’t know) were treated as missing data. Each individual item began “How many times did your child eat (drink)_____” and named the food in question. An index of obesogenic dietary intake was created by adding scores for sugared beverages, French fries, fast food, candy/sweets, and salty snacks; a complementary index of nonobesogenic dietary intake was created by adding scores for fruits and vegetables. Food insecurity was measured with the Stage 1 Screen from the USDA Guide to Measuring Household Food Security (Bickel et al., 2000). These items measure parental perceptions about adequate finances and adequate meal quality given financial con- straints. The five items are “I worried whether our food would run out before we got money to buy more”; “The food that we bought just didn’t last, and we didn’t have money to get more”; “We couldn’t afford to eat balanced meals”; “We relied on only a few kinds of low-cost food to feed the children because we were running out of money to buy food”; and “We couldn’t feed the children a balanced meal because we couldn’t afford that.” Response options ranged from 0 (never true in the last 12 months) to 4 (often true in the last 12 months). Internal consistency for the five items was α = .88. Journal of Communication 65 (2015) 443–464 © 2015 International Communication Association 449
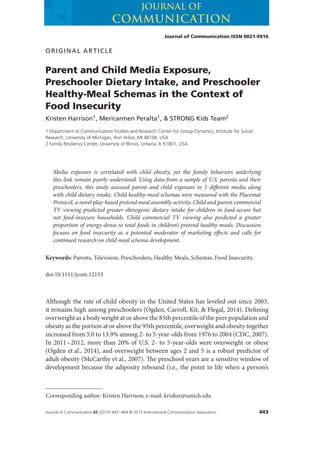
  • 8. TV and Child Healthy-Meal Schemas K. Harrison et al. About half (155 or 52%) of our parent sample answered “never true” for all five items and were coded “food secure”; the other half (141, or 48%) expressed at least some food insecurity and were coded “food insecure.” Children Children were interviewed in person at their preschools by trained research assistants. Healthy-meal schemas were assessed with the Placemat Protocol (Harrison & Peralta, 2013; see Figure 1). The Placemat is a 4′ × 5′ laminated mat with two copies each of 36 highly realistic food replicas in child-sized portions, arranged in categories (vegeta- bles, fruits, grains, dairy, meat and other proteins, and beverages) consistent with the USDA MyPlate initiative (USDA, 2012). Half of the items in each category are lower in calories and higher in micronutrients (nutrient-dense) and half are higher in calo- ries and lower in micronutrients (energy-dense). Replicas represented the unbranded food items consumed most frequently nationwide by U.S. preschoolers (Skinner et al., 1998).2 Each child was asked, “Are you hungry right now?” Response options included no, a little, or a lot. The researcher then seated the child on the mat in front of a 10’’ white plate, named the foods on the mat, and helped the child assemble the first meal (preferred foods). Children were told, “We’re going to make a pretend meal together, using the foods and drinks here. You can put a little food on the plate or a lot, but don’t put any more than you think you could eat at one time. Let’s start by making a meal of your FAVORITE foods. If you could pick any of these foods and drinks— the ones you like best—which would you pick?” When the child was finished, the plate was cleared and the procedure was repeated for the healthy meal: “Now we’re going to make a HEALTHY meal. I want you to pick foods and drinks you think are healthy.” The researcher avoided defining “healthy” to gauge children’s schemas without priming specific schematic content. To the 42 children who spon- taneously asked what “healthy” means, the researcher offered the prompt “good for your body.” All children constructed the preferred meal followed by the healthy meal, consistent with the preferred-before-healthy procedure used by Holub and Musher-Eizenman (2010). Energy-dense and nutrient-dense items were counted on each plate, and the proportion of energy-dense to total food items was calculated for each meal. Approximately 1–2 weeks after completing the Placemat Protocol, child height and weight were measured twice with a portable digital scale and stadiometer following Centers for Disease Control & Prevention (CDC) standardized pro- tocol (CDC, 2010). The weight measures correlated at r = .999 and the height measures at r = .998. BMI percentile was tabulated using the CDC’s BMI Tool for Schools program (National Center for Health Statistics, 2000a, 2000b). About 3% of the child sample were in the underweight range (<5th percentile), 73% were in the normal range (5th to 85th percentile), 23% were in the overweight/obese range (≥85th percentile), and 9% were in the exclusively obese range (≥95th percentile). 450 Journal of Communication 65 (2015) 443–464 © 2015 International Communication Association
  • 9. K. Harrison et al. TV and Child Healthy-Meal Schemas Figure 1 A 6-year-old girl using Placemat Protocol to complete preferred (top) and healthy (bottom) pretend meals. Results Descriptive statistics Means, standard deviations, and zero-order correlations for key variables are dis- played separately for parent (Table 1) and child (Table 2) media exposure variables. Because parent BMI, parent education, parent and child race/ethnicity, and household Journal of Communication 65 (2015) 443–464 © 2015 International Communication Association 451
  • 10. TV and Child Healthy-Meal Schemas K. Harrison et al. income were correlated with media exposure and dietary intake, they were entered as controls in analyses. Hypotheses and research questions Parent and child media exposure were positively correlated, from r = .23 for website hours to r = .72 for commercial TV hours. Parents reported media exposure for both themselves and their children, so these correlations could be inflated by measurement or could be legitimately high given probable overlap in parent–child viewing in daily family life. In spite of this overlap, child media predictors were not controlled when testing parent media predictors and vice versa because our goal was not to test the predictive power of independent parent and child media use but the gross estimated media diet of each, including overlapping exposure. Given the potential for inflated media exposure correlations due to measurement, any differences observed for parent versus child media exposure should be interpreted with caution. Hypothesis 1a–b We predicted that for food-secure parents, both parent and child commercial TV exposure would predict increased child intake of obesogenic foods (H1a) and decreased child intake of nonobesogenic foods (H1b). Multiple regression analyses with all media variables entered along with key demographic controls (see Table 3) demonstrated clear support for H1a. Both parent and child commercial TV exposure predicted increased child intake of obesogenic foods in food-secure families. H1b, in contrast, was supported only for child commercial TV exposure. Parent commercial TV exposure did not significantly predict decreased fruit and vegetable intake. Research question 1a–b These research questions asked whether the relationships between commercial TV viewing and dietary intake predicted for food-secure families would be observed for food-insecure families. The answer was no on both counts. As shown in Table 4, there were no significant relationships between any of the media variables and child dietary intake for the food-insecure families. Research question 2 To answer the question of whether the relationships between commercial TV viewing and child dietary intake differed significantly for food-secure and food-insecure fam- ilies (RQ2), we conducted multiple regression analyses similar to those above but with the entire sample and an additional step featuring the interaction between commer- cial TV viewing and food insecurity. Parent (β = −.16, ΔR2 = .02, p < .05) and child (β = −.22, ΔR2 = .04, p < .01) commercial TV exposure both interacted significantly with food insecurity in predicting child obesogenic dietary intake. The slopes reported for commercial TV and obesogenic dietary intake in Table 3 (food-secure families) were therefore significantly stronger than their counterparts in Table 4 (food-insecure families). The analogous analyses for nonobesogenic dietary intake did not produce 452 Journal of Communication 65 (2015) 443–464 © 2015 International Communication Association
  • 11. K. Harrison et al. TV and Child Healthy-Meal Schemas Table1Means,StandardDeviations,andIntercorrelationsforFamilyVariablesandParentMediaVariables(ParentN=296,ChildN=247) Measure12345678910111213141516 M27.880.264.527.9759.922.233.2114.796.505.641.429.748.250.620.390.48 SD7.680.441.174.8128.502.081.6914.809.2810.423.9611.3910.510.220.250.50 1.ParentBMI.25−.22−.37.20.05.00.30.10.22.01.10.21.02.16.26 2.Parentrace/ethnicity−.43−.53.01.22.05.37.09.31.30.07.26−.15.25.18 3.Parenteducation.67−.20−.28.02−.38−.16−.31−.32.09−.12.05−.30−.35 4.Householdincome−.23−.22.08−.36−.03−.32−.21−.06−.32.02−.23−.46 5.ChildBMIpercentile.12.04.12.08.08.13.05.04.13.04.15 6.Childobesogenicdietaryintake.02.24.08.28.20.16.01.01.08−.02 7.Childfruit/vegetableintake−.08.00.02−.01−.05.05.03−.02−.10 8.ParentcommercialTVexposure.31.36.28.23.15−.07.17.04 9.ParentDVR’dTVexposure.14.11.11.05−.02.14−.08 10.ParentDVD/VHSexposure.17.28.25−.08.12.08 11.Parentvideogameexposure−.02.00−.06.04.00 12.Parentwebsiteexposure.10−.01−.06−.05 13.Parentbookexposure.08.06.25 14.Proportionenergy-densefoods, childpreferredmeal −.02−.00 15.Proportionenergy-densefoods, childhealthymeal .18 16.Foodinsecurity Note:Parentrace/ethnicitycodedBlack=1,non-Black=0.Foodinsecuritycodedinsecure=1,secure=0.Meansfordietaryintakeindicatenumber oftimesconsumedperday.Coefficientssignificantatp<.05arenotedinbold. Journal of Communication 65 (2015) 443–464 © 2015 International Communication Association 453
  • 12. TV and Child Healthy-Meal Schemas K. Harrison et al. Table2Means,StandardDeviations,andIntercorrelationsforFamilyVariablesandChildMediaVariables(ParentN=296,ChildN=247) Measure12345678910111213141516 M27.880.294.527.9759.922.233.2110.884.204.982.481.377.940.620.390.48 SD7.680.461.174.8128.502.081.6912.157.107.605.303.717.220.220.250.50 1.ParentBMI.29−.22−.37.20.05.00.24.07.21.10.03.10.02.16.26 2.Childrace/ethnicity−.42−.52.01.23.02.40.09.24.14.12.28−.11.25.18 3.Parenteducation.67−.20−.28.02−.40−.12−.30−.20−.19−.20.05−.30−.35 4.Householdincome−.23−.22.08−.38.05−.25−.17−.16−.31.02−.23−.46 5.ChildBMIpercentile.12.04.14.02.22.17.08.06.13.04.15 6.Childobesogenicdietaryintake.02.34.15.26.32.20.11.01.08−.02 7.Childfruit/vegetableintake−.18−.03−.05−.16−.12.18.03−.02−.10 8.ChildcommercialTVexposure.19.41.43.36.17−.06.23.05 9.ChildDVRedTVexposure.34.17.35.06−.01.06.00 10.ChildDVD/VHSexposure.29.42.14.06.07.09 11.Childvideogameexposure.49.21.05−.04−.09 12.Childwebsiteexposure.30.09.03.05 13.Childbookexposure.07.05.11 14.Proportionenergy-dense foods,childpreferredmeal −.02−.00 15.Proportionenergy-dense foods,childhealthymeal .18 16.Foodinsecurity Note:Childrace/ethnicitycodedBlack=1,non-Black=0.Foodinsecuritycodedinsecure=1,secure=0.Meansfordietaryintakeindicatenumber oftimesconsumedperday.Coefficientssignificantatp<.05arenotedinbold. 454 Journal of Communication 65 (2015) 443–464 © 2015 International Communication Association
  • 13. K. Harrison et al. TV and Child Healthy-Meal Schemas Table 3 Multiple Regression Analyses Predicting Child Obesogenic (OB) and Nonobesogenic (Non-OB) Dietary Intake as Reported by Parents, for Food-Secure Families With Parent Media Predictors With Child Media Predictors OB Non-OB OB Non-OB Predictor β β β β Parent BMI −.02 −.04 −.00 .00 Race/ethnicity .21* .29* .35** .16 Parent education .00 .12 .04 .10 Household income .07 .07 .07 .02 Child BMI percentile .03 .01 .08 .06 Commercial TV .43*** −.17 .37*** −.30* DVR’d noncommercial TV .05 .06 .18* .06 DVD/VHS −.16 −.09 −.21** −.07 Video games .15 .04 .14 −.11 Websites −.17 −.10 .10 .01 Books .01 .27* −.02 .33** Total R2 .32*** .14 .49 ∗∗∗ .19 ∗ n 114 114 117 117 Note: Analyses using parent media predictors used parent race/ethnicity, and analyses using child media predictors used child race/ethnicity; other predictor variables are identical across analyses. Race/ethnicity coded Black = 1, non-Black = 0. *p < .05. ** p < .01. ***p < .001. significant interaction coefficients for either parent commercial TV viewing (β = .08) or child commercial TV viewing (β = .03). Thus the slopes reported for commercial TV and nonobesogenic dietary intake in Table 3 (food-secure families) were not sig- nificantly different from their counterparts in Table 4 (food-insecure families). Hypothesis 2 This hypothesis predicted that child and parent commercial TV viewing would predict a greater proportion of energy-dense to total foods in children’s pretend healthy meals. The multiple regression analyses testing this hypothesis featured the same demographic variables as the analyses for dietary intake, plus four additional controls: family food insecurity, child obesogenic dietary intake, child nonobesogenic dietary intake, and the proportion of energy-dense to total foods in children’s pretend preferred meals. This controlled the potential influence of family food insecurity and children’s daily eating habits and preferences on the composition of their pretend healthy meals. As summarized in Table 5, H2 was supported for child commercial TV viewing only. More child commercial TV viewing predicted a higher proportion of energy-dense to total foods in children’s pretend healthy meals. There was no relationship for parent commercial TV viewing, although the coefficient was positive. Journal of Communication 65 (2015) 443–464 © 2015 International Communication Association 455
  • 14. TV and Child Healthy-Meal Schemas K. Harrison et al. Table 4 Multiple Regression Analyses Predicting Child Obesogenic (OB) and Nonobesogenic (Non-OB) Dietary Intake as Reported by Parents, for Food-Insecure Families With Parent Media Predictors With Child Media Predictors OB Non-OB OB Non-OB Predictor β β β β Parent BMI −.05 .08 −.05 .15 Race/ethnicity −.08 −.05 .00 −.04 Parent education −.15 −.15 −.17 −.17 Household income −.03 .10 −.05 .03 Child BMI percentile .02 .11 .02 .13 Commercial TV −.09 −.01 −.10 −.12 DVR’d noncommercial TV −.02 −.05 −.03 .04 DVD/VHS .21 −.02 −.03 −.23 Video games .11 −.06 .23 −.13 Websites .14 .05 .07 .28 Books −.06 .04 −.02 .02 Total R2 .13 .04 .10 .13 n 86 85 85 84 Note: Analyses using parent media predictors used parent race/ethnicity, and analyses using child media predictors used child race/ethnicity; other predictor variables are identical across analyses. Race/ethnicity coded Black = 1, non-Black = 0. Discussion Both child and parent commercial TV exposure predicted increased child intake of obesogenic foods such as sugared beverages, French fries, fast food, candy/sweets, and salty snacks, but only for food-secure families. This finding is consistent with the argument that food insecurity constrains the influence of external factors such as food advertising by imposing limits on families’ ability to satisfy hedonic hunger with gratuitous food expenditures. Although people who receive supplemental nutri- tional assistance may spend their allotment on obesogenic fast foods and snack foods (USDA, 2013b) as well as fruits and vegetables, the overall dollar limit on the allot- ment (as well as limits on the monthly budgets of lower-income families who do not receive assistance) places a natural cap on food spending overall and demands care- ful planning regarding grocery expenditures. Food-insecure families, whose periodic hunger may render them equally if not more vulnerable than food-secure families to marketing-induced appetitive priming, are generally less able than food-secure fam- ilies to fulfill their cravings with spontaneous shopping or food expenditures beyond those planned for any given pay period. It is interesting that food insecurity operated in this manner given that income was controlled in the regression analyses. Regardless of income, it seems that the emo- tional state of food insecurity, which appears based on the screening items to be an 456 Journal of Communication 65 (2015) 443–464 © 2015 International Communication Association
  • 15. K. Harrison et al. TV and Child Healthy-Meal Schemas Table 5 Multiple Regression Analyses Predicting Proportion of Energy-Dense to Total Foods in Children’s Pretend Healthy Meals With Parent Media Predictors With Child Media Predictors Predictor β β Parent BMI .06 .07 Race/ethnicity .20* .12 Parent education −.09 −.12 Household income .06 .05 Child BMI percentile −.04 −.02 Food insecurity .18* .10 Dietary intake (OB) −.09 −.02 Dietary intake (fruit/veg) −.06 −.04 ED foods, preferred meal −.00 .01 Commercial TV .09 .21* DVR’d noncommercial TV .09 .08 DVD/VHS .04 −.02 Video games −.09 −.17 Websites −.13 .01 Books −.07 −.04 Total R2 .15* .14* n 195 197 Note: Analysis using parent media predictors used parent race/ethnicity, and analysis using child media predictors used child race/ethnicity; other predictor variables are iden- tical across analyses. Race/ethnicity coded Black = 1, non-Black = 0. Food insecurity coded 0 = food-secure, 1 = food-insecure. *p < .05. amalgam of worry and powerlessness, may be the driving factor behind its moder- ating role. The fact that commercial TV viewing and obesogenic dietary intake were correlated for food-secure but not food-insecure families raises the possibility that food-related modeling and priming processes are realized as action primarily among those who feel they can afford to take such action. Our findings also raise the possi- bility that food insecurity may temporarily protect children in food-insecure homes from marketing effects on excess dietary intake, even when appetitive priming occurs. Children cannot eat what their parents cannot buy. Food insecurity is exceptionally stressful (Bickel et al., 2000) so it would be unwise to argue that it is advantageous; still, the constraints it imposes on food purchasing may provide children limited protection against obesity during the preschool years. Findings for child fruit and vegetable intake were less consistent, with support for the predicted negative correlation emerging for child commercial TV viewing in food-secure families only. Perhaps persuasive marketing and media-induced appetitive priming processes occur primarily for obesogenic food, which is heavily Journal of Communication 65 (2015) 443–464 © 2015 International Communication Association 457
  • 16. TV and Child Healthy-Meal Schemas K. Harrison et al. advertised, and not fruits and vegetables, which are not (Gantz et al., 2007) and for which purchase and consumption are more strongly influenced by other factors. The fact that child commercial TV viewing predicted a more energy-dense pretend healthy meal for all children regardless of family food insecurity raises the possibility that family spending limits do not constrain the effects of direct exposure to market- ing on children’s developing meal schemas. Food-insecure children’s perceptions of healthy meals as containing more energy-dense foods could influence their indepen- dent food choices when and if the economic constraints of food insecurity are lifted (Baskale & Bahar, 2011; Kandiah & Jones, 2002). If these children continue to develop in a state of food insecurity, qualifying for reduced-price school lunches increases the likelihood that they will eat school lunch as opposed to a home-packed lunch. Panel research has linked children’s consumption of school lunches with increased over- weight and obesity over time (Schanzenbach, 2009; but see Kimbro & Rigby, 2010, for the contextual influence of local factors such as food pricing). Children who enter school with the perception that energy-dense foods play a prominent role in healthy meals may end up selecting more of these foods when given the option in the school lunch line. These possibilities are beyond verification with the current data set, but they merit investigation in longitudinal research. At this point our interpretation of the mechanisms by which food insecurity moderates the potential effects of house- hold commercial TV exposure on child dietary intake is speculative. At the very least, our data indicate that it would be wise to continue distinguishing food-secure from food-insecure families when exploring the mechanisms by which food marketing influences child dietary intake in the home. The purpose of including other media variables in this study was to compare a marketing-saturated medium (commercial TV) with media featuring little or no food marketing. The failure of most of the other media variables to predict child dietary intake and healthy-meal schemas may be due to the lack of food advertising in those media or to the possibility that relatively low exposure scores for the non-TV screen media (see Tables 1 & 2) reduced variance. Parent and child TV viewing are typi- cally correlated because children and parents often watch together (Barradas et al., 2007), but the low correlations (r = .19 for children and r = .31 for parents) between commercial TV and DVR’d TV suggest that some households in our sample watched mostly commercial TV whereas others watched mostly DVR’d TV. Commercial TV households may differ from other households on a number of factors linking media use and obesogenic food consumption through various leisure-time preferences. The positive correlations for child and parent book-reading and child fruit and vegetable intake in food-secure households are consistent with this possibility. What makes one household a book-reading, fruit-and-vegetable-eating dominion and another a commercial-TV-viewing, fast-food-eating dominion? Identifying how media and dietary variables cluster together should be a central goal of future research. Although this study reported some compelling findings, it has some important limitations. First, parent reports of media exposure and dietary intake are more sus- ceptible to error than observational data, so supplemental research involving in-home 458 Journal of Communication 65 (2015) 443–464 © 2015 International Communication Association
  • 17. K. Harrison et al. TV and Child Healthy-Meal Schemas observation of family media and dietary habits seems necessary. The magnitude of the observed relationships was also relatively modest, and the survey design precludes conclusions about causality. Certainly, commercial media exposure is but one of many factors influencing families’ food-buying decisions and cannot be expected to account for a large portion of the variance in family dietary intake. At the same time, even a small influence is important because TV habits are much more easily changed than factors such as family income or the community retail food environment. Just as nutrient-dense foods are not void of energy, energy-dense foods are not void of nutrients; therefore the distinction between energy-dense and nutrient-dense foods for the meal schema task was somewhat arbitrary, as a diet high in energy-dense foods can be quite nutritious. However, in terms of nutritional “bang for the buck,” we maintain that low-to-moderate-energy, micronutrient-dense foods such as whole-grain spaghetti, carrots, grapes, and milk are preferable to energy-dense, low-to-moderate-micronutrient foods such a doughnuts, potato salad, Jello, and fruit punch. This is because more vital macronutrients and micronutrients can be delivered by the first set of foods without excessive energy. Also, independent of energy intake, adequate intake of micronutrients delays degenerative aging and is more healthful than inadequate intake (Ames, 2006). The Placemat Protocol yields representations of meals as children imagine them but does not offer information on what children consume. The average pretend healthy meal for our child sample featured about eight items. Research on children’s food plating preferences points to an average of seven different items and six different colors (compared to three items and three colors for adults; Zampollo, Kniffin, Wansink, & Shimuzu, 2011), so a childhood fondness for variety has been empirically documented and is not unique to our sample. Food placed on a plate is not necessarily food eaten, but increased variety and larger portion sizes both encourage greater intake among children and adults (Wansink, 2006). If larger pretend meals predict the composition of larger real meals, then children who view more commercial TV may not only compose more energy-dense meals even when trying to eat healthily, but end up consuming more calories too. Lastly, just as adults do not always eat what they believe is healthiest, children’s perceptions of healthy eating will not necessarily guide their food choices. However, as nutritional curricula have led to more healthful independent food choices in chil- dren as young as 6 (Baskale & Bahar, 2011; Kandiah & Jones, 2002), interventions aimed at altering children’s healthy-meal schemas to include more accurate percep- tions of healthy eating should increase the frequency with which children choose nutrient-dense foods over energy-dense foods when they begin making dietary deci- sions outside the scope of parental supervision. This project did not involve collecting healthy-meal schema data for parents, so the correspondence between parents’ and children’s schemas is unknown. Likewise, without data recording foods available in the home, we are unable to document whether parent commercial TV exposure was directly correlated with family food Journal of Communication 65 (2015) 443–464 © 2015 International Communication Association 459
  • 18. TV and Child Healthy-Meal Schemas K. Harrison et al. buying behavior. Whatever the case, the relationships between family media expo- sure, family dietary habits, and parent–child discussions about food and health are undoubtedly complex and vary enormously within and between food-secure and food-insecure families. The data summarized here underscore the importance of measuring food insecurity in future attempts to map media and marketing effects on early childhood obesity and overweight, along with the need for more observational research to document these dynamics and their contributions to children’s developing meal schemas in the early-life context of the family home. A better understanding of how the processes of media-produced modeling and appetitive priming function within specific family constraints, financial or otherwise, will be necessary to produce feasible, realistic, and individually tailored strategies to help families meet their chil- dren’s nutritional needs while educating children to make the most healthful dietary choices possible when they begin assembling real meals on their own. Acknowledgments The STRONG Kids Team is a transdisciplinary collaborative at the University of Illinois including founding members Kelly K. Bost, Brent A. McBride, Sharon M. Donovan, Diana S. Grigsby-Toussaint, Janet M. Liechty, Angela Wiley, Margarita Teran-Garcia, and Barbara Fiese. The development of the Placemat Protocol was funded by the Illinois Council for Food and Agriculture Research, the Illinois Department of Human Services, and the USDA. Thanks to Sarah Brennan, Jennifer Lynne Buechel, Evan Carpenter, Rachel Hamden, Ana Hauser, Jessica Kaltz, Dugan Kemple, Jane Kim, Julia Lipowski, Jennifer Park, Elisse Rodriguez, Anna Spigelman, Nicole Tung, and Hannah Weiner for data collection. Notes 1 WIC refers to the U.S. Department of Agriculture’s Special Supplemental Nutrition Program for Women, Infants, and Children. The program provides funding for “supplemental foods, health care referrals, and nutrition education for low-income pregnant, breastfeeding, and nonbreastfeeding postpartum women, and to infants and children up to age five who are found to be at nutritional risk.” (http://www.fns.usda.gov/wic/women-infants-and-children-wic) 2 The vegetable food models included peas, carrots, and green beans (nutrient-dense) and French fries, potato salad, and pumpkin pie (energy-dense). Fruits included bananas, apples, and grapes (nutrient-dense), and Jello, gummy fruit snacks, and chocolate-covered raisins (energy-dense). Grains included oatmeal, whole-grain bread, and whole-grain spaghetti (nutrient-dense), and brownies, doughnuts, and tortilla chips (energy-dense). Dairy included string cheese, cheddar cheese, and cottage cheese (nutrient-dense), and cheesecake, ice cream, and grilled cheese on white bread (energy-dense). Meats/beans included sliced turkey, grilled chicken, and beans (nutrient-dense), and fried chicken nuggets, hot dogs, and fried eggs (energy-dense). Beverages included milk, orange juice, and water (nutrient-dense), and fruit punch, chocolate milk, and soda pop (energy-dense). Using portion size data stamped on each food model and nutrition data available through 460 Journal of Communication 65 (2015) 443–464 © 2015 International Communication Association
  • 19. K. Harrison et al. TV and Child Healthy-Meal Schemas the USDA National Nutrient Database for Standard Reference (http://ndb.nal.usda.gov/), we were able to verify that the energy-dense foods in each category collectively had significantly more estimated Kcal than the nutrient-dense foods in the same category, p < .001. References Ames, B. N. (2006). Low micronutrient intake may accelerate the degenerative diseases of aging through allocation of scarce micronutrients by triage. Proceedings of the National Academy of Sciences, 103(47), 17589–17594. doi:10.1073/pnas.0608757103. Bandura, A. (2002). Social cognitive theory of mass communication. In J. Bryant & D. Zillmann (Eds.), Media effects: Advances in theory and research (2nd ed., pp. 121–154). Mahwah, NJ: Erlbaum. Barradas, D. T., Fulton, J. E., Blanck, H. M., & Huhman, M. (2007). Parental influences on youth television viewing. Journal of Pediatrics, 151, 369–373. doi:10.1016/j.jpeds.2007.04.069. Baskale, H., & Bahar, Z. (2011). Outcomes of nutrition knowledge and healthy food choices in 5- to 6-year-old children who received a nutrition intervention based on Piaget’s theory. Journal for Specialists in Pediatric Nursing, 16, 263–279. doi:10.1111/j.1744-6155.2011.00300.x. Bickel, G., Nord, M., Price, C., Hamilton, W., & Cook, J. (2000). Guide to measuring household food security. Retrieved from http://www.fns.usda.gov/fsec/FILES/FSGuide.pdf Centers for Disease Control & Prevention. (2007). Childhood obesity. Retrieved from http://www.cdc.gov/nccdphp/dnpa/obesity/childhood/ Centers for Disease Control & Prevention. (2010). Measuring children’s height and weight accurately at home. Retrieved from http://www.cdc.gov/healthyweight/assessing/bmi/ childrens_bmi/measuring_children.html#Height Crespo, C. J., Smit, E., Troiano, R. P., Bartlett, S. J., Macera, C. A., & Andersen, R. E. (2001). Television watching, energy intake, and obesity in U.S. children. JAMA Pediatrics, 155(3), 360–365. doi:10.1001/archpedi.155.3.360. Dinour, L. M., Bergen, D., & Yeh, M. (2007). The food insecurity-obesity paradox: A review of the literature and the role food stamps may play. Journal of the American Dietetic Association, 107, 1952–1961. doi:10.1016/j.jada.2007.08.006. Gantz, W., Schwartz, N. C., Angelini, J. R., & Rideout, V. (2007). Food for thought: Television food advertising to children in the United States. Washington, DC: Kaiser Family Foundation. Gearhardt, A. N., & Brownell, K. D. (2013). The importance of understanding the impact of children’s food marketing on the brain. Journal of Pediatrics, 62(4), 672–673. doi:10.1016/j.jpeds.2012.11.068. Harris, J. L., Bargh, J. A., & Brownell, K. D. (2009). Priming effects of television food advertising on eating behavior. Health Psychology, 28(4), 404–413. doi:10.1037/a0014399. Harrison, K. (2005). Is ‘fat free’ good for me? A panel study of television viewing and children’s nutritional knowledge and reasoning. Health Communication, 17(2), 117–132. doi:10.1207/s15327027hc1702_1. Harrison, K., Bost, K. K., McBride, B. A., Donovan, S. M., Grigsby-Toussaint, D. S., Kim, J., ... Jacobsohn, G. C. (2011). Toward a developmental conceptualization of contributors to Journal of Communication 65 (2015) 443–464 © 2015 International Communication Association 461
  • 20. TV and Child Healthy-Meal Schemas K. Harrison et al. overweight and obesity in childhood: The Six-Cs Model. Child Development Perspectives, 5, 50–58. doi:10.1111/j.1750-8606.2010.00150.x. Harrison, K., & Liechty, J. (2012). Preschoolers’ media exposure and dietary habits: The primacy of television and the limits of parental mediation. Journal of Children and Media, 6(1), 18–36. doi:10.1080/17482798.2011.633402. Harrison, K., & Marske, A. L. (2005). Nutritional content of foods advertised during the television programs children watch most. American Journal of Public Health, 95(9), 1568–1574. doi:10.2105/AJPH.2004.048058. Harrison, K., & Peralta, M. (2013, June). The placemat protocol: Parent TV viewing predicts energy-dense food choices in preschoolers’ pretend healthy meals. Paper presented at the 63rd Annual Conference of the International Communication Association, London, United Kingdom. Hingle, M., & Kunkel, D. (2012). Childhood obesity and the media. Pediatric Clinics of North America, 59(3), 677–692. doi:10.1016/j.pcl.2012.03.021. Holub, S. C., & Musher-Eizenman, D. R. (2010). Examining preschoolers’ nutrition knowledge using a meal creation and food group classification task: Age and gender differences. Early Child Development and Care, 180, 787–798. Institute of Medicine (2006). Food marketing to children and youth: Threat or opportunity? Washington, DC: Author. Jordan, A. B., & Robinson, T. N. (2008). Children, television viewing, and weight status: Summary and recommendations from an expert panel meeting. The Annals of the American Academy of Political and Social Science, 615, 119–132. doi:10.1177/0002716207 308681. Kandiah, J., & Jones, C. (2002). Nutrition knowledge and food choices of elementary school children. Early Child Development and Care, 172(3), 269–273. doi:10.1080/0300443 0212123. Kim, J., & Dev, D. (2011). Child care nutrition environment: Is it related to children’s fruit and vegetable intake? FASEB Journal, 25, 232.3. Kimbro, R. T., & Rigby, E. (2010). Federal food policy and childhood obesity: A solution or part of the problem? Health Affairs, 29(3), 411–418. doi:10.1377/hlthaff.2009.0731. Lakshman, R. R., Sharp, S. J., Ong, K. K., & Forouhi, N. G. (2010). A novel school-based intervention to improve nutrition knowledge in children: Cluster randomized controlled trial. BMC Public Health, 10, 123. doi:10.1186/1471-2458-10-123. Lowe, M. R., & Butryn, M. L. (2007). Hedonic hunger: A new dimension of appetite. Physiology and Behavior, 91, 432–439. doi:10.1016/j.physbeh.2007.04.006. McCarthy, A., Hughes, R., Tilling, K., Davies, D., Smith, G. D., & Ben-Shlomo, Y. (2007). Birth weight; postnatal, infant, and childhood growth; and obesity in young adulthood: Evidence from the Barry Caerphilly Growth Study. American Journal of Clinical Nutrition, 86, 907–913. McNeal, J. (1998). Tapping the three kids’ markets. American Demographics, 20, 37–41. Miller, S. A., Taveras, E. M., Rifas-Shiman, S. L., & Gillman, M. W. (2008). Association between television viewing and poor diet quality in young children. International Journal of Pediatric Obesity, 3(3), 168–176. doi:10.1080/17477160801915935. National Center for Health Statistics (2000a). 2 to 20 years: Boys stature-for-age and weight-for age percentiles. Atlanta, GA: Centers for Disease Control and Prevention. Retrieved from http://www.cdc.gov/growthcharts/data/set1clinical/cj41c021.pdf. 462 Journal of Communication 65 (2015) 443–464 © 2015 International Communication Association
  • 21. K. Harrison et al. TV and Child Healthy-Meal Schemas National Center for Health Statistics (2000b). 2 to 20 years: Girls stature-for-age and weight-for age percentiles. Atlanta, GA: Centers for Disease Control and Prevention. Retrieved from http://www.cdc.gov/growthcharts/data/set1clinical/cj41c022.pdf. Nguyen, S. P. (2007). An apple a day keeps the doctor away: Children’s evaluative categories of food. Appetite, 48, 114–118. doi:10.1016/j.appet.2006.06.001. Nguyen, S. P., Gordon, C. L., & McCullough, M. B. (2011). Not as easy as pie: Disentangling the theoretical and applied components of children’s health knowledge. Appetite, 56, 265–268. doi:10.1016/j.appet.2011.01.008. Oates, C., Blades, M., & Gunter, B. (2002). Children and television advertising: When do they understand persuasive intent? Journal of Consumer Behaviour, 1, 238–245. doi:10.1002/cb.69. Ogden, C. L., Carroll, M. D., Kit, B. K., & Flegal, K. M. (2014). Prevalence of childhood and adult obesity in the United States, 2011–2012. JAMA, 311(8), 806–814. doi:10.1001/jama.2014.732. Roberts, D. F., & Foehr, U. G. (2004). Kids and media in America. Cambridge, England: Cambridge University Press. Rolland-Cachera, M. F., Deheeger, M., Maillot, M., & Bellisle, F. (2006). Early adiposity rebound: Causes and consequences for obesity in children and adults. International Journal of Obesity, 30, S11–S17. doi:10.1038/sj.ijo.0803514. Schanzenbach, D. W. (2009). Do school lunches contribute to childhood obesity? Journal of Human Resources, 44(3), 684–709. Singleton, J. C., Achterberg, C. L., & Shannon, B. M. (1992). Role of food and nutrition in the health perceptions of young children. Journal of the American Dietetic Association, 92, 67–70. doi:10.1177/1049732309334104. Skinner, J., Carruth, B. R., Moran, J., Houck, K., Schmidhammer, J., Reed, A., ... Ott, D. (1998). Toddlers’ food preferences: Concordance with family members’ preferences. Journal of Nutrition Education, 30, 17–22. Sonneville, K. R., Rifas-Shiman, S. L., Kleinman, K. P., Gortmaker, S. L., Gillman, M. W., & Taveras, E. M. (2012). Associations of obesogenic behaviors in mothers and obese children participating in a randomized trial. Obesity, 20, 1449–1454. doi:10.1038/oby.2012.43. Towensend, M. S., Peerson, J., Love, B., Achterberg, C., & Murphy, S. P. (2001). Food insecurity is positively related to overweight in women. Journal of Nutrition, 131, 1738–1745. United States Department of Agriculture. (2012). Health and nutrition information for preschoolers. Retrieved from www.choosemyplate.gov/preschoolers.html United States Department of Agriculture. (2013a). Supplemental nutritional assistance program: Eligibility. Retrieved from http://www.fns.usda.gov/snap/applicant_ recipients/eligibility.htm United States Department of Agriculture. (2013b). Supplemental nutritional assistance program: Eligible food items. Retrieved from http://www.fns.usda.gov/snap/retailers/ eligible.htm United States Department of Education (2008). Early Childhood Longitudinal Study, Birth Cohort (ECLS-B): Longitudinal 8-month-preschool restricted-use data file (NCES-2008-024). Washington, DC: National Center for Education Statistics, Institute of Educational Sciences, U. S. Department of Education. Journal of Communication 65 (2015) 443–464 © 2015 International Communication Association 463
  • 22. TV and Child Healthy-Meal Schemas K. Harrison et al. United States Department of Health and Human Services. (2013). 2013 poverty guidelines. Retrieved from http://aspe.hhs.gov/poverty/13poverty.cfm#thresholds Wansink, B. (2006). Mindless eating: Why we eat more than we think. New York, NY: Bantam-Dell. Wethington, E., & Johnson-Askew, W. L. (2009). Contributions of the life course perspective to research on food decision-making. Annals of Behavioral Medicine, 38(Suppl. 1), S74–S80. doi:10.1007/s12160-009-9123-6. Zampollo, F., Kniffin, K. M., Wansink, B., & Shimuzu, M. (2011). Food plating preferences of children: The importance of presentation on desire for diversity. Acta Paediatrica, 101, 61–66. doi:10.1111/j.1651-2227.2011.02409.x. 464 Journal of Communication 65 (2015) 443–464 © 2015 International Communication Association