2. 2
Contents
1.0 Abstract:....................................................................................................................... 4
2.0 Introduction:................................................................................................................. 5
2.1.0 Control hypothesis:....................................................................................................8
2.1.1 Variable hypothesis:...................................................................................................8
2.2.0 Aim:.......................................................................................................................... 9
3.0 Risk Assessment:.......................................................................................................... 10
4.0 Materials: Must making................................................................................................ 13
4.1 Materials: Into the Fermenter....................................................................................... 13
4.2 Materials: Sugar calculations........................................................................................ 13
4.3 Materials: Racking the wine.......................................................................................... 13
4.4.0 Materials: Using a hydrometer.................................................................................. 14
4.4.1 Materials: Using a refractometer.............................................................................. 14
4.4.2 Materials: Using a multiparameter............................................................................ 14
4.4 Materials: Acid-base titration ....................................................................................... 14
4.5 Materials: Assessing sulphur dioxide titration................................................................ 14
4.6 Materials: Concentration of alcohol titration................................................................. 15
4.7 Materials: Aerating the variable wine............................................................................ 15
5.0 Method: Must making.................................................................................................. 16
5.1 Method: Into the Fermenter......................................................................................... 16
5.2 Method: Sugar calculations .......................................................................................... 17
5.3 Method: Racking the wine............................................................................................ 17
5.4.0 Method: Qualitative tests- hydrometer..................................................................... 18
5.4.1 Method: Qualitative tests- refractometer.................................................................. 18
5. 4.2 Method: Qualitative tests- multiparameter................................................................ 18
5.5 Method: Acid-base titration ......................................................................................... 18
5.6 Method: Assessing sulphur dioxide titration.................................................................. 19
5.7 Method: Concentration of alcohol titration................................................................... 19
5.8 Method: Aerating the variable wine.............................................................................. 20
6.0 Results:....................................................................................................................... 21
6.1 Figure 1- Control wine results....................................................................................... 21
6.2 Results: Figure 2- Variable wine results ......................................................................... 21
6.3.0 Figure 3- Hydrometer for control wine....................................................................... 22
6.4.0 Figure 5: Control wine Brix vs. Ebulliometer............................................................... 22
3. 3
6.4.1 Figure 6: Variable wine Brix vs. Ebulliometer.............................................................. 23
6.5.0 Figure 7: Salinity in control wine vs. variable wine...................................................... 24
6.6.0 Figure 8: pH in control wine vs. variable wine............................................................. 24
6.7 Figure 9: Ebulliometer results ................................................................................... 25
7.0 Discussion:.................................................................................................................. 26
8.0 Conclusion:.................................................................................................................. 28
9.0 Appendices:................................................................................................................. 29
9.1 Reading a hydrometer:................................................................................................. 29
9.2 Sugar calculations:....................................................................................................... 30
9.2.1 Specific gravity correction table: ............................................................................... 30
9.2.2 Potential alcohol content table: ................................................................................ 30
9.2.3 Our sugar calculations: ............................................................................................. 31
9.2.4 Continued sugar calculations:.................................................................................... 31
9.3.0 Calibrating refractometer scale:................................................................................ 32
9.3.1 Refractometer scale example:................................................................................... 32
9.3.3 Labelled refractometer diagram:............................................................................... 33
9.4 Free sulphur dioxide quantities:.................................................................................... 33
9.5.0 Titration calculations- Total mass of sulphur dioxide:.................................................. 34
9.5.1 Titration calculations- Titratable acid:........................................................................ 35
9.5.2 Titration calculations- Concentration of alcohol: ........................................................ 36
9.6.0 Labelled multiparameter: ......................................................................................... 37
9.6.1 Our multiparameter: ................................................................................................ 37
9.7.0 Aerating the variable wine- aerating machine............................................................ 38
9.7.1 Aerating the variable wine- muslinlid........................................................................ 38
9.8.0 Adding sugar to the must:......................................................................................... 39
9.8.1 Adding starter bottle to the must:............................................................................. 39
9.9.0 Industrial gas trap:.................................................................................................... 40
9.9.1 Balloon gas trap:...................................................................................................... 40
9.9.2 Degrees to alcohol percentage conversionwheel:...................................................... 41
10.0 Bibliography.................................................................................................................... 42
4. 4
1.0 Abstract:
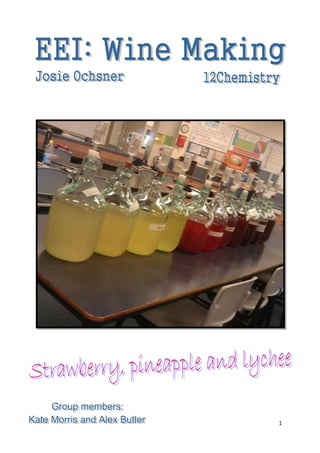
The fruitusedin thisinvestigationwere cannedpineapple andcannedlychees,whichwere bothin
natural juices,andfreshstrawberries.Variousanalytical tests,suchasthe usage of an Ebulliometer,
hydrometer,refractometeranda multiparameter, were performedonthe wine throughits
productiontocompare it those made inindustry.Oxidationwaschosenasa variable thatwas
carriedout on a small quantityof the wine,while the majoritywasleftasthe control to compare the
difference inresultsthatthe variable caused. The resultsweren’tsubstantiallydifferent,whichis
believedtobe because potassiummetabisulphite wasaddedtothe variable wine,whichhelpsto
preventoxidationfromoccurring.The final alcohol concentrationrecordedforthe variable winewas
13.3% and the control wine was13.7% sothere was a difference of 0.4% alcohol. Oxidationdidn’t
quantifiablyaffectthe specificgravity because the level of sugarinthe wine can’tbe alteredby
oxygen but oxygen can combine with glucose in aerobic respiration in whichethanol is not produced.
Slightdifferences betweenthe twowines were noticedinthe pHvalues andthe other
multiparameterresults.
5. 5
2.0 Introduction:
Wine isan alcoholicbeverage thatistypicallymade fromthe fermentationof grapesintoeither
white orred wine (Smith,Monteath,Gould,&Smith,2009). Howeverwine-like drinkscanbe made
fromothertypesof fruit,whichshouldbe referredtointhe name,suchas; strawberrywine,
because the word‘wine’byitself istechnicallyandlegallydefinedasgrape wine (Smith,Monteath,
Gould,& Smith,2009). Wine productionhasbecome substantiallymore popularin Australiasince it
was introducedshortlyafterthe FirstFleetin1788 (Smith,Monteath,Gould,&Smith,2009). The
QueenslandGovernmentsupportsthe wine industry andthere are manyguidelinesandlaws
regardingwine production(Smith,Monteath,Gould,&Smith,2009).
The fruitusedin thisinvestigationincludedcannedpineapple andcannedlychees,whichwere both
innatural juices,andfreshstrawberries.The natural sugarwithinthesefruitsallowsalcohol tobe
producedthroughthe processof fermentation,whichproducesethanol andcarbondioxidefrom
glucose inthe followingequation: C6H12O6 2CH3CH2OH + 2CO2 + 115kJ/mol (Smith,Gould,
Monteath,& Smith,2009). Thisis an anaerobicequation becausefermentationdoesn’trequire
oxygenand,inhighconcentrations,itisactuallytoxictothe yeast (Jacobs,2007). However,yeast
may still produce ethanol inthe presence of oxygenif theyare supportedwithgoodnutrition
(Jacobs,2007). Yeastneedssugarand energytosurvive andaerobicrespirationproducesnearly25
timesthe energyof anaerobic,whichisseeninthe followingequation: C6H12O6 +6O2 6H2O + 6CO2
+ 2830kJ/mol (Smith,Gould,Monteath,&Smith,2009).
Duringboth anaerobicandaerobicrespirationcarbondioxide (CO2) isproducedsotoavoid
potentiallyharmful pressure buildingupinthe fermentingvessel,a gas trap shouldbe used (Deeds,
2013). This will allow carbondioxidetoescape butwill notallow the entryof oxygen,whichcould
spoil the wine.If anindustrial gastrapis notavailable,aballooncanbe put overthe neck of the
fermentingvesselandthe carbondioxide releasedwill cause ittoexpandsoif the balloonhasn’t
inflatedwithin24hours itmay be an indicationthatthe yeastisn’tactive (Deeds,2013).
Ethanol isonlyproduced inanaerobicrespiration butthe yeastrequires aerobicrespirationfor
survival because of the energy efficiency (Deeds,2013).As well asallowingaerobicrespirationto
occur, oxygenisuseful inwine makingasitstopsexcess hydrogensulphide(H2S),whichisanatural
by-productfromyeastinthe processof fermentation (Zoecklein,2003),from spoilingthe wineand
producinga foul smell bycombiningwithitinthe followingequation: 2H2S(g) + 3O2(g) 2SO2(g) +
2H2O(g) (Dharmadhikari,2010).However,inthe presence of oxygen, phenoliccompounds,whichare
made of chemical compounds thataffectthe colour,taste andtexture of wine (JamesA Kennedy,
2002), become oxidisedandthe quinones(organiccompounds) producedmay thenformbrown
polymers (Ribereau-Gyon, 2000). One of the by-products of this reaction is hydrogen peroxide (H2O2),
whichisan evenstrongeroxidisingagentthanoxygen(Ribereau-Gyon,2000). Sulphurdioxide
(SO2) can be addedto the wine because itreactswiththe hydrogenperoxide tostopanyfurther
harmful oxidation (Ribereau-Gyon,2000). Addingsulphurdioxidepreserves the freshness and
flavoursinthe wine because oxygencancause the lossof the natural fruitysmell tothatof vinegar
and cause the taste tobecome more “nutty”(Dharmadhikari,2010). Sulphurdioxide also hinders
unwanted yeastsandbacteria(Plant,2001) that thrive amidabundantoxygen (Dharmadhikari,
2010). Sulphurdioxidecanbe addedthrough a few differentmethodsbutinthisinvestigation
6. 6
Campden tablets,whichare made of potassiummetabisulphite (usuallyeither0.44 or 0.55 grams),
or the powderformof thiswill be used(Smith,Monteath,Gould,&Smith,2009).
In industry,the concentrationof freesulphurdioxideshouldbe calculatedbefore adding more to
ensure the rightamountisaddedbecause toolittle won’tsufficientlypreventoxidationormicrobe
developmentandtoomuch can cause a foul smell,knownasrottenegggas (Smith,Gould,
Monteath,& Smith,2009). The total sulphurdioxidecontent canbe discoveredthroughtitration
(see method5.8) and ismade up of the freesulphurdioxideandbound sulphurdioxide,whichis
combinedwithsugarsandothercompoundssoit doesn’thave the same antioxidantand
antibacterial effect(Smith,Monteath,Gould,&Smith,2009). However, inAustraliathere isalegal
limitonthe total sulphurdioxide;250mg/Lina drywine (<35g/L sugar) and300mg/L in a sweet
wine (>35g/L sugar) and to be labelled “preservativefree”there mustbe lessthan10mg/L because
some people maysufferanallergicreactionif the concentrationishigher (Smith,Gould,Monteath,
& Smith,2009).
The amount of free sulphurdioxidewithinthe wine canalsobe affectedbythe pH (Kearney&
Bogolawski).The optimumpHforwhite winesisgenerallybetween3.0-3.3andbetween3.4‐3.5for
redwinesbutthismay slightlydifferdependingonthe type of wine,however,winesare prone to
spoilage andchemical instabilitywhenthe pHrisesabove 4.0 as bacteriacan reproduce inthese
conditions (Kearney&Bogolawski).Wine ismore likelytostayfresherforlongerandmaintain its
initial flavourandcolourinthe lowerpH range (Kearney&Bogolawski).The freshnessof the wine is
relatedtoyeastfermentation,oxidation,bacteriagrowthandfermentation,andproteinstability,
whichare all impacted bythe pH (Kearney&Bogolawski).
If the pH isbecomingtoohigh,itcan be loweredbyaddingtartaricacidand thusthe total acidityis
increased (Smith,Monteath,Gould,&Smith,2009). The total amountof acidin a wine iscalled
titratable acidity,whichisthe concentrationof both freeandbound hydrogenions(H+
) andshould
ideallybe between6.5-8.5g/L(Smith,Monteath,Gould,&Smith,2009). Thiscan be determined
throughan acid-base titration inwhichthe wine istitratedwithsodiumhydroxidesolutionuntil the
equivalence pointisachieved,whichhasapH between8.0- 8.4 (Hammond& McGraw, 2007). From
there the massof tartaric acid can be determinedthroughcalculations (see method 5.7) because in
industry,itisassumedthatthe onlyacid contributingtothe titratable acidityistartaricacid
(Megazyme International Ireland,2012).
The concentrationof alcohol inwine canalsobe determinedthroughtitration (see method 5.7).Itis
importantto measure the concentrationof alcohol because;itmustbe expressedonthe bottle label
inindustry,itdetermineshowmuchwinerieshave topaythe governmentinfeesandforquality
control (Smith,Gould,Monteath,&Smith,2009). If the concentrationof alcohol istoohigh;
generally over10-15%,the yeastwill die butsome strainscanwithstandupto 21% ethanol (Smith,
Monteath,Gould,& Smith,2009). Also,once the ethanol productionpeaksbrieflyduring
fermentation,itwill thendecline progressivelyasethanol beginstoaccumulate withinthe wine
(Jacobs,2007). Alcohol concentrationcanbe measuredusinganEbulliometerbasedonthe factthat
ethanol boilsat78.5°C andpure waterboilsat100°C (Smith,Monteath,Gould,&Smith,2009). The
boilingpointof the wine,whichcontainsalotof water,isdeterminedbythe Ebulliometerandthe
difference betweenthattemperature andthe water’sboilingpointiscalculated (Smith,Monteath,
7. 7
Gould,& Smith,2009). The difference inboilingtemperature is directlylinkedtothe presence of
ethanol inthe wine if there islittle sugarcontentbecause sugarwouldincrease the boilingpoint
(Smith,Monteath,Gould,&Smith,2009). Alcohol contentcanalso be measuredbya vinometerbut
sugar may interferewiththe technique itreliesuponsoitcan onlybe usedto calculate alcohol
percentage indrywines (Hammond&McGraw, 2007).
The sugar levelsinthe wine canbe measuredusingaRefractometerora hydrometer.A
Refractometermeasures howwelllighttravelsthroughthe wine,whichiscalledthe refractiveindex
(Hammond& McGraw, 2007). A sample of the wine isplacedunderthe prismcoverplate then,
while the Refractometerispointedtowardsasource of light, the eyepieceispeeredthroughto
show the scale,whichdisplays the brix % (1°brix=1g sugar per100mL liquid) (Hammond&McGraw,
2007). Because sugar breaksdownintoethanol duringfermentation,the potentialalcohol of the
wine canbe determinedfromthe °Brix inthe followingequation: Potential alcohol (%v/v) =0.6
x °Brix – 1 (Smith,Gould,Monteath,&Smith,2009). Light ispassedthroughthe wine and the degree
of lightbendingisdependentonthe quantityof dissolvedsolidspresent (Smith,Gould,Monteath,&
Smith,2009). Because the maindissolvedsolidinwine issugar,the higherthe refractive index(read
on the scale) the higherthe sugarlevel (Smith,Gould,Monteath,&Smith,2009). However,the
refractive index isdependentonthe temperature andmostrefractometersare calibratedto20°C so
if that isnot the temperature,adjustmentstothe readinghave tobe made usinga temperature
compensationtable,whichshouldbe apartof the refractometer’sinstructions (Hammond&
McGraw, 2007).
Hydrometerscompare the weightof aliquidtothe weightof water at 20°C (1g/mL) (Hammond&
McGraw, 2007). Thismeasurementiscalledspecificgravityanditincreasesasthe amountof
dissolvedsolidsincrease,which,aspreviouslymentioned,ismainlysugarinthe case of wine (Smith,
Gould,Monteath,& Smith,2009). Thus,the specificgravitywill dropasthe wine undergoes
fermentationbecause the sugarwill breakdown.Specificgravity(SG) canbe usedto determine °Brix
inthe followingequation: °Brix= 220 x (SG-1) + 1.6 (Smith,Gould,Monteath,&Smith,2009).
Many factors influence the efficiencyof fermentation,suchas;temperature,pH,carbondioxide and
more (Smith,Gould,Monteath,&Smith,2009). These factorsalsodependonthe fruitandtype of
yeastusedbutgenerallywhite wine shouldundergofermentationat 18-20 °C but itis possible to
use a highertemperature if the wine makerwishestoestablishmore complex properties (Robinson
& Jackson,2011). Usually,redwine isfermentedathighertemperaturesup to29 °C but if the
temperature reachesmuchhigherthanthatthe flavoursmay“boil off” (Robinson&Jackson,2011).
Redwinescanbe fermentedatlowertemperatures,similartothe typical white winetemperature
range,to bringout a strongerfruityflavour (Robinson&Jackson,2011). The relationshipbetween
temperature andrate of fermentationare directlylinked;soif the higherthe temperatureis,the
fasterthe rate of fermentationwill be and vice versa;if fermentationisoccurringreadilythenthe
temperature willincrease(Gladish,1999).Therefore,the temperature mustbe monitoredcarefully
as the ethanol fermentationcancause the wine toreach a temperature outof the optimumrange
and if the temperature exceeds30°C,the yeastwill eitherbecome inactive ordie andthusthe wine
will be spoiled (Robinson&Jackson,2011). Both pH and temperature canbe measuredwitha
multiparameter,butitalsomeasuressalinity,total dissolvedsolidsandconductivity.InAustralia,the
legal limitof solublechloridesinwineis1g/Lor about 1000ppm (Australiangovernment,2012).
8. 8
2.1.0 Control hypothesis:
It isexpectedthatthe alcohol concentration forthe control wine will reachbetween11.0-11.6%
because of the mass of sugar that wasaddedto the must. Asseeninthe equationfor fermentation;
perone mole of glucose twomolesof ethanol are producedandbecause of thisratio,the alcohol
concentrationcanbe predicted.The mustalreadycontainedabout78 grams of sugar per litre,which
was determinedfromthe specificgravity,andif nomore sugar were tobe addedthenthe potential
alcohol contentwouldhave been3.9%butsugar wasaddedto reach the desiredethanol percentage
of 11.6%. Due to an error in initial calculations,100 grams lessof sugar was addedthan needed,
whichin10L wouldonlybe 10g/L less.Inthe potential alcohol contenttable,the nextincrement
downfrom11.6% is 11.0% and 13g/L lesssugar,therefore the expectedpotential alcohol isfrom
11.0-11.6%.
2.1.1 Variable hypothesis:
It isexpectedthatthe alcohol concentrationforthe variable wine will be lowerthanthatof the
control wine. Thisisbecause inhighconcentrations,oxygencanbe toxictoyeast,whichisrequired
inthe processof fermentationtoproduce ethanol.However, the yeastmaystill produce ethanol in
the presence of oxygenif theyare supportedwithgoodnutritionbutitislikelythatthe ethanol
productionwill be somewhathinderedbythe oxygenpresent. Also,if there ismore oxygenpresent
thenthe yeastmay undergoaerobicfermentationmore oftenthanusual,whichdoesnotproduce
ethanol.
9. 9
2.2.0 Aim:
To produce a fruitwine andconduct variousanalytical testsonitto compare itthose made in
industry.A variable istobe chosenand carriedout ona small quantityof the wine,while the
majorityisleftasthe control to compare the difference inresultsthatthe variable caused.
10. 10
3.0 Risk Assessment:
Substance Risk Control Measure
Glassware Breakagesandcuts Handle withcare
Dispose of brokenglass
immediatelyand
properly- usingdustpan
and brush,NOTfingers
Paringknife Sharp blade maycause
cuts if usedincorrectly.
May be usedto stab
anotherperson,causing
grievous injuries.
Keepknife sharpby
meansof sharpening
stone usingkerosene as
lubricant.Bluntknives
are more likelyto cause
injurydue tothe
excessiveforce required
to cut.
Store securely
Alwayscuton or against
a woodensurface.Never
cut on or againsta hard
surface,since thiswill
bluntblade.
Carbondioxide Harmless(inquantities
generatedduring
experiments)
Toxicat high
concentrationsinairdue
to absorptionin blood,
loweringthe pH.
Magnesiumburnsin
carbon dioxide toform
magnesiumoxideand
carbon.
None requiredasitis
armlessinquantities
generatedduringthese
experiments
Ethanol Highlyflammable
Slightlytoxic;prolonged
contact withskin causes
irritation
Formsviolentlyexplosive
mixtureswith nitricacid
and otheroxidising
agents
Reactionof ethanol with
acidifieddichromate
solutionishighly
exothermic
Reactsviolentlywith
potassium
Store and use awayfrom
ignitionsources
Do not heatethanol ina
containeroveran open
flame;use a waterbath
that isspark proof.
If a fuel isrequired,use
metaldehyde or
hexamine tablets
Onlyuse as instructed;
do notcreate mixtures
11. 11
sodiumhypochloritesolution Toxic;evolvestoxic
chlorine gas
Skinirritant
Corrosive
Wear glovesandsafety
goggles
sodiummetabisulfite Moderatelytoxic;
releasestoxicsulphur
dioxide, especiallyon
contact withacids.
electricwaterbath Unlesscertifiedtobe
intrinsicallysafe,the
electriccomponentsof a
waterbath are a possible
ignition source
Checkfor electrical
safetyeachtime before
use.
Testand tag at regular
intervals
Do not use waterbath
withflammable liquids.
electronicbalance Can be knockedoff
bench,withpotential
injury tofeet
Dangerof electrocution,
especiallyinwetareasor
if wiringisdefective
Keepbackfrom edge of
bench
Keepcleanandtidy;
remove spilledchemicals
immediately
Checkwiringfordamage
each time before use
Testand tag at regular
intervals
Electricvacuumpump Fumescan cause light-
headedness
Fumesreleasedfrom
pumpshouldbe vented
outside awindoworinto
a fume cupboard;do not
inhale fumes
Checkfor electrical
safety(testandtag) at
regularintervals,if used
inlaboratoryor other
hazardousenvironment.
Acetaldehyde solution Slightlytoxic Do not ingest
0.005M iodine water Lung-irritantvapourof
iodine evolvedfromthe
concentratedsolution;
toxic.
Use a fume cupboardor
well-ventilatedarea
0.04M potassiumdichromate
solution
Slightlytoxic Do not ingest
Potassiumiodide Slightlytoxic Do not ingest
1M sodiumhydroxide solution Corrosive toskinand
eyes;toxic.
Do not ingest
Wear glovesandsafety
goggles
0.1M sodiumhydroxide solution Slightlytoxic Do not ingest
1M sodiumhydroxide solution Moderatelytoxic Do not ingest
12. 12
0.1M sodiumthiosulfate Moderatelytoxic;forms
toxicgaseson contact
withacids and on heating
Do not ingest
Whenusingwithacidsor
heat,use a fume
cupboardor well-
ventilatedarea
Sulphurdioxidegas Harmlessinquantities
generatedduringthese
experiments
Much higher
concentrationscanbe
highlytoxicandirritating
to lungs;maycause
asthmaattack
Extremelypungentodour
Whenusinga higher
concentration,use in
fume cupboardor well-
ventilatedarea
Sulphuricacidsolution(0.5Mto
4 M)
Corrosive;stronglyacidic Do not ingest
Wear glovesandsafety
goggles
Sulphuricacidsolution(4Mto 16
M)
Highlycorrosive toskin
and eyes;muchheat
evolvedwhenmixing
withwater;evolves toxic
fumeson heating
Alwaysaddacidto water
slowlywithvigorous
stirring
Wear glovesandsafety
goggles
Whenusinga higher
concentration,use in
fume cupboardor well-
ventilatedarea
Phenolphthalein Harmlessbuthas strong
laxative qualities
Do not ingest
Pectinase Eye and skinirritant Wear glovesandsafety
goggles
Ascorbicacid 3% solution
Potassiummetabisulfite 5%
solution
Eye and skinirritant Wear glovesandsafety
goggles
Yeast
Refractometer Prolongedexposure to
brightlightcan cause eye
damage
Do not pointat the sun
15. 15
Pipette filter
20mL measuringcylinder
Burette
Clampand stand
Small funnel (optional)
White tile
4.6 Materials: Concentration of alcohol titration
Detergent
Dilute domestos
Newspaper
10mL sample of control wine
60mL potassiumdichromate solution
(0.04M)
100mL standardsodiumthiosulphate
solution(0.1M)
30mL of 40% sulphuricacid
6g potassiumiodide
250mL distilled water
Starch indicator
10mL pipette
20mL pipettesx2
Pipette filter
250mL volumetricflask
250mL conical flaskswithstoppersx3
10mL measuringcylinder
Small funnel (optional)
Burette
Clampand stand
White tile
Hot waterbath
4.7 Materials: Aerating the variable wine
Aeratingmachine
Muslin
Elasticband
16. 16
5.0 Method: Must making
Hands were washedthoroughlywithwarmsoapywater.Knives,choppingboard,bucket,jug,
woodenstirringspoon,glassciderbottle,afunnel andcanopenerwere washedwithwarmwater
and detergentthensprayedwithdilutedomestosandrinsed.The workingbenchwascoveredin
newspaperthenthe choppingequipmentwasplacedontop.The strawberrieswerewashedthen
hulledandchoppedwiththe sterilisedknivesandplacedinthe bucket.The cannedpineappleand
lycheeswere openedandalsoplacedinthe bucket.
100mL of warm waterwasput intoa jugwith½ teaspoonof yeastnutrient,½teaspoonof acidblend
and ½ teaspoonof pectinase and swirledtocombine thenaddedtothe bucket,whichwasthenfilled
to the 10L markwithwarm water. 10mL of ascorbic acidand 10mL of potassiummetabisulphite was
addedto the bucketand stirredwithasterilisedwoodenspoon.
A funnel wasplacedinthe openingof the glassciderbottle and1 teaspoonof yeast,2 tablespoons
of sugar,1 cup of warm waterand ¼ teaspoonof yeastnutrientwere pouredinandcarefullyshaken
well thenleftforabout20 minutesina warm place until afrothyheaddeveloped. Twotablespoons
of sugarwere thenaddedandthe bottle wasfilledthe restof the waywithwarm water.A balloon
was placedoverthe neckof the bottle tocapture CO2 anda teatowel wasplacedoverthe top of the
bucketand heldinplace withanelasticstringandthey were leftina warmplace for 24 hours. The
newspaperwasthrownout,the equipmentwashed andthe workbenchwipeddown.
The nextday, calculationswere done todeterminethe massof sugarthat needstobe added
dependingonthe desiredalcohol percentage of the wine (see method5.2and appendices9.2).This
was done withthe use of a hydrometer,whichcanalsobe usedthroughoutthe winemakingprocess
to monitorthe sugar level thatchangesasa resultof fermentation(see method 5.4). A wooden
stirringspoonanda bowl were washedwithwarmwateranddetergentthensprayedwithdilute
domestosandrinsed. Afterthe sugarcalculationswere done,the requiredmassof sugar waspoured
intothe bowl,whichwason a setof scalesandit was thenpouredinto the bucketaswell as¾ of the
ciderbottle (see appendices 9.8.0 and9.8.1) contentsthenstirredwiththe woodenspoon.The tea
towel andelasticstringwere replacedandthe bucketwasleftinawarm place.The newspaperwas
discarded,all the equipment washedandthe workareawipeddown.
The nextday,a woodenstirringspoonwaswashedwithwarmwateranddetergentthensprayed
withdilute domestosandrinsed.The bucket’scontentswere stirredthoroughlyinattempttoassist
the sugar indissolvingandtocombine the flavours.The fruitwasallowedtosoakinthe bucketfor a
fewdays.
5.1 Method: Into the Fermenter
Before strainingthe fruit,handswere washedthoroughlyandabucket,a strainer,a woodenstirring
spoon,a funnel 2large sealable bottles and2 ciderbottles were washedwithwarmwaterand
detergentthensprayedwithdilutedomestosandrinsed.Newspaperwaslaidoutonthe floorand
the bucketcleanplacedonit withthe strainerontop. The contentsof the original bucketwere
pouredthroughthe strainerina fewlotsas the strainerhad to be emptiedof fruitwhenitbecame
17. 17
too full topassthe liquid throughwithease. The fruitinthe strainerwassquishedusingpressure
fromcleanhands toextract more juice andthenemptiedandthe pouringcontinueduntil the
original bucketwasempty.The original bucketandthe strainerwere thenrinsedandthe strainer
was placedontop of the bucketwitha sheetof muslininitwhichthe liquidwasthenpoured
through.The emptybucketand the muslinwere thenrinsedandthe strainerwasplacedontop of
the emptybucketwiththe muslininitandthe liquidwaspouredthroughagain.
The last ¼ of the starter bottle waspouredintothe bucketandstirredwiththe sterilised wooden
spoon. 0.5mL/ L mustof ascorbicacid and potassiummetabisulphite were added (5mLeach).The
twodemijohn bottleswere thenfilledwiththe liquidbypouringitthroughthe funnel andthenthe
leftoverwaspouredintotwociderbottles. Gastrapswere puton eachbottle,which were thenleft
ina warmplace.The newspaperandmuslinwere discardedandthe strainerandbucketwere
washed.
5.2 Method: Sugar calculations
A measuringcylinder,hydrometer,thermometeranda jugwere washedwithwarmwater and
detergentthensprayedwithdilutedomestosandrinsed.Newspaperwaslaidoutonworkbench
and sterilisedequipmentplacedontop. A sample of the liquidfromthe bucketwasdrawnoff with
the jug,carefullytoavoidchunksof fruitand the specific gravitywasfound(see method5.4).
The temperature of the liquid was taken and a specific gravity correction table (see appendices 9.2.1)
was used toslightlyadjustthe readingfromthe hydrometer asnecessary(if itisnot20°). Using a
potential alcohol contenttable (seeappendices 9.2.2);the specificgravityreadingclosesttothat on
the hydrometer(withpossible adjustments) waschosen andthen the massof sugar perlitre it
neededto containwasread.The desiredalcohol contentforthe wine waschosen anditwas seen
howmuch sugar isneededtoachieve thatbylookinginthe adjacentcolumnunder‘sugarperlitre’.
The mass of sugaralreadyacquired wassubtracted fromthe mass of sugar inthe desiredalcohol to
findthe amountof sugar that needed tobe addedperlitre then thiswasmultiplied bythe volumeof
wine (inlitres) thatisbeingmade.
5.3 Method: Racking the wine
Two demijohnbottles(thesame sizesasthe onescurrentlyinuse) andaplastictube were washed
withwarmwater anddetergentthensprayedwithdilute domestosandrinsed.Newspaperwaslaid
on the floorand the emptydemijohnwasputontop. One endof the tube wasput intoone of the
full demijohns (which was on the table so gravity would assist the process) about ¾ of the way down,
careful tonot make contact withthe leesinthe bottom.The otherendof the tube was suckeduntil
the liquidstartedflowingthroughthe tube andwhenitwasnearlyat the otherendit wasput into
the mouthof the steriliseddemijohn.The tube washeldthere until mostof the liquidhadbeen
transferred;justleavingthe leesbehindandthenthe tube wasquicklyremovedfromthe initial
demijohn.The same wasdone withthe otherdemijohnandthenone full Campden tabletwas
crushedand put intothe control wine andhalf of a Campden tabletwascrushedandputinto the
variable wine (the smallerdemijohn).The gastrapswere replaced.
18. 18
5.4.0 Method: Qualitative tests- hydrometer
A 100mL measuringcylinder,afunnel andthe hydrometerwere washedwithwarmwaterand
detergentthensprayedwithdilutedomestosandrinsed. Ontopof laidout newspaper,the
measuringcylinderwasfilledabout¾of the way,usingthe funnel.The hydrometerwasplacedin
the cylinderandpusheddowntocoat some of the stem, andthenthe rest of the cylinderwasfilled
withthe juice.The hydrometerwasspuntoridany gas bubblesthatmayhave beenattached,and
the markingwas read at eye level (seeappendices 9.1) whenithad stoppedspinning.
5.4.1 Method: Qualitative tests- refractometer
The refractometerwasfirstcalibratedbyplacinga few dropsof distilledwateronthe daylightplate
and thenprismcoverplate wasplaceddown,ensuringthere were nogasbubblesinthe liquid.The
scale whichdisplayedthe °Brix wasreadwhenpeeringthroughthe eyepiece towardsalightsource
(notdirectlyatthe sun) andthe contrastline shouldbe exactlyonthe “0” mark. If it’snot,thenthe
screwdriverthat comeswiththe refractometercanbe usedto twistthe calibrationscrew until the
line isexactlyonzero. If the scale seemsunclearthenadjustmentscanbe made by twistingthe
focusmechanismaroundthe eyepiece. The waterwasthenwipedawaygentlywithpapertowel and
a fewdropsof the wine were putontothe daylightplate of the refractometerand the reading
processwasrepeated. The same wasdone withthe otherwine afterthe daylightplate hadbeen
rinsedwithwaterandit wasrinsedagainbefore beingputaway.
5. 4.2 Method: Qualitative tests- multiparameter
A 250mL beakerwaswashedwithwarmwaterand detergentthensprayedwithdilute domestos
and rinsedand the sensortipof a multiparameterwaswashedthoroughlywithwarmwater (after
the cap wasremoved).Ontopof laidoutnewspaper,the beakerwasfilled abouthalf waywiththe
control wine andthe multiparameterwasturnedonandsat intothe liquidwiththe sensortip
immersed.The screendisplayedthe temperature andthe firstreading;eithersalinity,total dissolved
solids,conductivityorpHand theywere recorded.The modebuttonwaspressedtoshow the next
readinguntil all of themwere recorded. The tipwasrinsedoff before replacingthe capandputting
away (see appendices9.6.0and 9.6.1 forlabelleddiagrams).
5.5 Method: Acid-base titration
All equipmentwaswashedwithwarmwateranddetergentthensprayedwithdilute domestosand
rinsed. Ontopof laidoutnewspaper,about100mL of the control wine waspouredintoa Buchner
flaskanda rubberstopperwasfittedsecurelyinthe topandthe side armwas connectedtoa
vacuumpump.The flaskwasshakengentlyforabout2-3 minutesundervacuum.The burette was
filledwith0.1Msodiumhydroxide(NaOH).About100mL of distilledwaterwasaddedtoa 250mL
conical flaskand3-4 dropsof phenolphthaleinindicatorwasaddedamixedwell.Sodiumhydroxide
solutionwasaddedfromthe burette until the solution reachedthe equivalence pointinwhichit
turneda pale pinkcolourthat persistedforatleast30 seconds.Then10.0mL of the degassedwine
19. 19
was addedintothe conical flaskusingapipette.Forease,the burette wasfilledtothe topmark with
the 0.1M sodiumhydroxide andthe initialburette readingwasrecorded.The solutioninthe flask
was titratedwiththe NaOHfromthe burette until the pale pinkcolourpersistedforatleast30
seconds.The final burette readingwasreadandthe difference betweenitandthe initial readingwas
calculated,whichgave the titre value.Three lotsof thistitrationweredone,using10.0mL fromthe
same degassedwine inthe Buchnerflaskeachtime andthe average of the resultswascalculated.
Thisnumberwasput intothe calculationsasthe titre valueto discoverthe massof tartaric acidin
one litre of wine (see appendices 9.5.0).
5.6 Method: Assessing sulphur dioxide titration
All equipmentwaswashedwithwarmwateranddetergentthensprayedwithdilute domestosand
rinsed. Ontopof laidoutnewspaper, 20.0mL of wine wastransferredtoeachof three 250mL conical
flasksusingapipette.Toeachflaskabout12mL of 1M sodiumhydroxide solutionwasaddedandthe
flasks were allowed to standfor 15 minutes to release sulphur dioxide bound in complex compounds.
A burette wasfilledwithstandardiodinesolutionandthe initial burettereadingandconcentration
of the solutionwasrecorded.Toone flask,about10mL of 2M sulphuricacidand1-2mL of starch
indicatorwasaddedand the mixture wasimmediatelytitratedwithiodine solution. Whenthe
equivalence pointwasreachedinwhicha blue colourpersistedforatleast30 seconds,the burette
readingwasrecorded.The methodwasrepeatedforthe twootherflasksandthe burette was
refilledwithstandardiodine solutionbeforeeach. Fromthe three resultsthe average wascalculated
and putintothe calculationstodiscoverthe total massof sulphurdioxideasthe titre value (see
appendices 9.5.1).
5.7 Method: Concentration of alcohol titration
All equipmentwaswashedwithwarmwateranddetergentthensprayedwithdilute domestosand
rinsed. Ontopof laidoutnewspaper, 10mL of the control wine wasput intoa 250mL volumetric
flaskusinga pipette andthe volume wasmade uptothe 250mL mark withdistilledwaterandmixed
thoroughly.Fromthisdilutedwine,a20mL aliquotwasputin eachof three conical flasks.Toeach
flask,a 20mL aliquotof 0.04M potassiumdichromate solutionwasadded.10mLof 40% sulphuric
acid wasaddedto each flaskusingameasuringcylinder anda rubberstopperwasinsertedloosely
intothe tops of each and theywere thenheatedinawaterbath at about45-50°C for10 minutes.
After10 minutes,theywere removedfromthe waterbathand 2g of potassiumiodidewasaddedto
each.A burette wasfilledwithstandardthiosulphatesolutionandtitratedagainstthe contentsof
one flaskandwhenthe initiallybrownsolution formedagreencolour1-2mLof starch solutionwas
added,whichturneditblue.More thiosulphatesolutionwasaddedtothe flaskfromthe burette
until the equivalence pointwasreachedinwhichthe colourchangesfromblue toa clear green
colour.The final burette readingwasrecordedandthenthe othertwoflaskswere titratedusingthe
same method andthe burette wasrefilled before both.Fromthe three resultsthe average was
calculatedandput intothe calculationstodiscoverthe concentrationof alcohol asthe titre value
(see appendices 9.5.2).
20. 20
5.8 Method: Aerating the variable wine
A tube that wasattachedto an aeratingmachine (see appendices 9.7.0) wasrinsedandputintothe
variable wine.The machine wasturnedonforabouta minute tointroduce oxygenintothe wine.
Thiswas done everypossible dayafterall the qualitative testswere done sothe addedoxygenand
bubblesdidn’thave aneffect. Insteadof insertingagastrap, a sheetof muslinwastiedoverthe
neckof the bottle withanelasticband to keepbugsoutbut allow the entryof oxygen(see
appendices9.7.1).
21. 21
6.0 Results:
6.1 Figure 1- Control wine results
6.2 Results: Figure 2- Variable wine results
Days
since
initiation
Temperature
(°C)
pH Conductivity
(ppb)
TDS
(ppm)
Salinity
(ppb)
Hydrometer Refractometer
(%)
Ebulliometer
(°C/ %)
Day 2 - - - - - 1.032 - -
Day 9 - 3.42 1273 0.906 630 - - -
Day 10 - - - - - 1.010 - -
Day 15 18.1 3.52 1380 0.981 755 0.990 5.5 -
Day 18 19.4 3.75 1391 0.985 962 0.988 6.5 -
Day 22 17.8 3.60 1430 1.02 710 0.988 6.2 -
Day 23 18.2 3.60 1422 1.01 706 0.992 5.8 Trial 1: 90.2/
14.0
Trial 2: 90.4/
14.0
Day 25 17.7 3.68 1434 1.02 708 0.998 7.0 -
Day 29 20.6 3.75 1479 1.04 811 0.988 7.0 -
Day 32 19.6 3.67 1509 1.07 751 0.990 6.2 90.8/ 13.7
Day 36 19.7 3.65 1557 1.11 779 0.991 6.2 -
Day 38 16.7 3.72 1531 1.09 761 0.992 6.7 90.7/ 13.7
Day 39 18.2 3.69 1589 1.13 794 0.990 7.0 -
Days
since
initiation
Temperature
(°C)
pH Conductivity
(ppb)
TDS
(ppm)
Salinity
(ppb)
Hydrometer Refractometer
(%)
Ebulliometer
(°C/ %)
Day 10 18.2 3.48 1376 0.977 682 1.012 - -
Day 15 18.5 3.44 1409 0.999 771 0.990 7.0 -
Day 18 19.5 3.80 1406 0.992 764 0.989 4.0 -
Day 22 19.4 3.75 1455 1.03 721 0.990 6.8 -
Day 23 18.0 3.74 1436 1.02 786 0.992 7.0 -
Day 24 - - - - - - - 90.7/ 13.1
Day 25 17.9 3.66 1468 1.05 729 0.989 5.6 -
Day 29 20.1 3.90 1597 1.11 873 0.990 6.8 -
Day 32 19.3 3.71 1592 1.13 797 0.992 6.6 91.1/ 13.1
Day 36 20.1 3.65 1612 1.14 809 0.990 6.4 -
Day 38 17.0 3.74 1615 1.15 805 0.992 6.6 90.9/ 13.3
Day 39 18.2 3.70 1676 1.19 834 0.990 6.7 -
The table above displaysthe resultsfromthe qualitativeteststhatwere performedonthe control wine
throughoutthe entire winemakingprocess.Note:The firstnumberinthe ebulliometercolumnisthe boiling
pointforthe wine andthe secondnumberisthe percentage of alcohol itcontainsbasedonthe difference
betweenthe boilingpointof the waterandthe wine, whichcanbe determinedusingaconversionwheel
(appendices9.9.2).
The table above displaysthe resultsfromthe qualitativeteststhatwere performedonthe variable wine
throughoutthe entire winemakingprocess.Note:The firstnumberinthe ebulliometercolumnisthe boiling
pointforthe wine andthe secondnumberis the percentage of alcohol itcontainsbasedonthe difference
betweenthe boilingpointof the waterandthe wine,whichcanbe determinedusingaconversionwheel
(appendices9.9.2).
22. 22
R² = 0.914
R² = 0.8909
0.94
0.96
0.98
1
1.02
1.04
1.06
1.08
1.1
1 3 5 7 9 11 13 15 17 19 21 23 25 27 29 31 33 35 37 39
Specificgravity(SG)
Day since initiation
Hydrometer readings
Control
Variable
Poly. (Control)
Poly. (Variable)
R² = 0.6851
R² = 1
0
2
4
6
8
10
12
14
16
22 23 24 25 26 27 28 29 30 31 32 33 34 35 36 37 38 39
°Brix/%alcohol
Days since initation
Relation of °Brix to alcohol %
°Brix
% alcohol
Poly. (°Brix)
Poly. (% alcohol)
6.3.0 Figure 3- Hydrometer for control wine
6.4.0 Figure 5: Control wine Brix vs. Ebulliometer
The graph above showsthe relation of °Brix toalcohol percentage inthe control wine overaperiodof
time.Itcan be seenthatthe refractive index (measuredin°Brix) isinverselyrelatedtothe alcohol
percentage sowhenthe °Brix decreasesthe alcohol percentage increases.
The graph above showsthe specificgravityfromthe hydrometerforthe control wine versusthe
variable wine fromday1 to day 39 of the fermentingprocess.
23. 23
R² = 0.4761
R² = 1
0
2
4
6
8
10
12
14
16
22 23 24 25 26 27 28 29 30 31 32 33 34 35 36 37 38 39
°Brix/%alcohol
Days since initiation
Relation of °Brix to alcohol %
°Brix
% alcohol
6.4.1 Figure 6: Variable wine Brix vs. Ebulliometer
The graph above showsthe relationof °Brix toalcohol percentage inthe variable wineovera
periodof time.Itcan be seenthatthe refractive index (measuredin°Brix) isinverselyrelatedto
the alcohol percentage sowhenthe °Brix decreasesthe alcohol percentageincreases.
24. 24
6.5.0 Figure 7: Salinity in control wine vs. variable wine
6.6.0 Figure 8: pH in control wine vs. variable wine
R² = 0.4269
R² = 0.5848
0
200
400
600
800
1000
1200
9 11 13 15 17 19 21 23 25 27 29 31 33 35 37 39
Salinity(ppm)
Days since initiation
Salinity (control vs. variable wine)
Control
Variable
Poly. (Control)
Poly. (Variable)
R² = 0.6627
R² = 0.5813
3.1
3.2
3.3
3.4
3.5
3.6
3.7
3.8
3.9
4
9 11 13 15 17 19 21 23 25 27 29 31 33 35 37 39
pHvalue
Days since initiation
pH values (Control vs. variable wine)
Control
Variable
Poly. (Control)
Poly. (Variable)
The graph above showsthe salinityforthe variable andcontrol winesfromday9 to day39 of the
fermentingprocess,duringwhichthe variable winewasbeingaerated.The salinityneverreached
over1000ppm, so bothwinesare withinthe legal limit.
The graph above showsthe pH valuesforthe variable andcontrol winesfromday9 to day39 of the
fermentingprocess,duringwhichthe variable winewasbeingaerated.
26. 26
7.0 Discussion:
The hydrometerwasnotread properlyeverytime itwasusedsosome of the readingswere
recordedwrong,whichcausedthe resultstoappearveryout-of-patternsoa definite trendcouldnot
be concluded.Some of the readingswere recordedmuchtoohighsothe potential alcohol level
wouldhave beenexpectedtobe muchhigherthan itwas inrealitybutthe mistakeswere foundand
adjustmentstothe resultswere made towhatthe readingsactuallywere.There isapossibilityof
the adjustedreadingsnotbeing100%accurate and that wouldaffectthe displayof the resultsbut
not as severelyasthe initial mistakes.
The refractometerandmultiparameterweren’talwayscalibratedbefore usage sothe results
obtainedfromthose testsmaybe slightlyaffected becauseif theyweren’tresettoneutral
beforehandthensome residuefromaprevioustestmayalterthe results andthusthe relationships
betweendifferentresultsmaybe seendifferently. Also,the °Brix fromthe refractometerweren’t
adjustedaccordingtothe temperature eventhoughthe resultisbasedoff the assumptionthatthe
temperature was20°C. The refractive index istemperature-dependantsothe resultsthatwere
obtainedwouldhave beenslightlydifferentbecause the temperaturewasn’taccountedforbutnot
by a substantial amount.
Aftereachtime the wineswere racked,potassiummetabisulphite wasadded toboththe control
and variable wines.Potassiummetabisulphiteprovidesthe winewithasource of sulphurdioxide,
whichservesthe purpose tonotonlystopunwantedmicrobesfromgrowingbutalsotoprevent
oxidation.The purpose of the variablewine wastointroduce oxygentodetermine the effect
oxidationhasonwine comparedtothe control but the oxidationwouldhave beenhinderedbythe
addedsulphurdioxide sothe differencewouldbe lessdramaticthanplanned.Nexttime,the
potassiummetabisulphiteshouldonlybe addedtothe control wine andanotherformof
antimicrobial agentaddedthatdoesn’talsopreventoxidation.
As seeninfigures3and 4, as fermentationoccurredthe specificgravitydroppedbecause the sugar
was beingbrokendowntoproduce alcohol sothe densityof the waterdecreased. Towardsthe end
of the time period, the trend began toease off because the alcohol percentage was reachingits peak.
The difference betweenthe control andvariable hydrometerreadingsaren’tsignificantlydifferent
because the introductionof oxygendidn’taffectthe amountof sugarin the wine butcausedthe
percentage of alcohol tobe lowerdue tothe oxygeninhibitingthe yeastfromproducingethanol
fromthe glucose.Because oxygenwasmore abundant inthe variable wine,aerobicrespiration,
whichdoesn’tproduce ethanol,mayhave takenplace more thaninthe control wine andthusa
loweralcohol percentage wasproduced.
It can be vaguelyseeninfigures5and 6, that the refractive index (measured in°Brix) isinversely
relatedtothe alcohol percentage sowhenthe °Brix decreasesthe alcohol percentage increases.This
isbecause the maindissolvedsolidinwine issugarsothe higherthe refractive index the higherthe
sugar level andglucose (atype of sugar) producesalcohol infermentation.Sothe glucose breaks
downto produce ethanol,whichmakesthe °Brix dropandsimultaneouslythe alcohol percentage
increases.
27. 27
In figure 9,it can be seenthatthe percentage of alcohol forthe variable wine waslowerthanthatof
the control.Thismay be because inhighconcentrations,oxygencanbe toxicto yeastand yeastis
requiredinthe processof fermentationtoproduce ethanol.Thoughthe yeastwasstill producing
alcohol,itwasslightlyhinderedby the oxygenpresent.Also,the extraoxygenpresentmayhave
causedthe yeastto undergoaerobicfermentationmore oftenthanusual,whichdoesnotproduce
ethanol.Whereasinthe control wine; the lackof oxygenwould have resultedinmore anaerobic
respirationandthusmore ethanol.
Figure 8 showsthat the pH valuesforbothwinesweren’tdramaticallydifferentbutforthe majority
of the time,the variable wine’spHwashigherthanthe control’s.Thatis likelytobe because the
ethanol concentrationin the variable wine waslowerthanthatin the control so itwas lessacidic.
The titratable acidityshouldideallybe between6.5-8.5gbutthrougha titrationandcalculations,it
was determinedthatthe control wine contained6.22g/L. The legal limitfortotal sulphurdioxide
concentrationis250mg/L in a dry wine (<35g/L sugar) and 300mg/L ina sweetwine (>35g/Lsugar)
and the control wine hada calculated0.91g/L. The salinityneverreachedover1000ppm, so both
winesare withinthe legal limit.
It was expected that the alcohol concentration for the control wine would reach between 11.0-11.6%
because of the mass of sugar that wasaddedto the must. The wine actuallyreached14.0% at one
pointbutthendecreasedto13.7%, whichisstill more thanexpected.Thismayhave occurred
because the initial sugarcontent,measuredbythe hydrometer,washigherthanmeasured,which
wouldcause more ethanol tobe producedthanexpected.The sample of mustthatwastakento
readthe hydrometerinwasscoopedoff the topof the must bucketsothere may have beena higher
concentrationof sugarat the bottom.It wasexpectedthatthe alcohol concentrationforthe variable
wine wouldbe lowerthanthatof the control wine because the oxygenwouldinhibitthe
fermentation processandthiswascorrect.
In future investigations;the massof waterproducedshouldbe measuredtodeterminehow much
more aerobicfermentationisoccurringinthe oxidatedwine comparedtothe control wine because
wateronlyresultsinaerobicrespirationof yeastandnotanaerobic.Thiswouldthenjustifythe
loweralcohol percentage inthe variable wine.
28. 28
8.0 Conclusion:
A fruitwine,made fromstrawberries,pineappleandlycheeswasmade andvariousanalytical tests
were conducteduponitto compare it those made inindustry. The titratable aciditywasjustbelow
the ideal range forwine,the total massof sulphurdioxide wasoverthe legal limitandthe salinityfor
bothwineswasbelowthe legal maximum. Oxidationwaschosenasa variable andcarriedouton a
small quantityof the wine,while the majoritywasleftasthe control to compare the difference in
resultsthatthe variable caused. The resultsweren’tsubstantiallydifferent,whichisbelievedtobe
because potassiummetabisulphitewasaddedtothe variable wine,whichhelpstopreventoxidation
fromoccurring.The final alcohol concentrationrecordedforthe variable wine was13.3% andthe
control wine was13.7% sothere was a differenceof 0.4% alcohol. Oxidationdidn’tquantifiably
affectthe specificgravitybecause the levelof sugarinthe wine can’tbe alteredbyoxygenbut
oxygencancombine withglucose inaerobicrespirationinwhichethanolisnotproduced.Slight
differencesbetweenthe twowineswere noticedinthe pHvalues because the higherconcentration
of ethanol causedthe control wine tohave alowerpH throughoutthe majorityof the process.
It was expected that the alcohol concentration for the control wine would reach between 11.0-11.6%
because of the mass of sugar that wasaddedto the must. The wine actuallyreached14.0% at one
pointbutthendecreasedto13.7%, whichisstill more thanexpected. Thiswasconcludedtobe
because the sugarcontent,readoff the hydrometer,mayhave beenhigherthanmeasuredbecause
the sample wastakenfromthe surface of the must whenthe sugarcontentcouldhave beengreater
at the bottom,thuscausingmore ethanol tobe producedthanexpected. Itwasexpectedthatthe
alcohol concentrationforthe variable winewouldbe lowerthanthatof the control wine because
the oxygenwouldinhibitthe fermentationprocessandthiswascorrect.
29. 29
9.0 Appendices:
9.1 Reading a hydrometer:
Picture source:http://www.avogadro-lab-supply.com/content.php?content_id=2
Thispicture givesanexample of aspecificgravityreadingoff a hydrometer,whichshouldbe readatthe bottle
of the meniscusandat eye level.
30. 30
9.2 Sugar calculations:
9.2.1 Specific gravity correction table:
Picture source:(Hammond&McGraw, 2007)
9.2.2 Potential alcohol content table:
Picture source:(Hammond&McGraw, 2007)
The above photoshowsa table that givesthe requiredadjustmentsforthe specificgravity
readingbasedonthe temperature of the liquid.
The above photoshowsa table that isusedduringcalculatingthe massof sugar requiredtoreach the
desiredpotential alcoholcontent.Once the specificgravityisreadoff the hydrometerandnecessary
changesare made usingtable 8.2.1, the currentpotential alcohol contentcanbe foundincolumn3 and
the current massof sugar perlitre (ingrams) can be seenincolumn2 all in the same row.
31. 31
9.2.3 Our sugar calculations:
9.2.4 Continued sugar calculations:
The above photoshowsthe firsthalf of the calculationsrequiredtodetermine the massof sugar
that neededtobe addedtothe muston day2 to start the fermentationprocess.
The above photoshowsthe secondhalf of the calculationsrequiredtodetermine the massof sugar
that neededtobe addedtothe muston day2 to start the fermentationprocess.
32. 32
9.3.0 Calibrating refractometer scale:
Pictures’ source:http://www.grapestompers.com/refractometer_use.aspx
9.3.1 Refractometer scale example:
Pictures’source: http://www.grapestompers.com/refractometer_use.aspx
The picture above showsthe scale ina refractometer,displaying°Brix,while it’sbeingcalibratedwith
pure water.
The picture above showsan example of ascale ina refractometer, displaying°Brix,while afew drops
of an unknownliquidisplaced onthe prism.
33. 33
9.3.3 Labelled refractometer diagram:
Picture source:http://www.intercononline.com/jokisch/RHB-32-refractometer.htm
9.4 Free sulphur dioxide quantities:
Picture source:(Smith,Monteath,Gould,&Smith,2009)
The picture above showsa labeledrefractometerdiagram;includingall partsreferredtoinmethod4.4.1.
The photo above showsatable that suggestsa guideline forthe quantityof free sulphurdioxide that
shouldbe containedinwhite winedependantonitspH.
34. 34
9.5.0 Titration calculations- Total mass of sulphur dioxide:
The photo above showsthe calculationsof the massof sulphurdioxide inthe control wine.These
calculationsusedthe average titre value fromthe titration(see method5.6).
35. 35
9.5.1 Titration calculations- Titratable acid:
The photo above showsthe calculationsof the total acidityinthe control wine,assumingthatall the
acid istartaric. These calculationsusedthe average titre value fromthe titration(see method5.5).
36. 36
9.5.2 Titration calculations- Concentration of alcohol:
The photosabove showsthe calculationsof alcohol concentrationinthe control wine.These calculations
usedthe average titre value fromthe titration(see method5.7).
38. 38
9.7.0 Aerating the variable wine- aerating machine
9.7.1 Aerating the variable wine- muslin lid
The above photoshowsthe aeratingmachine usedtointroduce oxygenintothe variablewine.
The above photoshowsthe muslinthatwas tiedaroundthe neckof the variable wine toallow
oxygenentry,insteadof usingagastrap.
39. 39
9.8.0 Adding sugar to the must:
9.8.1 Adding starter bottle to the must:
The above photoshowsthe starter bottle beingaddedtothe must.
The above photoshowsthe sugar beingaddedtothe must afterthe calculationswere done.
40. 40
9.9.0 Industrial gas trap:
9.9.1 Balloon gas trap:
The above photoshowsballoonsthatwere usedtostopthe entrance of oxygenbut
capture carbon dioxide thatthe yeastproducedduringfermentation.
The above photoshowsa gas trap that was usedto stopthe entrance of oxygenbut
capture carbon dioxide thatthe yeastproducedduringfermentation.
41. 41
9.9.2 Degrees to alcohol percentage conversion wheel:
Picture source:http://www.dwinesupplies.com/dws/itemDetails.asp?sn=&pid=2228
The above photoshowsa wheel thatconvertsthe difference inboilingpointsof the wine
and waterto the alcohol percentage whenspuncorrectly.
42. 42
10.0 Bibliography
Australiangovernment.(2012,October11). Wine Production Requirements.RetrievedAugust24,
2013, fromAustralianGovernmentComLaw:http://www.comlaw.gov.au/Details/F2012C00776
Deeds,S.(2013, March 13). Yeast Propogation with AerobicRespiration.RetrievedAugust19,2013,
fromWoodlandBrewingCompany:http://woodlandbrew.blogspot.com.au/2013/03/yeast-
propogation-with-aerobic.html
Dharmadhikari,M.(2010). Wine Aeration and ItsAdverseEffects.RetrievedAugust2,2013, from
Iowastate universityextensionandoutreach:http://www.extension.iastate.edu/wine/aeration
Gladish,S.(1999). TakeControlof MustTemperature--And Reap theBenefits.RetrievedAugust22,
2013, fromWineMaker:http://www.winemakermag.com/stories/techniques/article/indices/19-
fermentation/653-take-control-of-must-temperature-and-reap-the-benefits
Hammond,M., & McGraw, J. (2007). FruitWine EEI Resources.1-2.
Jacobs,J. (2007, September4). Ethanolfermentation.RetrievedAugust20,2013, fromWikipedia:
http://en.wikipedia.org/wiki/Ethanol_fermentation
JamesA Kennedy,M.A.(2002). Effect of Maturity and VineWater Statuson Grape Skin and Wine
Flavonoids.RetrievedJuly10,2013, fromAmericanjournal of enologyandviticulture:
http://www.ajevonline.org/content/53/4/268.abstract
Kearney,C.,& Bogolawski,M.(n.d.). Winemakingand theimportanceof pHtesting.Retrieved
August20, 2013, from HANNA Instruments:
http://www.hannainst.com/usa/whitepaper/Winemaking%20and%20pH.pdf
Megazyme InternationalIreland.(2012). TARTARICACID.RetrievedAugust23,2013, from
Megazyme:http://secure.megazyme.com/files/BOOKLET/K-TART_1209_DATA.pdf
Plant,C.(2001). The Use of SulphurDioxide(SO2) in winemaking.RetrievedJuly12,2013, from
BCAWA:http://www.bcawa.ca/winemaking/so2use.htm
Ribereau-Gyon,P.(2000). Handbookof Enology:Vol2:The Chemistry of Winemaking.
Robinson,J.,&Jackson,S. (2011, March 4). Fermentation in winemaking.RetrievedAugust23,2013,
fromWikipedia:http://en.wikipedia.org/wiki/Fermentation_in_winemaking#cite_note-
Oxford_pg_268-9
Smith,D.,Gould,M., Monteath,S.,& Smith,R.(2009). Chemistry in Use,teacherguide. Sydney:
McGraw-Hill Australia.
Smith,D.,Monteath,S.,Gould,M., & Smith,R.(2009). Chemistry in UseBOOK2. Sydney:McGraw-
Hill Australia.
Zoecklein,B.(2003, March 5). Series of noteson sulfur-containing compoundsin wine.Retrieved
August20, 2013, from Enologynotes:http://nanaimowinemakers.org/Steps/H2S_Issues.htm