Download to read offline


![x Process Discovery Best Practices: Using IBM Blueworks Live
Figure 1 APQC PCF levels explained
History
The cross-industry Process Classification Framework was originally envisioned as a
taxonomy of business processes and a common language through which APQC member
organizations can benchmark their processes. The initial design involved APQC and more
than 80 organizations with a strong interest in advancing the use of benchmarking in the
United States and worldwide. Since its inception in 1992, the most of the PCF content was
updated. These updates keep the framework current with the ways that organizations do
business around the world. In 2008, APQC and IBM worked together to enhance the
cross-industry PCF and to develop a number of industry-specific process classification
frameworks (APQC Process Classification Framework [PCF] - Cross Industry - PDF Version
6.0.0).
For more information about APQC's PCF, see this website:
http://www.apqc.org/knowledge-base/documents/apqc-process-classification-framework
-pcf-cross-industry-pdf-version-600
Authors
This paper was produced by a team of specialists from around the world working at the
International Technical Support Organization, Austin Center.
Joshua King is the Release Manager for IBM Blueworks Live. He was an IBM BPM Program
Manager responsible for implementing process improvement initiatives at multiple clients
around the world. He spent the last 10 years of his career working in process improvement,
inclusive of software development processes and agile methods, such as Scrum. He is an
expert in BPMN and especially the use of the Blueworks Live product. Joshua coached
internal IBM and external customers on adoption of Blueworks Live and IBM BPM, run
customer facing workshops, and is a Lab Advocate for Blueworks Live and IBM BPM
products.](https://image.slidesharecdn.com/bwlredbook-160205134000/75/Bwl-red-book-12-2048.jpg)


![100 Process Discovery Best Practices: Using IBM Blueworks Live
10.1 User stories
Envisioning the implementation of a process application that is based on the IBM Blueworks
Live model, the IBM BPM Analyst captures business requirements for the process.
How requirements are captured depends on the standard that is defined by the organization.
The two most common approaches are the Plan-Driven (waterfall) and the Change-Driven
(agile) approach. Waterfall approaches often use something like a Business Requirements
Document (BRD) to document functionality. The Blueworks Live best practice and
methodology follows the Change-Driven (agile) approach. If a BRD is used, it can eventually
be broken down into User Stories while the agile methodology uses User Stories from the
beginning.
User Stories have the following structure:
As [a person or role] I need to [perform some function] so that I can [some
benefit is achieved].
This helps the developer to implement a requirement properly because the who, what, and,
most importantly, why are clearly defined. The “why” is important because the developer now
can begin to understand fully how the user expects to use this feature. This helps ensure that
the solution developed is what is needed.
For example, the Submit Candidate activity in the Call Center Representative onboarding
process can be expressed as the following User Story:
As a recruiter I need to find/screen/identify a candidate so that I can submit a
hirable candidate to the open requisition.
The IBM BPM Developer now knows that this task must be routed to the Recruiter and that
they need to provide a functionality to search and find a candidate. The recruiter specified the
“what” of the function, but it is up to the IBM BPM Developer to figure out the “how”. Only they
know which controls and patterns are suited the best.
Eventually, all business requirements are consolidated and prioritized based on the business
value they provide and the implementation complexity they have. As a result, the iteration and
release backlog can be created.
In an IBM Blueworks Live model, every activity should have at least one User Story that is
associated to it.
As you can see in Figure 10-1 on page 101, most of the time, the IBM BPM Analyst
documents the user stories in the Documentation tab of the IBM Blueworks Live activity.](https://image.slidesharecdn.com/bwlredbook-160205134000/75/Bwl-red-book-114-2048.jpg)


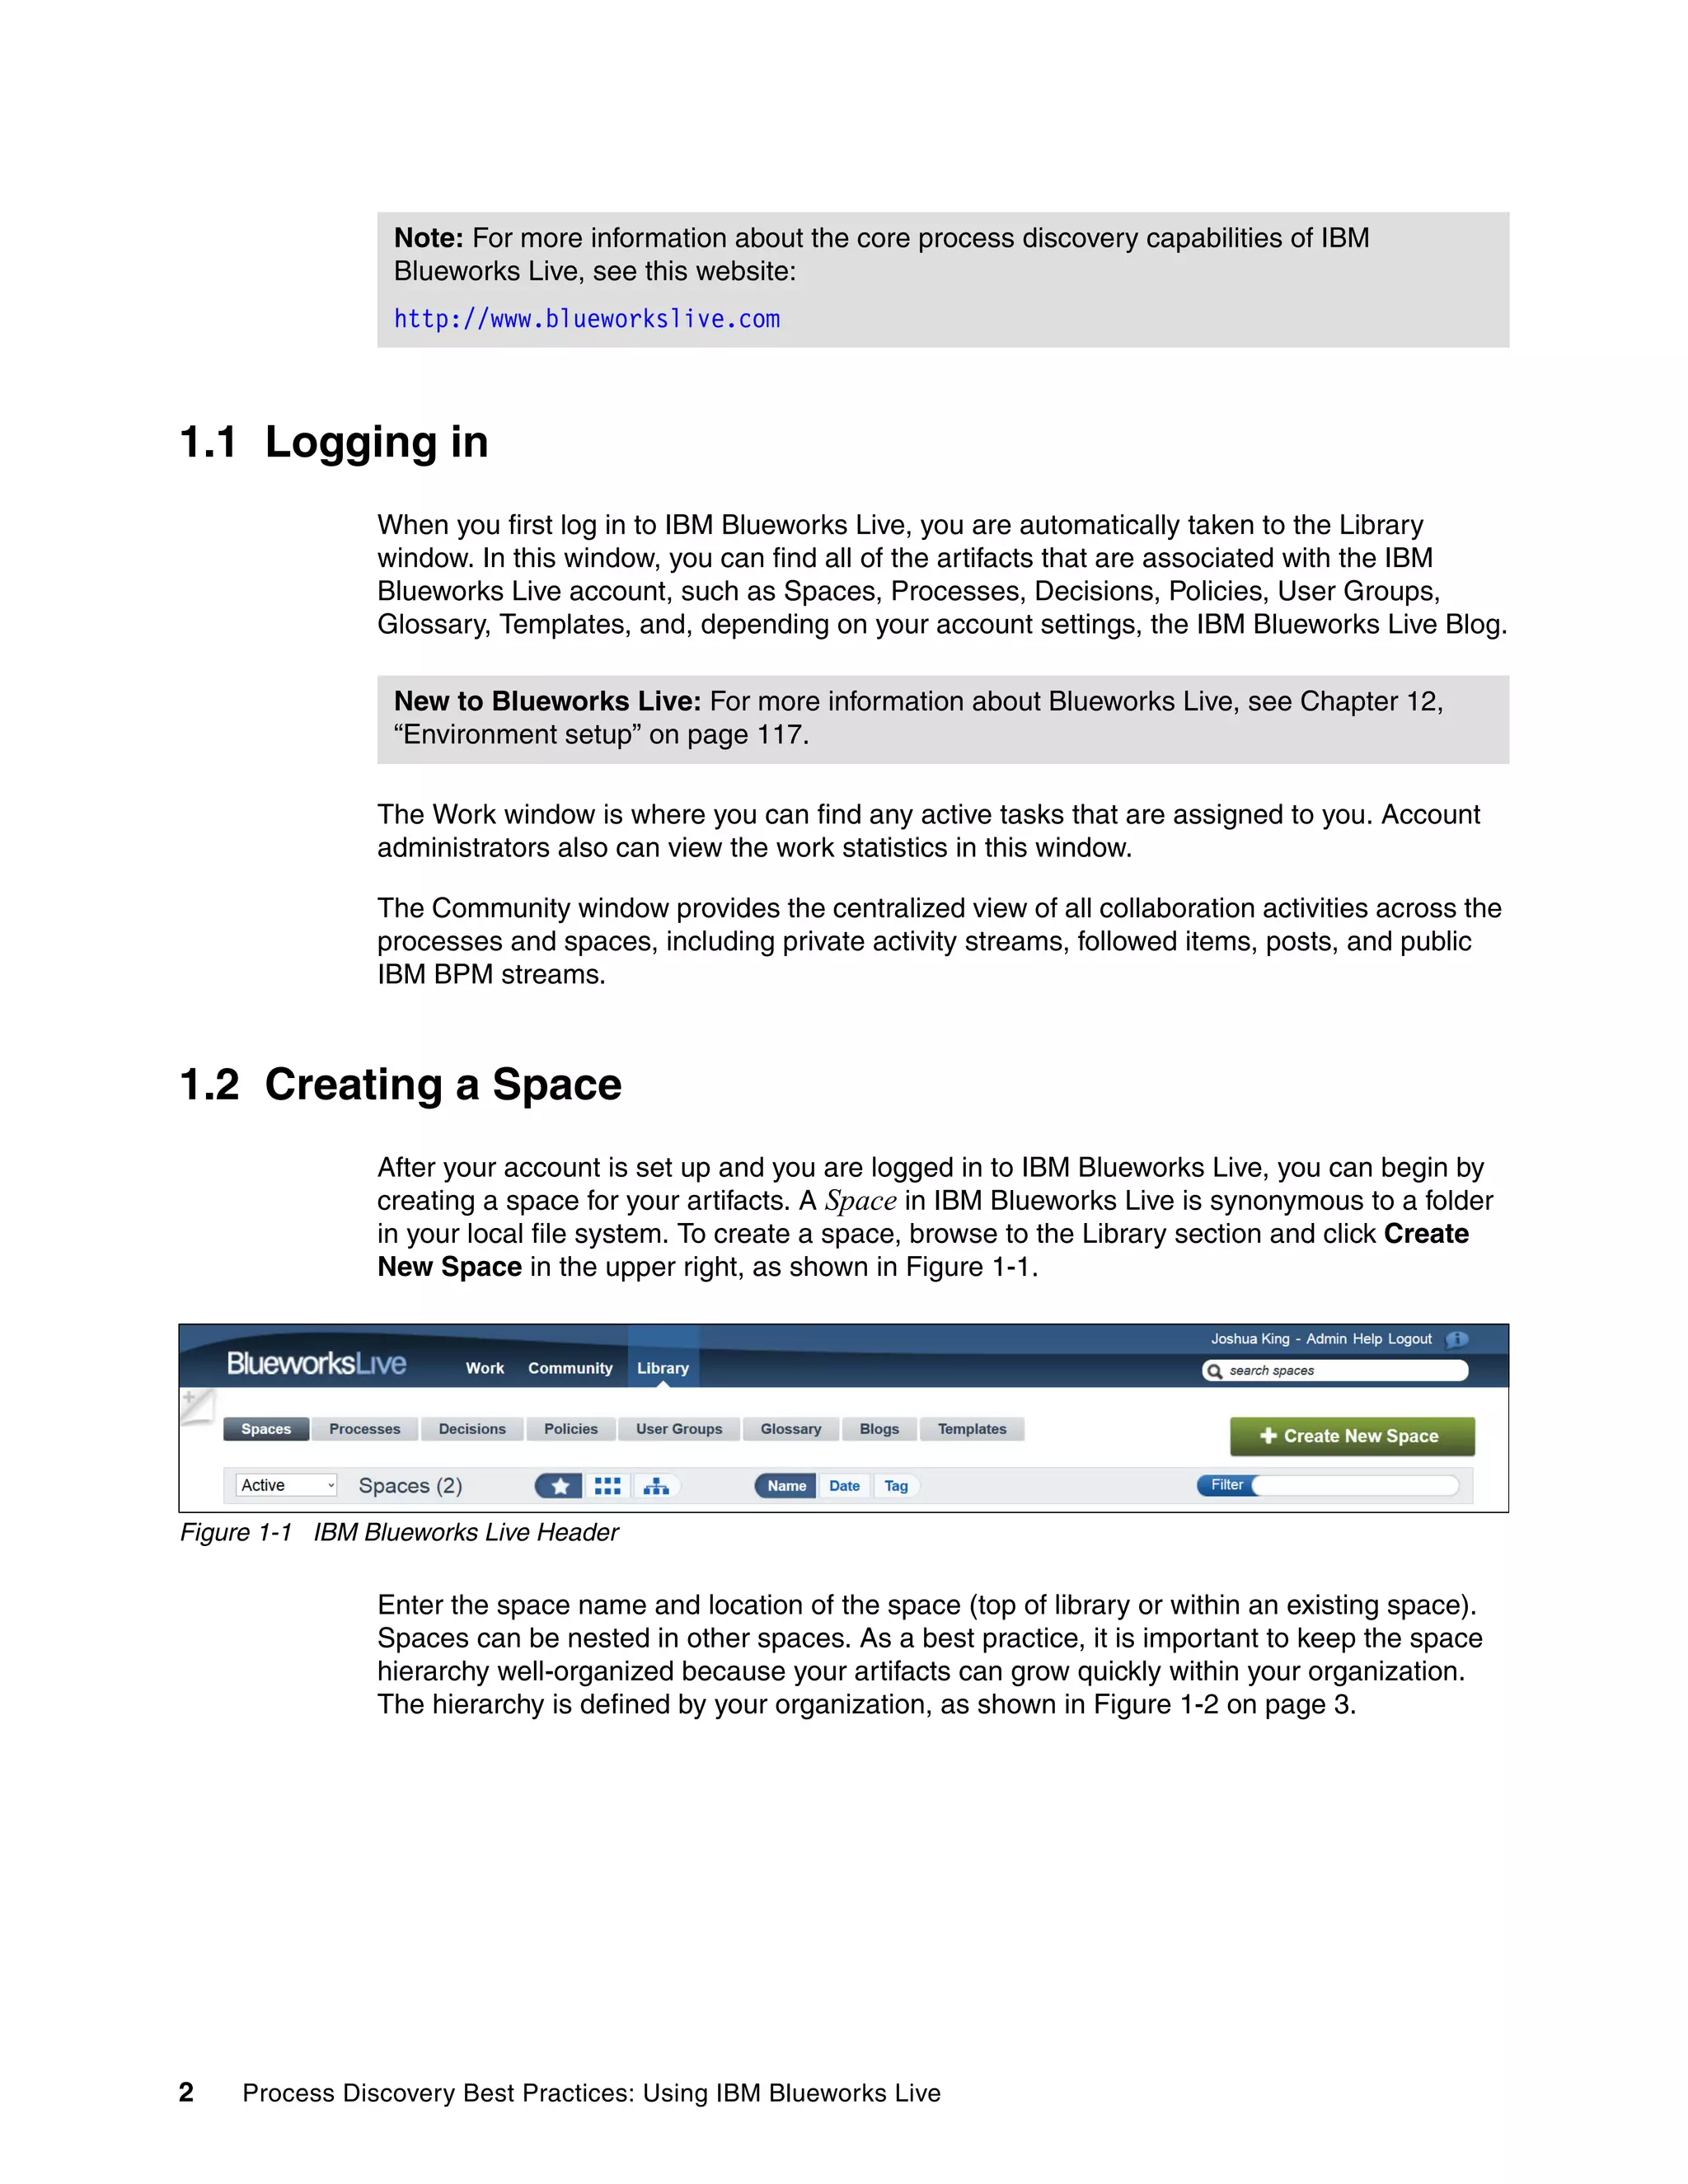
This document provides best practices for using IBM Blueworks Live to conduct process discovery. It discusses starting a process discovery project in Blueworks Live, creating a "Discovery Map" to identify milestones and activities, developing a process diagram using BPMN notation, and using the "Analyze Mode" feature to analyze bottlenecks and opportunities for improvement. The overall goal is to uncover an as-is view of key business processes in order to identify areas that could benefit from process optimization or automation.