2. C. Lerdluksamee et al. / Carbohydrate Polymers 97 (2013) 482–488 483
et al., 1998; Kilani et al., 2005). Several investigators have reported
its potential in antibacterial, antioxidant, cytotoxic and apoptotic
activities (Ardestani & Yazdanparast, 2007; Kilani et al., 2008).
In the Cyperaceae family, S. grossus which is found extensively
in South East Asia has not yet been investigated for its potential
application. Though, local people extract its tuberous flour and use
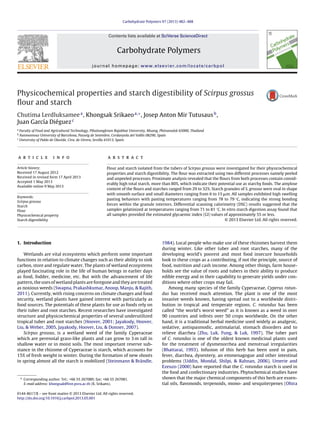
as foods. The yields are considerably high due to the large size of
the tubers when compared to other species in the family (Fig. 1).
This study investigated the physicochemical properties and starch
digestibility of S. grossus flour and starch isolated from the tubers
in order to find the potential as functional food source.
2. Materials and methods
2.1. Materials
S. grossus tubers were purchased from local markets in Phitsan-
ulok Province, Thailand during winter of 2011.
2.2. Flour preparation
The tubers were brushed in tap water to remove adhering
dirt. Flour was prepared by two different methods (peeled and
unpeeled). These two processes represent the methods used by
local people and industry. The peeled and unpeeled tubers (wet
forms) were ground using a mortar. Distilled water was added at
the ratio of 1:3 (sample:water) and the samples were ground using
a blender until fine particles were obtained. The ground samples
were sieved through a 100-mesh screen and rewashed with water
for three times. The extracted flour was dried at 50 ◦C until the mois-
ture content reached 10–13%. Notably that drying at 50 ◦C in this
study cannot anneal starches in the samples as the water content is
not sufficient, only excess water (more than 60%, w/w) can induce
annealing process (Tester & Debon, 2000). The samples were sieved
through a 100-mesh screen.
2.3. Starch extraction
Starch was isolated from the flour (unpeeled samples) using
the alkaline extraction method (Lee, Htoon, & Paterson, 2007). The
flour was dispersed in water (1:10, w/w) and pH was adjusted to 9
by adding 0.1 M NaOH, and then stored at 30 ◦C for 2 h. The slurry
was filtered through a 100-mesh sieve. The filtrate was centrifuged
at 3000 × g for 30 min. After centrifugation, the supernatant was
discarded and the yellow layer (fat) was manually scraped off.
The sediment or starch portion was washed with 0.01% sodium
metabisulfite. Subsequently, it was washed three times with water
and centrifuged at 3000 × g for 15 min. The starch portion was fil-
tered again through a 100-mesh sieve and dried in a hot-air oven at
50 ◦C for 16 h. The dried starch samples were ground using a ham-
mer mill fitted with a 0.5-mm sieve and sifted through 100 mesh
sieve.
2.4. Physicochemical properties
2.4.1. Proximate analysis, total starch and amylose content
Proximate analysis was determined using standard AOAC meth-
ods (AOAC, 2000). Total starch was determined enzymatically
using the total starch assay kit (Megazyme International, Ireland)
following the standard AOAC Method 996.11. About 100 mg of
sample was wetted with ethanol, mixed in KOH and sodium
acetate buffer (pH 3.8). The samples were digested with thermo-
stable ␣-amylase and amyloglucosidase and incubated at 50 ◦C
for 30 min. The glucose released was determined using an enzy-
matic glucose reagent (GOPOD method), and the absorbance of the
coloration was measured spectrophotometrically at 510 nm. For
amylose, it was determined by colorimetric measurement of the
blue amylose–iodine complex (Juliano, 1971). The samples were
analyzed in triplicate.
2.4.2. Scanning electron microscope (SEM)
Dried samples were dispersed on double-stick adhesive tapes
mounted on SEM aluminum stubs, coated with a thin layer of gold
in a vacuum evaporator (EMITEX K 550X), and examined with the
SEM (Phillips XL30) at 1000–1500 magnifications.
2.4.3. Swelling power and solubility
The solubility and swelling power were obtained using the
method from Schoch (1964) with slight modifications. Samples
(0.5 g) were dispersed in 15 mL distilled water. The suspensions
were heated to 55, 65, 75, 85 ◦C in a water-bath with periodic
mixing over a 30 min period. The cooked paste samples were cen-
trifuged at 2200 rpm for 15 min. The supernatants were taken and
placed in pre-weighed aluminum can before drying at 105 ◦C to
gain constant weight. The dried supernatants were weighed as soon
as the samples reached room temperature. After the supernatants
were removed the swollen sediment samples were weighed. The
solubility and swelling power were then calculated using Eqs. (1)
and (2):
Solubility (%) =
Weight of soluble matter in supernatant (g)
Weight of sample (g dry basis)
× 100
(1)
Swelling power (%)
=
Weight of swollen matter (g)
Weight of sample (g dry basis) × (100 − solubility)
× 100 (2)
2.4.4. Pasting properties by Rapid Visco-Analyser (RVA)
Pasting properties were investigated using the Rapid Visco-
Analyser (RVA-4D, Newport Scientific Pvt. Ltd., Australia) following
the approved method 61.02 (AACC, 2009). A 13-min RVA profile was
used with 3.0 g ground samples (adjusted to 14% moisture content)
in 25 mL distilled water. The RVA ThermoclineTM software (ver. 2.6)
was used to obtain the RVA profiles and pasting characteristics.
Each sample was analyzed in triplicate.
2.4.5. Differential scanning calorimetry (DSC)
Distilled water was added into the dried samples at the ratio of
3:1 (w/w). The DSC (Mettler Toledo DSC 1) equipped with a refrig-
erated cooler was used. The hydrated samples (20 ± 5 mg) were
weighed into the aluminum DSC pans and hermetically sealed. An
empty pan was used as the reference, and DSC analysis was done
by scanning from 30 to 120 ◦C, ramping at 10 ◦C/min. Nitrogen was
used as a purged gas. The resulting thermograms were analyzed
using Mettler Toledo Stare software (ver. 9.20) for the onset temper-
ature (To), peak temperature (Tp), conclusion temperature (Tc) and
transition enthalpy ( H). Each sample was analyzed in triplicate.
2.5. In vitro starch digestibility and modeling of starch
digestogram
Time-course starch digestion in the samples was determined
using a rapid in vitro digestibility assay based on glucometry
(Mahasukhonthachat, Sopade, & Gidley, 2010; Sopade & Gidley,
2009). About 0.5 g of ground sample was treated with artificial
saliva containing porcine ␣-amylase (Sigma A-3176 Type VI-B)
before pepsin (Sigma P-6887; pH 2.0) was added and incubated at
37 ◦C for 30 min in a reciprocating water bath (85 rpm). The digesta
was neutralized with NaOH before adjusting the pH to 6 (sodium
3. 484 C. Lerdluksamee et al. / Carbohydrate Polymers 97 (2013) 482–488
Fig. 1. Appearances of S. grossus (dried stems and leaves) and their tubers.
acetate buffer) prior to the addition of pancreatin (Sigma P1750)
and AMG (Sigma A-7420). The mixture was incubated for 4 h, dur-
ing which the glucose concentration in the digesta was measured
with an Accu-Check® Performa® glucometer at specific periods (0,
10, 20, 30, 45, 60, 90, 120, 150, 180, 210 and 240 min). Digested
starch per 100 g dry starch (DS) was calculated as in Eq. (3):
DS =
0.9 × GG × 180 × V
W × S[100 − M]
(3)
where GG = glucometer reading (mM/L), V = volume of digesta
(mL), 180 = molecular weight of glucose, W = weight of sample (g),
S = starch content of sample (g/100 g sample), M = moisture content
of a sample (g/100 g sample), and 0.9 = stoichiometric constant for
starch from glucose contents.
The digestogram (digested starch at a specific time period) of
each sample was modeled using a modified first-order kinetic
model, Eq. (4), as described before (Mahasukhonthachat et al.,
2010):
Dt = D0 + D∞−0(1 − exp[−Kt]) (4)
where Dt (g/100 g dry starch) is the digested starch at time t, D0 is
the digested starch at time t = 0, D∞ is the digestion at infinite time
(D0 + D∞−0), and K is the rate constant (min−1).
The Microsoft Excel Solver® was used to compute the parame-
ters of the model by minimizing the sum of squares of residuals
(SUMSQ) and constraining D∞ ≤ 100 g per 100 g dry starch, and
D0 ≥ 0 g per 100 g dry starch. In addition to the coefficient of deter-
mination (r2), the predictive ability of the models was assessed
with the mean relative deviation modulus (MRDM) as described
elsewhere (Mahasukhonthachat et al., 2010).
In order to calculate the estimated glycaemic indices (GIs) of
the samples, the areas under the digestograms (AUCexp) were com-
puted with Eq. (5):
AUCexp = D∞t +
D∞−0
K
exp(−Kt)
t2
t1
(5)
The hydrolysis index (HI) of each sample was calculated by
dividing the area under its digestogram by the area under the
digestogram of a fresh white bread, which was calculated to be
about 13,000 min g/100 g dry starch from 0 to 240 min (Yong, Chan,
Garcia, & Sopade, 2010). Single-point measurement of starch diges-
tion at 90 min in the samples was also used to calculate GI (H90).
Hence, using the parameters of the modified first-order kinetic
model for both the samples and fresh white bread, GIs of the
samples were also calculated, and the average GI (GIAVG) for each
sample (Goni, Garcia-Alonso, & Saura-Calixto, 1997) was defined as
Eq. (6):
GIAVG =
((39.21 + 0.803H90) + (39.51 + 0.573 HI))
2
(6)
2.6. Statistical analysis
Analysis of variance (ANOVA) and test of significance were per-
formed using SPSS® ver. 16 with confidence level of 95%. The
samples were randomized for all the analyses described above.
3. Results and discussions
3.1. Physicochemical properties
3.1.1. Proximate analysis, total starch and amylose content
Proximate analysis, total starch and amylose content are shown
in Table 1. S. grossus flours (both peeled and unpeeled samples) con-
tain considerably high total starch content, more than 80%, which
indicate their potential as carbohydrate foods. Notably that total
starch from peeled-process flour is as high as total starch from
isolated starch sample. Hoover (2001) reviewed the published liter-
atures and found that starch yield of many tuber and root starches
ranged from 30 to 88%. It is highlighted here again that S. grossus
contain high starch yield as compared to other tuber and root
starchy plants.
Amylose content of starch from S. grossus ranged from 29 to 32%
and processing methods affected the amylose content. Peeled pro-
cess provided the flour with high amylose content as this process
had less contaminants.
3.1.2. SEM
SEM images of the flour samples showing starch granules
attached with other components e.g. protein (smaller sizes) are
shown in Fig. 2. The granules were found to be oval in shape with
smooth surface similar to potato starches. The diameter of starch
granules ranged from 6 to 15 m which is considered to be small
when compared to other starch types e.g. potato (10–65 m) (Yuan,
Zhang, Dal, & Yu, 2007). Morphological characteristics of starches
from different plant sources vary with the genotype. The variation
in the size and shape of starch granules is attributed to the bio-
logical origin (Svegmark & Hermansson, 1993). Physicochemical
properties, such as percent light transmittance, amylose content,
swelling power and water-binding capacity were significantly cor-
related with the average granule size of the starches separated from
different plant sources (Singh, Singh, Kaur, Sodhi, & Gill, 2003; Zhou,
Robards, Glennie-Holmes, & Helliwell 1998). The smaller granule
sizes have been found to improve the digestibility because smaller
granules have a greater surface area and are more rapidly digested
by enzymes (Cone & Wolters, 1990; Franco, Preto, & Ciacco, 1992;
Riley, 2004).
Apart from morphological properties, molecular structure of
starches as obtained by size exclusion chromatography and/or
fluorophore-assisted capillary electrophoresis is suggested.
3.1.3. Swelling power and solubility
Swelling power and solubility of the samples are shown in Fig. 3.
The solubility is contributed by the content of amylose, and the
4. C. Lerdluksamee et al. / Carbohydrate Polymers 97 (2013) 482–488 485
Table 1
Total starch, amylose and proximate analysis of the samples (g/100 g dry sample).
Samples Total starch Amylose Protein Fat Crude fiber Ash
Starch 87.69 ± 0.77a
32.33 ± 0.58a
0.17 ± 0.02c
0.06 ± 0.01b
0.08 ± 0.01c
0.09 ± 0.00c
Flour-peeled 87.37 ± 2.28a
30.44 ± 0.51b
0.32 ± 0.01b
0.12 ± 0.01a
1.43 ± 0.18b
0.34 ± 0.09b
Flour-unpeeled 80.43 ± 1.29b
29.49 ± 0.50b
0.36 ± 0.01a
0.10 ± 0.05ab
2.44 ± 0.18a
0.48 ± 0.03a
Values are means ± standard deviations. For each parameter (column), values with the same letters are not significantly different (P > 0.05).
Fig. 2. SEM images of S. grossus flours, (a) unpeeled and (b) peeled sample.
swelling power is contributed by the content of amylopectin (Tester
& Morrison, 1990). The swelling power of all samples increased as
the incubation temperature increased from 55 to 85 ◦C. As been
known, starch could not be dissolved in cool water attributed to the
starch crystal structure. However, when starch was heated in excess
water, the crystalline structure was disrupted and water molecules
became linked by hydrogen bonding to exposed hydrogen group
of amylose and amylopectin. Then the amylose and amylopectin
were dissociated in suspension, and the solubility of starch was
increased (Yuan et al., 2007). From Fig. 3, S. grossus (both in the
forms of flour and starch) swelled quickly from 65 to 75 ◦C, and
they had dissolved well when temperature increased from 65 to
75 ◦C. From this study, the swelling power and solubility patterns
of S. grossus flour and starch samples were found to be similar to
those of other tuber starches. Yuan et al. (2007) reported that, as
temperatures increased from 55 to 85 ◦C, swelling power of potato
starch increased from 8 to 68% while solubility increased from 3
to 35%. Thus, the results from this paper indicated that the granule
structure of S. grossus starch has single-step swelling process which
is similar to potato and tapioca starches and this is different from
cereal starches. Generally, cereal starches have two-step swelling
process. The first stage of swelling (45–55 ◦C) occurs when heating
starch from 55 to 60 ◦C and dissociation of amylopectin double-
helices is exhibited. This makes amylopectin swells in highly extent,
while the starch granules still exist through intermolecular (might
be hydrogen) bonding. From this evidence, amylopectin would
promote starch swelling, especially at the early stage of swelling.
Amylose would leach out during heating process particularly at the
higher temperature (the later stage of swelling).
Comparing among all studied samples, the flour (unpeeled pro-
cess) exhibited the lowest swelling power and solubility. This could
be influenced by a strong interaction between the yarn fibers and
starches (Umerie & Ezeuzo, 2000).
3.1.4. Pasting properties by RVA
Table 2 shows the pasting properties of S. grossus flour and
starch samples. All the samples exhibited high pasting temper-
atures and thermal stability as indicated by breakdown values.
Notably that the pasting temperatures of all samples ranged from
78 to 79 ◦C which were high when compared to other tuber and
root starches as summarized by Hoover (2001). This suggests the
strong bonding forces within the granule interiors. In addition,
with its high in peak viscosity and final viscosity, it can be said
to have high water biding capacity. Similar pasting pattern was
found in another root starch, edible canna (Piyachomkwan et al.,
2002; Srikaeo, Mingyai, & Sopade, 2011; Thitipraphunkul, Uttapap,
Piyachomkwan, & Takeda, 2003; Watcharatewinkul, Puttanlek,
Rungsardthong, & Uttapap 2009; Yanika, Chureerat, & Vilai, 2009).
Generally, starches with high viscosity are desirable for industrial
uses, for which a high thickening power at high temperature can be
obtained (Kim, Wiesnborg, Orr, & Gant, 1995). However, it should
be noted that S. grossus starch showed considerably high setback
Fig. 3. Swelling power and solubility of S. grossus starch.
5. 486 C. Lerdluksamee et al. / Carbohydrate Polymers 97 (2013) 482–488
Table 2
RVA parameters of the samples.
Samples Peak temperature
(◦
C)
Peak viscosity
(RVU)
Trough
viscosity (RVU)
Breakdown
viscosity (RVU)
Final viscosity
(RVU)
Setback viscosity
(RVU)
Starch 78.33 ± 0.22b
285.8 ± 0.25b
207.4 ± 0.35a
78.70 ± 0.99c
280.4 ± 0.21a
73.02 ± 0.56b
Flour-peeled 78.37 ± 0.15b
293.6 ± 0.52a
173.5 ± 0.47c
120.1 ± 0.17a
249.6 ± 0.38c
76.06 ± 0.57a
Flour-unpeeled 79.14 ± 0.05a
262.7 ± 0.31c
180.5 ± 0.48b
82.53 ± 0.71b
254.5 ± 0.02b
74.02 ± 0.52b
Values are means ± standard deviations. For each parameter (column), values with the same letters are not significantly different (P > 0.05).
values. This indicated that it provided a cohesive paste. It is less
stable during cooling and retrograded more (Karim, Norziah, &
Seow, 2000). Thus, the pasting properties showed that starch from
S. grossus was not suitable for products in which stability is required
at low temperatures e.g. fillings and refrigerated products.
3.1.5. DSC
DSC results suggested that S. grossus flour and starch samples
gelatinized at the temperatures ranging from 71 to 81 ◦C (Table 3).
Onset temperatures of the samples were found to be slightly higher
than those found in most tuber and root starches (Bernabé, Srikaeo,
& Schlüter, 2011; Hoover, 2001; Jane et al., 1992; Pérez & Lares,
2005; Srikaeo et al., 2011). This result seems to support the find-
ings from RVA, though DSC and RVA measure different properties
of starch in excess water. It could be summarized in this study that
S. grossus flour and starch are high in thermal stability and gela-
tinized at high temperatures when compared to other tuber and
root starches. Gelatinization temperatures of the starchy samples
can vary due to factors that include genetic origin, environmental
conditions and age of the parent plant (Mota, Lajolo, Cordenunsi,
& Ciacco, 2000; Hung & Morita, 2005; Jane et al., 1999; Moorthy,
2002). High-amylose starches with longer average chain have been
reported to exhibit higher transition temperatures (Jane et al.,
1992).
3.2. In vitro starch digestibility and modeling of starch
digestogram
Fig. 4 shows the starch digestogram while Table 4 shows the
digestion data of the samples. It was found that the modified first-
order kinetic model, was suitable (r2 = 0.95–0.99; MRDM = 1–14%;
SUMSQ = 5–87) in describing the digestograms. Generally, all sam-
ples provided the average GI values for about 55 or less which
indicate that most of them are low in GI. It is widely recognized
that low GI foods are valuable for use in controlled glucose release
applications and in lowering insulin response, and greater access
to the use of stored fat is expected (Nugent, 2005; Sajilata, Singhal,
& Kulkarni, 2006). This is important for diabetes and its dietary
management. The present study showed that native S. grossus flour
and starch can have the potential of being used as functional food
ingredients for low GI foods. This appears to support the conclu-
sions of Moorthy (2002) and Srikaeo et al. (2011) that some tropical
tuber and root crop starches have the potential to be used in low GI
foods. Comparing among all samples, S. grossus starch has higher
Fig. 4. Digestograms of S. grossus starch and flours.
digestion rate than those of the flours. However, the starch sample
contains more amylose than the flour samples. Amylose content
was reported to have an obvious impact on GI values. Slow digestion
rate and consequently low GI values were expected with increased
amylose content as studied in rice (Hu, Zhao, Duan, Linlin, & Wu,
2004). In this study, the starch sample which contained higher
amylose gave higher digestion rate than those observed from the
flour samples. Starch digestion rate and the GI of foods depends
upon various factors such as starch granule morphology, amylose
to amylopectin ratio, molecular structure, degree of branching in
terms of steric hindrance, and consequently mass transfer resis-
tance (Fuentes-Zaragoza, Riquelme-Navarrete, Sanchez-Zapata, &
Perez-Alvarez, 2010; Singh, Dartois, & Kaur, 2010). The other com-
ponents in the flour samples of S. grossus could also have the impact
on digestion rate.
It should be noted that the digestion data in this study were
based on the raw starch and flour samples. They can be different
for cooked flour and starch. Generally, in the absence of retrogra-
dation or structural changes, starch gelatinization enhances starch
digestibility. Therefore, cooked samples could exhibit higher GI
values than raw samples. Moreover, the results were also based
on in vitro starch digestion assay. It is valid for comparison and
useful for preliminary study of starch digestibility. Real digestion
data and GI can be obtained by the in vivo assay. Further study is
recommended.
Table 3
DSC parameters of the samples.
Samples To (◦
C) Tp (◦
C) Tc (◦
C) H (J/g dry sample)
Starch 73.34 ± 1.03a
75.48 ± 0.21a
81.14 ± 0.14a
16.48 ± 0.28a
Flour-peeled 70.74 ± 0.25b
73.23 ± 0.25c
77.51 ± 0.10c
12.74 ± 0.14b
Flour-unpeeled 70.95 ± 0.07b
73.79 ± 0.08b
78.85 ± 0.13b
16.58 ± 0.76a
Values are means ± standard deviations. For each parameter (column), values with the same letters are not significantly different (P > 0.05).
6. C. Lerdluksamee et al. / Carbohydrate Polymers 97 (2013) 482–488 487
Table 4
Model parameters, hydrolysis index (HI) and glycaemic index (GI) of the samples.
Samples D0 (g/100 g dry starch) K × 10−3
(min−1
) GIH90 GIHI Average GI
Starch 4.13 ± 0.91b
2.20 ± 0.53a
56.4 ± 0.29a
54.4 ± 0.15a
55.4 ± 0.23a
Flour-peeled 5.44 ± 0.21ab
1.13 ± 0.01c
51.0 ± 0.12c
49.6 ± 0.08c
50.3 ± 0.10c
Flour-unpeeded 6.68 ± 0.18a
1.75 ± 0.05b
55.5 ± 0.18b
53.5 ± 0.18b
54.5 ± 0.18b
Values are means ± standard deviations. For each parameter (column), values with the same letters are not significantly different (P > 0.05).
4. Conclusion
S. grossus, is a wetland weed of the family Cyperaceae which
has the potential of being used as a starchy food source. Physico-
chemical properties of its flour and starch revealed some unique
characteristics such as thermal stability and granule structure sta-
bility. These properties suggested the application of its flour and
starch to appropriate products. In vitro starch digestibility also
found that it might be suitable for use in low GI foods. These find-
ings could help in promoting the use of S. grossus as an alternative
starchy food. It could also add the values to this crop and enhance
food securities, as it is abundantly grown in wetlands or areas that
other crops cannot grow well.
References
AACC. (2009). AACC international approved methods of analysis (11th ed., pp. ). St.
Paul, MN, USA: AACC International.
AOAC. (2000). AOAC Official Methods of Analysis (17th ed., pp. ). VA, USA: Association
of Official Analytical Chemists.
Ardestani, A., & Yazdanparast, R. (2007). Cyperus rotundus suppresses AGE formation
and protein oxidation in a model of fructose mediated protein glycoxidation.
International Journal of Biological Macromolecules, 41, 572–578.
Bernabé, A. M., Srikaeo, K., & Schlüter, M. (2011). Resistant starch content starch
digestibility and the fermentation of some tropical starches in vitro. Food Diges-
tion, 2, 37–42.
Bhattarai, N. K. (1993). Folk herbal remedies for diarrhoea and dysentery in central
Nepal. Fitoterapia, 64, 243–250.
Cone, J. W., & Wolters, G. E. (1990). Some properties and degradability of isolated
starch granules. Starch/Stärke, 42, 298–301.
da Mota, R. V., Lajolo, F. M., Cordenunsi, B. R., & Ciacco, C. (2000). Composition and
functional properties of banana flour from different varieties. Starch/Stärke, 52,
63–68.
Franco, M. L. C., Preto, S. J. R., & Ciacco, C. F. (1992). Factors that affect the enzy-
matic degradation of natural starch granules-effect of the size of the granule.
Starch/Stärke, 44, 113–116.
Fuentes-Zaragoza, E., Riquelme-Navarrete, M. J., Sanchez-Zapata, E., & Perez-
Alvarez, J. A. (2010). Resistant starch as functional ingredient: A review. Food
Research International, 43, 931–942.
Goni, I., Garcia-Alonso, A., & Saura-Calixto, F. (1997). A starch hydrolysis procedure
to estimate glycemic index. Nutrition Research, 17, 427–437.
Hoover, R. (2001). Composition, molecular structure and physicochemical proper-
ties of tuber and root starches: A review. Carbohydrate Polymers, 45, 253–267.
Hu, P., Zhao, H., Duan, Z., Linlin, Z., & Wu, D. (2004). Starch digestibility and the
estimated glycemic score of different types of rice differing in amylose contents.
Journal of Cereal Science, 40, 231–237.
Hung, P. V., & Morita, N. (2005). Physicochemical properties and enzymatic
digestibility of starch from edible canna (Canna edulis) grown in Vietnam. Car-
bohydrate Polymers, 61, 314–321.
Jane, J., Shen, I., Chen, J., Lim, S., Kasemsuwan, T., & Nip, W. K. (1992). Physical and
chemical studies of taro starches and flours. Cereal Chemistry, 69, 528–535.
Jane, J., Chen, Y. Y., Lee, L. F., McPherson, A. E., Wong, K. S., Radosavljevic, M., et al.
(1999). Effects of amylopectin branch chain length and amylose content on the
gelatinization and pasting properties of starch. Cereal Chemistry, 76, 629–637.
Jayakody, L., Hoover, R., Liu, Q., & Weber, E. (2005). Studies on tuber and root
starches. I. Structure and physicochemical properties of innala (Solenostemon
rotundifolius) starches grown in Sri Lanka. Food Research International, 38,
615–629.
Jayakody, L., Hoover, R., Liu, Q., & Donner, E. (2007). Studies on tuber starches.
II. Molecular structure composition and physicochemical properties of yam
(Dioscorea sp.) starches grown in Sri Lanka. Carbohydrate Polymers, 69, 148–163.
Juliano, B. O. A. (1971). Simplified assay for milled-rice amylose. Cereal Science Today,
16(360), 334–340.
Karim, A. A., Norziah, M. H., & Seow, C. C. (2000). Method for the study of starch
retrogradation. Food Chemistry, 71, 9–31.
Kilani, S., Abdelwahed, A., Chraief, I., Ben Ammar, R., Hayder, N., Hammami, M.,
et al. (2005). Chemical composition antibacterial and antimutagenic activities
of essential oil from (Tunisian) Cyperus rotundus. Journal of Essential Oil Research,
17, 695–700.
Kilani, S., Ben Sghaier, M., Limem, I., Bouhlel, I., Boubaker, J., Bhouri, W., et al. (2008).
In vitro evaluation of antibacterial, antioxidant cytotoxic and apoptotic activities
of the tubers infusion and extracts of Cyperus rotundus. Bioresource Technology,
99, 9004–9008.
Kim, Y. S., Wiesnborg, D. P., Orr, P. H., & Gant, L. A. (1995). Screening potato starch for
novel properties using differential scanning colorimeter. Journal of Food Science,
60, 1060–1065.
Lee, H. C., Htoon, A. K., & Paterson, J. L. (2007). Alkaline extraction of starch from
Australian lentil cultivars Matilda and Digger optimized for starch yield and
starch and protein quality. Food Chemistry, 102, 551–559.
Mahasukhonthachat, K., Sopade, P. A., & Gidley, M. J. (2010). Kinetics of starch
digestion in sorghum as affected by particle size. Journal of Food Engineering,
96, 18–28.
Moorthy, S. N. (2002). Physicochemical and functional properties of tropical tuber
starches: A review. Starch/Stärke, 54, 559–592.
Nugent, A. P. (2005). Health properties of resistant starch. British Nutrition Foun-
dation. Nutrition Bulletin, 30, 27–54.
Ohira, S., Hasegawa, T., Hyashi, K. I., Hoshino, T., Takaoka, D., & Nozaki, H. (1998).
Sesquiterpenoids from Cyperus rotundus. Phytochemistry, 47, 1577–1581.
Pérez, E., & Lares, M. (2005). Chemical composition, mineral profile and functional
properties of canna (Canna edulis) and arrowroot (Maranta spp.) starches. Plant
Foods for Human Nutrition, 60, 113–116.
Piyachomkwan, K., Chotineeranat, S., Kijkhunasatian, C., Tonwitowat, R., Pramma-
nee, S., Oates, C. G., et al. (2002). Edible canna (Canna edulis) as a complementary
starch source to cassava for the starch industry. Industrial Crops and Products, 16,
11–21.
Riley, C. K. (2004). In vitro digestibility of raw starches extracted from five Yam
species grown in Jamaica. Starch/Stärke, 56, 69–73.
Sajilata, M. G., Singhal, R. S., & Kulkarni, P. R. (2006). Resistant starch – A review.
Comprehensive Reviews in Food Science and Food Safety, 5, 1–17.
Schoch, T. J. (1964). Method of swelling power and solubility. In R. L. Whistler, R. J.
Smith, & J. N. BeMiller (Eds.), Methods in carbohydrate chemistry starch (p. 106).
London, UK: Academic Press.
Singh, N., Singh, J., Kaur, L., Sodhi, N. S., & Gill, B. S. (2003). Morphological thermal
and rheological properties of starches from different botanical sources. Food
Chemistry, 81, 219–231.
Singh, J., Dartois, A., & Kaur, L. (2010). Starch digestibility in food matrix: A review.
Trends in Food Science & Technology, 21, 168–180.
Sopade, P. A., & Gidley, M. J. (2009). A rapid in-vitro digestibility assay based
on glucometry for investigating kinetics of starch digestion. Starch/Stärke, 61,
245–255.
Srikaeo, K., Mingyai, S., & Sopade, P. A. (2011). Physicochemical properties, resistant
starch content and enzymatic digestibility of unripe banana, edible canna taro
flours and their rice noodle products. International Journal of Food Science and
Technology, 46, 2111–2117.
Steinmann, F., & Brändle, R. (1984). Carbohydrate and protein metabolism in the
rhizomes of the bulrush (Schoenoplectus lacustris (L.) palla in relation to natural
development of the whole plant. Aquatic Botany, 19, 53–63.
Svegmark, K., & Hermansson, A. M. (1993). Microstructure and rheological prop-
erties of composites of potato starch granules and amylose: A comparison of
observed and predicted structure. Food Structure, 12, 181–193.
Swapna, M. M., Prakashkumar, R., Anoop, K. P., Manju, C. N., & Rajith, N. P. (2011).
A review on the medicinal and edible aspects of aquatic and wetland plants of
India. Journal of Medicinal Plants Research, 5, 7163–7176.
Tester, R. F., & Debon, S. J. J. (2000). Annealing of starch – A review. International
Journal of Biological Macromolecules, 27, 1–12.
Tester, R. F., & Morrison, W. R. (1990). Swelling and gelatinization of cereal starches.
Cereal Chemistry, 67, 558–563.
Thitipraphunkul, K., Uttapap, D., Piyachomkwan, K., & Takeda, Y. (2003). A compar-
ative study of edible canna (Canna edulis) starch from different cultivars. Part I.
Chemical composition and physicochemical properties. Carbohydrate Polymers,
53, 317–324.
Uddin, S. J., Mondal, K., Shilpi, J. A., & Rahnan, M. T. (2006). Antidiarrhoeal activity
of Cyperus rotundus. Fitoterapia, 77, 134–136.
Umerie, S. C., & Ezeuzo, H. O. (2000). Physicochemical characterization and utiliza-
tion of Cyperus rotundus starch. Bioresource Technology, 72, 193–196.
Watcharatewinkul, Y., Puttanlek, C., Rungsardthong, V., & Uttapap, D. (2009). Pasting
properties of a heat-moisture treated canna starch in relation to its structural
characteristics. Carbohydrate Polymers, 75, 505–511.
Yanika, W., Chureerat, P., & Vilai, R. (2009). Pasting properties of a heat-moisture
treated canna starch in relation to its structural characteristics. Carbohydrate
Polymers, 75, 505–511.
Yong, L. Z., Chan, C. H., Garcia, C., & Sopade, P. A. (2010). Weighing up whey for-
tification of foods: Implications for kinetics of starch digestion and estimated
7. 488 C. Lerdluksamee et al. / Carbohydrate Polymers 97 (2013) 482–488
glycemic index of model high-protein-low-carbohydrate food systems. Carbo-
hydrate Polymers, 84, 162–172.
Yuan, Y., Zhang, L. M., Dal, Y. J., & Yu, J. G. (2007). Physicochemical properties of
starch obtained from Dioscorea nipponica Makino comparison with other tuber
starches. Journal of Food Engineering, 82, 436–442.
Zhou, M., Robards, K., Glennie-Holmes, M., & Helliwell, S. (1998). Structure and
pasting properties of oat starch. Cereal Chemistry, 75, 273–281.
Zhu, M., Luk, H. H., Fung, H. S., & Luk, C. T. (1997). Cytoprotective effects of Cype-
rus rotundus against ethanol induced gastric ulceration in rats. Phototherapy
Research, 11, 392–394.