More Related Content
Similar to MScDissertationPoster - JDolman
Similar to MScDissertationPoster - JDolman (20)
MScDissertationPoster - JDolman
- 1. Analysis of Cycle Route Choice in
London using GPS DataJonathan Dolman
MSc Geographic Information Science
Supervised by Dr James Haworth
The Mayor’s Vision for Cycling (2013) outlined key targets, including increasing cycling to
5% of travel mode share and investing millions in cycle infrastructure.
Several studies have shown that cyclists do not use the shortest path through road
networks, but compromise between distance and a variety of other factors, including:
• Presence of cycle-specific infrastructure
• Gradient of roads (maximum more important than average)
• Traffic volume and perceived danger
• ‘Cycle Superhighways’ are popular, as can be seen when the data is visualised on
the road network.
• AM Peak: overall routes were 15.5% and 1770m longer than shortest paths.
• PM peak: overall routes were 22.6% and 1749m longer.
Limitations
• 30% of routes were incomplete or shorter than the shortest path (removed from
results above). This may be because of non-matching TOIDs in the Strava and ITN
data.
• Some routes generated were unrealistic – they are made up of the most-
frequented road segments and do not represent real routes.
Conclusions and Further Work
The methodology could be improved by using more realistic replacement values
and only analysing weekday data to remove influence of cycle events.
GPS data provides new opportunities for in-depth analysis of human mobility.
An averaged dataset may not be the most suitable type of data for calculating
specific routes, and may be better suited for analysing overall patterns.
The shortest path analysis could be used as part of a route choice and forecasting
model for cycling in London, based on both GPS data and qualitative analysis.
Additional attributes could be analysed, such as traffic volume and demographic
data, and analysis could be expanded to cover more boroughs and routes.
Understanding route choice and trade-offs is fundamental to designing
infrastructure that encourages more people to cycle (Menghini et al, 2010: 754).
UCL Department of Civil, Environmental, and Geomatic Engineering, Gower Street, London WC1E 6BT
GPS-enabled devices have facilitated the collection of vast amounts of mobility data, providing unmatched granularity and a ‘social micro-scope’ to understand human mobility (Giannotti et al
2011: 695). Using a GPS dataset of cycling activity averaged over one year, this study analysed cyclists’ routes in London and looked specifically at inbound and outbound commuting trips.
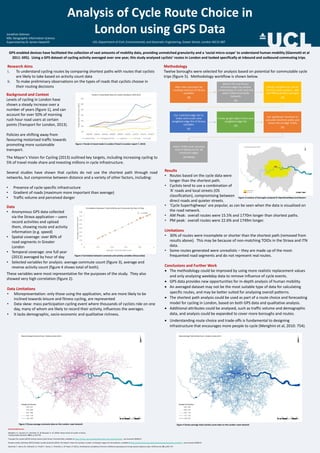
Methodology
Twelve boroughs were selected for analysis based on potential for commutable cycle
trips (figure 5). Methodology workflow is shown below.
Figure 5 Location of boroughs analysed © OpenStreetMap Contributors
Background and Context
Levels of cycling in London have
shown a steady increase over a
number of years (figure 1), and can
account for over 50% of morning
rush hour road users at certain
points (Transport for London, 2013).
Policies are shifting away from
favouring motorised traffic towards
promoting more sustainable
transport.
Research Aims
i. To understand cycling routes by comparing shortest paths with routes that cyclists
are likely to take based on activity count data
ii. To make preliminary observations on the types of roads that cyclists choose in
their routing decisions
Data Limitations
• Misrepresentation: only those using the application, who are more likely to be
inclined towards leisure and fitness cycling, are represented
• Data skew: mass participation cycling event where thousands of cyclists ride on one
day, many of whom are likely to record their activity, influences the averages.
• It lacks demographic, socio-economic and qualitative richness.
Figure 1 Trends in travel mode in London (Travel in London report 7, 2014)
Data
• Anonymous GPS data collected
via the Strava application – users
record activities and upload
them, showing route and activity
information (e.g. speed)
• Spatial coverage: over 80% of
road segments in Greater
London
• Temporal coverage: one full year
(2013) averaged by hour of day
These variables were most representative for the purposes of the study. They also
showed very high correlation (figure 2).
Figure 2 Correlation between commute and activity variables (Strava data)
Selected References
Menghini, G., Carrasco, N., Schüssler, N., & Axhausen, K. W. (2010), Route choice of cyclists in Zurich,
Transportation Research, 44(A), p.754-765
Transport for London (2013) Central London Cycle Census Technical Note, available at https://tfl.gov.uk/corporate/publications-and-reports/cycling. Last accessed 30/08/15.
Greater London Authority (2013) Greater London Authority (2013), The Mayor’s Vision for Cycling in London: An Olympic Legacy for all Londoners, available at https://www.london.gov.uk/priorities/transport/cycling-revolution. Last accessed 30/08/15.
Giannotti, F., Nanni, M., Pedreschi, D., Pinelli, F., Renso, C., Rinzivillo, S., & Trasart, R. (2011), Unveiling the complexity of human mobility by querying and mining massive trajectory data, VLDB Journal, 20, p.695-719
Results
• Routes based on the cycle data were
longer than the shortest path.
• Cyclists tend to use a combination of
‘A’ roads and local streets (OS
classification), compromising between
direct roads and quieter streets.
• Selected variables for analysis: average commute count (figure 3), average and
reverse activity count (figure 4 shows total of both).
Figure 3 Strava average commute data on the London road network Figure 4 Strava average total activity count data on the London road network