Midland Basin Pure Play Pair Trade: Short Parsley, Long Diamondback or RSP Permian
1. The Battle for Midland Basin Supremacy: Pointers on a Pure Play Pair Trade
Summary. Capital raises have helped to buoy spirits and
increase activity in the Midland Basin, shoring up balance
sheets and fueling capex even as WTI struggles to stay above
$60/bbl. This piece looks at five pure plays in the basin in an
attempt to identify which producers are poised to deliver
growth in the current price environment without tapping
capital markets further. These stocks should trade at a
premium to the group. Otherwise, there are opportunities for
investors. Considering production growth adjusted for capital
infusions during oil’s slide, balance sheet health, and relative
multiples, Diamondback Energy (FANG) and RSP Permian
(RSPP) are clear winners while Parsley Energy (PE) appears
overvalued.
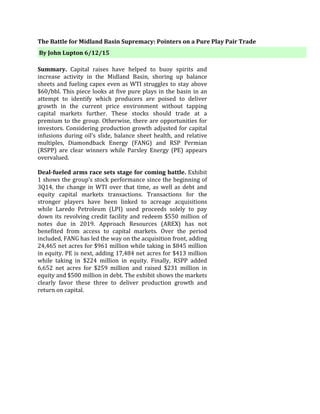
Deal-fueled arms race sets stage for coming battle. Exhibit
1 shows the group’s stock performance since the beginning of
3Q14, the change in WTI over that time, as well as debt and
equity capital markets transactions. Transactions for the
stronger players have been linked to acreage acquisitions
while Laredo Petroleum (LPI) used proceeds solely to pay
down its revolving credit facility and redeem $550 million of
notes due in 2019. Approach Resources (AREX) has not
benefited from access to capital markets. Over the period
included, FANG has led the way on the acquisition front, adding
24,465 net acres for $961 million while taking in $845 million
in equity. PE is next, adding 17,484 net acres for $413 million
while taking in $224 million in equity. Finally, RSPP added
6,652 net acres for $259 million and raised $231 million in
equity and $500 million in debt. The exhibit shows the markets
clearly favor these three to deliver production growth and
return on capital.
By John Lupton 6/12/15
2. Oil growth for existing shareholders will determine
winners. These producers are not after gas. The best of the
group will grow their oil volumes without the need for
additional capital. During oil’s slide from the beginning of 3Q14
through the end of 1Q15, FANG and RSPP proved the most
adept at delivering for existing shareholders as measured by
production growth per debt-adjusted share. Exhibit 2 walks
through the calculation of the metric. Period-ending share
count is adjusted by adding long-term debt divided by period-
average share price. During the nine-month period, FANG grew
oil volumes by 44% per debt-adjusted share. RSPP was a close
second at 37%. These stocks should command a premium in
the market relative to peers because of their proven ability to
deliver even during hard times.
Exhibit 1: Stock Returns, Capital Markets Deals, WTI Change Since Start of 3Q14
FANG $422 million equity
RSPP $102 million equity
RSPP $500 million debt
FANG $106 million equity
PE $224 million equity
RSPP $129 million equity
FANG $297 million equity
LPI $663 million equity
LPI $350 million debt
Source: Yahoo! Finance, EIA, Company Reports
3. 3Q14
AREX FANG LPI PE RSPP
Oil production (mbbls) 507 1,426 1,778 733 738
Period-ending share count (000) 39,337 56,680 143,715 93,907 77,292
Long-term debt ($000) 339,500 590,000 1,576,358 556,930 500,000
Average share price ($) 18.68 81.05 25.50 21.79 27.80
Debt adjustment (000) 18,173 7,280 61,821 25,562 17,983
Debt-adjusted shares (000) 57,510 63,960 205,536 119,468 95,275
bbls/thousand shares 8.82 22.30 8.65 6.14 7.75
1Q15
AREX FANG LPI PE RSPP
Oil production (mbbls) 493 2,132 2,172 1,009 1,078
Incremental shares (000) 1,226 2,328 70,168 14,917 5,976
Incremental debt ($000) 120,500 21,579 (276,358) (444) 0
Average share price ($) 6.88 69.38 11.36 15.64 26.73
Debt adjustment (000) 17,522 311 (24,336) (28) 0
Debt-adjusted shares (000) 76,258 66,599 251,369 134,357 101,251
bbls/thousand shares 6.46 32.01 8.64 7.51 10.65
Growth -27% 44% 0% 22% 37%
Leverage warns of looming casualties, calls for backup. Not
only do FANG and RSPP have the most impressive production
history, they have the cleanest balance sheets. Exhibit 3 shows
debt to annualized 1Q15 EBITDA at 1.39x and 2.09x
respectively for the two basin leaders. AREX’s leverage looks
dangerously high, especially considering its inability to grow
production volumes in a depressed price environment. PE’s
3.86x ratio is also alarming; however, PE should grow into the
debt somewhat given the quality of its acreage (see production
growth). Still, the high leverage could signal an equity deal in
the near future. Meanwhile, LPI management is calling for
relatively flat production and appears to be treading water in
hopes of a further leg up for WTI.
Trading multiples belie the likely outcome. With a superior
production track record and healthier balance sheets, FANG
and RSPP are the most prepared to efficiently ramp activity,
yet the market’s valuation seems to tell a different story. On EV
to annualized 1Q15 EBITDA, PE trades more than five turns
higher than either competitor. On price to annualized 1Q15
Exhibit 2: FANG and RSPP Dominate Oil Growth Per Debt-Adjusted Share
Source: Company Reports
4. cash flow from operations, PE appears more attractive, but
some significant adjustments were made to unusual reductions
in accrued expenses to arrive at the ratios shown in Exhibit 3.
EV/EBITDA is a more reliable metric in this instance. Some of
the enthusiasm surrounding PE may stem from the wow factor
of its Upton County well results. Its recent Wolfcamp B
completions have averaged 30-day IP rates of over 230 boe/d
per 1,000’ of lateral; however, PE’s wells are considerably
gassier than those of rivals to the north, worsening their
economics. The market may also be pricing in potential upside
from PE’s ~30,000 net acres in the Delaware Basin. Aanadarko
and EOG are making strides to the north of PE’s acreage;
however, PE is yet to drill a horizontal in the Delaware and
lacks the financial clout of these larger competitors. Meaningful
production by PE in the Delaware would appear to be a long
way off. AREX and LPI have been punished for their
underperformance, and with ~24% and ~23% of their
respective floats sold short, a breakout by WTI could result in a
big pop for these stocks. With PE trading at lofty levels
compared to more proven basin leaders, investors should
consider shorting it against long positions in either FANG or
RSPP.
Oil growth/debt-
adjusted share Debt/EBITDA EV/EBITDA P/CF*
AREX -27% 3.45 5.66 2.72
FANG 44% 1.39 13.02 12.94
LPI 0% 2.74 9.42 14.25
PE 22% 3.86 18.12 12.59
RSPP 37% 2.09 12.52 19.65
*Reflects adjustments to decreases in accrued expenses to better represent recurring operations.
Exhibit 3: Leverage, Trading Multiples Compared To Oil Growth Per Debt-Adjusted Share
Source: Company Reports
5. AREX (Neutral). AREX’s acreage position is largely
concentrated in Crockett County to the south of other
competitors, and well economics are simply not as good. AREX
has struggled to keep up production amid the collapse in oil
prices, and debt to annualized EBITDA has ballooned from
1.68x in 3Q14 to 3.45x in 1Q15. With 24% of the float sold
short, a surge in WTI would benefit this stock more than
others, rendering it unattractive as a short; however, in a
persistently low commodity price environment, AREX is not a
buy.
FANG (Buy). FANG’s growth in oil volumes, strong balance
sheet, and capital efficiency are unrivaled in the basin. FANG
recently drilled an 8,200’ lateral in 12 days, and its costs for a
7,500’ lateral currently range from $6.2 to $6.7 million. Recent
acquisitions add to a deep inventory of locations with
promising economics, and FANG is set to ramp to five
horizontal rigs in 2H15 from three in 1Q15. CEO Travis Stice
says FANG may run up to seven or eight rigs in 2016.
Moreover, FANG owns mineral rights beneath the prolific
Spanish Trail lease that it co-operates with RSPP through its
88% interest in Viper Energy Partners. The mineral interest
provides uplift to well economics, and the stash of MLP units
provides potential for monetization. At 13x annualized
EBITDA, valuation appears attractive relative to peers, and
FANG is a strong buy.
LPI (Neutral). LPI’s acreage position in Reagan and Glasscock
Counties is solid; however, with relatively high leverage and
the stock having given up more than 50% since the beginning
of 3Q14, the company cannot access the capital necessary to
develop it in a timely fashion. Instead, management is focused
on reducing activity and becoming cash flow positive for 2H15.
The short trade is crowded with 23% of the float sold short,
but absent a breakthrough by WTI, LPI has a long road ahead
of it.
PE (Sell). PE has an enviable position in Upton and Reagan
Counties, and well results have been among the best in the
basin; however, production is gassier, and well costs are higher
relative to FANG and RSPP. PE’s 1Q15 production was 59% oil
while FANG and RSPP’s was 77% and 75% respectively.
Moreover, while FANG is drilling 7,500’ laterals for $6.2 to $6.7
million, PE is drilling 7,000’ laterals for $7 million. Leverage is
also a concern, with debt to annualized EBITDA at 3.86x. PE
will struggle to keep pace with basin leaders who consistently
6. deliver oily production growth to shareholders, and the
multiple will have to adjust to reflect performance. Long-term
prospects are bright for this up-and-comer, but at 18x
annualized EBITDA the stock is currently overvalued.
RSPP (Buy). RSPP is a leader in stacked development, focusing
its capital spending on the drill bit, as it proves up the Lower
and Middle Spraberry zones across its acreage. RSPP owns all
depths on over 99% of its acreage and has produced
impressive results from different benches. A recent three-well
pad on the Spanish Trail lease averaged 30-day IP rates of 154
boe/d per 1,000’ of lateral, and a recent two-well pad on the
Cross Bar Ranch lease produced similar results from the
Middle and Lower Spraberry. RSPP had a backlog of 16
operated horizontals and 15 operated verticals awaiting
completion at the end of 1Q15, and management is guiding for
50% year over year production growth. Given reasonable
leverage and a solid production track record, the 12.5x
EV/annualized EBITDA is attractive relative to peers. RSPP is a
buy.