1. Following the decline in the Energy sector, we are looking for buying opportunities
throughout the Energy sector. Since the valuation and outlook for upstream and exploration
companies are not favourable for the time being, we are deciding to invest in the downstream
segment of the Energy market since we think that integrated downstream companies can take
advantage of the increasing Brent/WTI spreads, increased U.S production as well as higher
utilization rates
Main Contributors
Significant refining exposure, with high potential cost savings
Tesoro has ~75% EBITDA exposure to refining, ~11% retail and ~14% logistics in 2014A.
Tesoro is spending significant capital in refining in coming years, primarily to achieve Los
Angeles acquisition synergies and other margin enhancement opportunities.
West Coast refining improvement potential could experience enhancements
About 85% of TSO’s refining capacity is on the West Coast (~62% California, ~23% Pacific
Northwest and Alaska). California refining has been challenged for years by a combination
of a tough regulatory environment and excess refining capacity. This trend is expected to
improve over the next couple of years since the company has the potential to have access to
advantaged crude access via its Port of Vancouver project, which could aid margins. The
company may be able to generate an incremental ~4-5$ in gross margins
Strong cash flow generation from the Mid-Continent region
The remaining ~15% of TSO’s refining capacity is in the favorable Mid-Continent and
Rocky Mountain regions, which should continue to benefit from discounted Bakken and
Uinta crudes, respectively.
Sum of the parts valuation shows upside
A sum of the parts method was used in order to value Tesoro. For TSO, we estimate a
December 2015 price target of $1143/share, which represents 26% upside, including
dividends. Our approach uses a 3.5x EBITDA multiple for refining (West Coast discount
applied to the group average 4x), 8x for retail, a public market multiple for TLLP LP (~13x
implied EBITDA)
Tesoro Corporation, NYSE: TSO ($90.50) Alvy Mizelle
Buy – Target Price $113.98 March 31st
2015
Kenneth Woods
Portfolio Management Program
Business Metrics
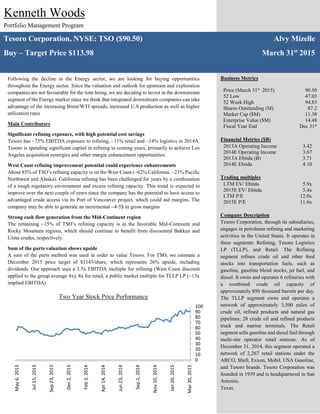
Price (March 31st
2015) 90.50
52 Low 47.03
52 Week High 94.83
Shares Outstanding (M) 87.2
Market Cap ($M) 11.38
Enterprise Value ($M) 14.48
Fiscal Year End Dec 31st
Financial Metrics ($B)
2013A Operating Income 3.42
2014E Operating Income 3.67
2013A Ebitda (B) 3.71
2014E Ebitda 4.10
Trading multiples
LTM EV/ Ebitda 5.9x
2015E EV/ Ebitda 5.4x
LTM P/E 12.0x
2015E P/E 11.6x
Company Description
Tesoro Corporation, through its subsidiaries,
engages in petroleum refining and marketing
activities in the United States. It operates in
three segments: Refining, Tesoro Logistics
LP (TLLP), and Retail. The Refining
segment refines crude oil and other feed
stocks into transportation fuels, such as
gasoline, gasoline blend stocks, jet fuel, and
diesel. It owns and operates 6 refineries with
a combined crude oil capacity of
approximately 850 thousand barrels per day.
The TLLP segment owns and operates a
network of approximately 3,500 miles of
crude oil, refined products and natural gas
pipelines; 28 crude oil and refined products
truck and marine terminals. The Retail
segment sells gasoline and diesel fuel through
multi-site operator retail stations. As of
December 31, 2014, this segment operated a
network of 2,267 retail stations under the
ARCO, Shell, Exxon, Mobil, USA Gasoline,
and Tesoro brands. Tesoro Corporation was
founded in 1939 and is headquartered in San
Antonio,
Texas.
0
10
20
30
40
50
60
70
80
90
100
Mar30,2015
Jan20,2015
Nov10,2014
Sep2,2014
Jun23,2014
Apr14,2014
Feb3,2014
Dec2,2013
Sep23,2013
Jul15,2013
May6,2013
Two Year Stock Price Performance
2. Contents
Company Overview..........................................................................................................................3
Refining ........................................................................................................................................3
Logistics........................................................................................................................................6
Operational Levers ...................................................................................................................7
Retail.............................................................................................................................................7
Brand Portfolio.........................................................................................................................7
West Coast and Mid-Continent refining exposure:..................................................................9
California Synergies.......................................................................................................................10
Port of Vancouver project ..............................................................................................................11
Operational Diversity.....................................................................................................................13
Increasing Margins.........................................................................................................................13
Competition Analysis.....................................................................................................................14
Operating Margins......................................................................................................................14
Valuation ........................................................................................................................................15
Operating Assumptions ..............................................................................................................15
Sum of Parts Valuation...............................................................................................................17
Refining ......................................................................................................................................17
Retail...........................................................................................................................................17
TLLP...........................................................................................................................................18
Appendix ........................................................................................................................................19
Appendix 1: Management Team ................................................................................................19
Appendix 2: References..............................................................................................................20
3. Company Overview
Tesoro Corporation is an independent petroleum refining and marketing company
headquartered in San Antonio, Texas. The company hasthree business lines including
refining, logistics (contained in the Tesoro Logistics MLP, TLLP) and retail. The refining
segment operates six refineries with total crude capacity of 850,000 Bpd, located in
California, Washington, Alaska, Utah and North Dakota. The logistics segment includes the
High Plains gathering system in the Bakken, the Northwest Products Pipeline, 19 crude oil
and refined products terminals, four California marine terminals, one rail unloading facility
and one petroleum coke handling facility. The retail segment includes a network of over
2,200 branded retail gas stations located in 17 states, mainly on the West Coast, but also in
the Southwest and Midwest US.
Refining
Tesoro owns and operates six petroleum refineries in the western U.S., heavily weighted toward
the West Coast. The company’s total crude distillation capacity is 850kbpd. TSO separates its
refinery operations into three geographic regions: California, including the Martinez and Los
Angeles facilities (529kbpd of capacity, or 62% of total); Pacific Northwest, consisting of the
Anacortes and Kenai facilities (192kbpd of capacity, or 23% of total); and Mid-Continent,
including the Salt Lake City and Mandan facilities (129kbpd, or 15% of total). Refining is TSO’s
largest business, accounting for ~75% of 2014E EBITDA.
Source: Company Reports
Tesoro Locations
4. Tesoro’s Mid-Continent gross margins are TSO’s highest at $21.73/bbl due to access to advantaged
crudes from the Bakken in North Dakota and waxy crudes from the Uinta Basin in Salt Lake City,
Utah. Several recent projects are focused around improving gross margins in California and the
Pacific Northwest through the logistics system, providing increased access to advantaged crudes,
while synergies from the BP acquisition should further boost gross margins in California.
California is the least advantaged region from an operating cost perspective due to the more
stringent regulatory environment.
Tesoro's system-wide feedstock slate is composed of light crude (66%), heavy crude (27%), and
other feed stocks (7%). The Pacific Northwest and Mid-Continent regions run almost exclusively
light crudes, while California has more heavy crudes (42%) due to the higher complexity of the
Martinez and Los Angeles refineries.
Refinery Location Crude Oil Capacity (bpd)
Anacortes Refinery Anacortez, Washington 120,000
Kenai Refinery Kenai, Alaska 72,000
Loas Angeles Refinery Los Angeles California 363,000
Mandan refinery Mandan, N.D? 71,000
Martinez Refinery Martnez, California 166,000
Salt Lake Refinery Salt Lake City, Utah 58,000
Total 850,000
Refinery Locations and Capacity
EBITDA by Region
Source: Company reports and KWMPMP Estimates
Source: Company Reports
5. Refinery utilization, based on average throughput and average capacity, was 87% for the overall
system in 2013, while California ran at 92%, Mid-Continent at 89%, and Pacific Northwest at 76%.
Pacific Northwest has the lowest utilization in the group due to seasonality and challenging
competitive conditions in Alaska, while Mid-Continent’s decreased from 96% in 2012 due to
capacity expansions, where throughput has yet to fully ramp.
Following its recent acquisition of BP's Carson refinery, Tesoro has over 30% market share in Los
Angeles. Other sizable players include Chevron (~25%), Exxon Mobil (~14%), and Phillips 66
(~13%). Alon’s 70kbpd refinery is currently idled, while the remainder is active. Los Angeles
Crude Categories by Region
Source: Company reports
Refinery Utilization by Geography
Source: Company reports and KWMPMP Estimates
6. refineries tend to source heavy crudes from local California production and from the Canadian oil
sands, medium crudes from the ANS region and Middle Eastern imports, and light crudes from
South America and other global regions, and increasingly the Bakken.
Logistics
Tesoro Logistics L.P. (NYSE: TLLP), a publicly traded master limited partnership (MLP),
completed its initial public offering in April 2011. TLLP charges fees for gathering crude oil and
for terminaling, transporting and storing crude oil and refined products for Tesoro and for third
parties. The partnership’s assets include the High Plains crude oil pipeline system in the Bakken
Shale/Williston Basin and the related trucking operations in the Bakken region that gather and
transport crude from well sites to collection points It also includes a common carrier products
pipeline running from Salt Lake City to Spokane, WA, and a jet-fuel pipeline running to the Salt
Lake City airport, 20 refined products terminals and storage facilities in the US Midwest and west,
four marine terminals in California, a rail-car unloading facility in Washington, a petroleum coke
handling and storage facility in Los Angeles, and other pipelines that transport products and crude
oil from TSO’s refineries to nearby facilities in Salt Lake City and Los Angeles.
TSO has a ~35% interest in TLLP following TLLP’s August 2014 public offering, including its
2% general partner interest, and owns 100% of the GP entity. TLLP’s financials are consolidated
into TSO as a variable interest entity and is reported as a separate segment. About 87% of TLLP’s
FY13 revenues were derived from Tesoro. In 2013, TLLP contributed 7.5% ($81 M) to TSO's total
operating income.
Company Location Status Crude Capacity Idle Capacity
Tesoro Los Angeles Active 363 0
Chevron El Segundo Active 269 0
Exxon Torrance Active 150 0
Phillips 66 Los Angeles Active 139 0
Valero Wilmington Active 85 0
Alon Paramount Idle 0 70
World Oil South Gate Active 9 0
Total 1,015 70
Source: Company reports and Energy Information Administration
Los Angeles Refinery Market
7. Operational Levers
The company plans on accomplishing performance objectives tha could deliver up to ~$700M in
incremental EBITDA. The company has three categories for EBITDA improvements. First, the
company sees $260-300M in FY15 synergies related to the BP Carson refinery acquisition, with
$430- 490M in total to be achieved by 2017. Next, multiple projects are under way to increase the
proportion of inexpensive “advantaged crude” throughput within the company’s California and
Alaska refineries, which also boast a product yield. Finally, the company plans to pursue broad
cost savings opportunities throughout the organization, such as general cost reductions within the
refinery system, supply chain management, optimization processes, OEMS, and Lean Six Sigma
Additional growth expected in the logistics business TSO is also pursuing EBITDA growth at
TLLP from future asset dropdowns and organic growth opportunities.
Retail
Tesoro’s retail business markets gasoline, diesel fuel, and other merchandise items in the western
United States through company-operated retail stations as well as third party dealers and
distributers. TSO’s retail segment operated 586 TSO-operated stations and 1,682 jobber/dealer or
third-party stations, operating in 17 states, with total fuel sales of 3.2B gallons ($10.1B) in 2013.
TSO’s gasoline sales are 87% integrated into TSO’s refinery operations. The retail segment
accounted for 11% of TSO’s segment EBITDA in FY14E.
Brand Portfolio
Tesoro conducts retail operations under six brands, plus a master franchisee license. Tesoro, the
company’s legacy brand, operates throughout the Western United States, excluding California.
Along with its acquisition of the Wilmington refinery from Royal Dutch Shell in May 2007, TSO
acquired the Shell and USA Gasoline brands in 17 states, including California. In conjunction with
the acquisition of the Carson refinery and L.A. logistics assets from BP in June 2013, TSO acquired
the ARCO brand, which operates in AZ, CA, and NV, and the master franchisee license for the
Source: Company reports and Sell Side Estimates
Public Distributions
8. ampm brand. Separately in June 2013, the company acquired the Exxon and Mobil brands in seven
states, with market launch expected for all but MN (begun in 2013) in 2014.
Tesoro is pursuing gross margin enhancement across the value chain, including its retail operations.
The company should experience margin enhancement to be driven by gasoline integration and by
selling a higher percentage to its retail locations. The company has had a strong focus over the past
five years toward increasing its gasoline integration level between the refinery business and the
marketing business through brand acquisitions, increasing its integration level from 31% in 2009
to 87% in 2013. TSO intends to drive gross margin enhancement through a focus on premium
products within its portfolio and selective organic growth (ARCO in Southern California, Exxon
and Mobil in key regions).
Tesoro Retail Locations
Source: Company Reports
9. West Coast and Mid-Continent refining exposure:
Through the cycle, refining has been the most important segment for TSO, typically >80% of
segment EBIT. Refining was 81% of total segment EBIT in 2013 after dropping ~50% y/y versus
2012. TLLP is growing as a portion of profits, as the company drops down more assets and
continues to grow the business. Refining operates in three regions: California, the Pacific
Northwest, and Mid- Continent. While Mid-Continent has grown from ~20% of segment EBITDA
in 2005 to ~50% in 2013 on expanding margins, the West Coast (California and Pacific
Northwest) has traditionally been the most important region. TSO expanded further into the West
Coast in 2013 through its acquisition of BP’s 266kbpd refinery in Carson, CA.
Source: Company reports
Gasoline Marketing Integration
Refining EBITDA percentages by location
Source: Company reports and KWMP Estimates
10. Historically, TSO’s stock price has been correlated to West Coast margins per barrel, particularly
in California. That said, with the recently strong Mid-Continent margins and TSO’s Mid-Continent
refining exposure, stock performance has benefited somewhat, in our view (along with improved
execution on cost savings).
California Synergies
The company has identified multiple projects that will help the company generate synergies from
its recent Los Angeles acquisition. The main areas are production, operating and feedstock projects.
The production optimization category includes the integration project to reduce emissions and
increase distillate production flexibility ($50-75M/yr in total), a physical pipe connection between
the facilities that will allow TSO to efficiently move feedstock across the facilities and fully utilize
conversion capacities (~$60M/yr in total), and fundamental yield optimization, allowing for higher
distillate vs. gasoline yields without capital investment ($35mm/yr in total).
Operating cost improvement synergies include improving utilization through a focus on reliability
and mechanical integrity, maintenance and personnel efficiencies, and engineering resource
efficiency (i.e. utilizing less third-party engineering resources).
Source: Company reports
Stock price performance and Mid-continent margin per barrel
11. TSO’s feedstock projects are aimed toward expanding the utilization of advantaged crudes within
each refinery. Presently, Mandan and Salt Lake City each use 100% advantaged crudes due to their
geographic locations. Anacortes now runs 70% advantaged crudes following the 2012 completion
of the rail unloading terminal facilitating the delivery of Bakken crude. Kenai, which currently runs
~25% advantaged crude from the Cook Inlet in Alaska, is targeted at ~2/3 advantaged crude
feedstock between the Cook Inlet and Bakken following the completion of the Port of Vancouver
project.
Due to the shift towards more advantaged crude, TSO expects its usage of WTI based crudes to
expand from 15% in 3Q13 to 38% in 2015, displacing ANS and crude imports. While advantaged
crudes such as Bakken can expand gross margin per barrel by providing cost savings versus foreign
and domestic alternatives, such crudes also provide an advantage in product yield. For example, in
its Anacortes refinery, TSO yields 68% high value products (gasoline, distillate) when running
Bakken crude vs. 53% for ANS, providing a margin boost of $3-5/bbl on average.
Port of Vancouver project
In April 2013, TSO announced the formation of a 50/50 joint venture with Savage Companies to
develop and operate a rail-to-marine terminal in the Port of Vancouver, WA, with an initial capacity
of 120kbpd (TSO will have the right to the first 60 kbpd of throughput) and potential for up to 300
kbpd in total. The project, expected to be completed sometime in 2015, will allow TSO to rail
barrels into the port from the Bakken or from other advantaged Mid-Continent crude sources,
transfer the barrels to a domestic-flag vessel, and ship the barrels to the company’s refineries in
Kenai, Martinez, and Los Angeles.
Refinery Project Completion Date EBITDA Benefit/Year ($M) IRR
Mandan 10 kbpd crude capacity expansion Jun-12 45-55 65%
Mandan Dieseldesulfurization unit expansion Jun-13 10-Dec 20%
Wilmington Yield improvement Nov-12 20-25 40%
Anacortes Bakken crude by rail Sep-12 160-180 220%
Salt Lake City Waxy crude project May-13, early ' 100 30%
Kenai, Martinez, LA Port ofVancouver loading facility 4Q14-4Q15 N.A. N.A.
Source: Company reports
Previous Cost Saving Projects
12. The value of the Port of Vancouver project can be illustrated by comparing the cost and yield of
Bakken crude railed to the Port of Vancouver and sent via ship to Los Angeles versus utilizing
ANS crude as an alternative. TSO estimates the rail cost of shipping Bakken to the Port of
Vancouver at $5.50-6.50/bbl, not including loading and unloading costs. However, the estimated
yield advantage of $3-5/bbl discussed above could make the project gross margin accretive. It is
also worth noting that TSO can typically get Bakken at a slightly cheaper price in the field, given
its gathering system advantage, relative to the hub price.
The project will be critical to get advantaged crude to California. In April 2013, Tesoro announced
a joint venture with Savage Companies to build a 360,000 Bpd rail-tomarine crude terminal at the
Port of Vancouver in Washington. This terminal should help Tesoro get around the difficulties with
permitting rail terminals in California by taking Bakken crude to the Port of Vancouver by rail and
then putting it in tankers to ship to California. TLLP already owns four marine terminals in
California, so Tesoro would be able to access the tankers with ease. Tesoro is expecting to invest
$75-$100 million in the project, with an estimated initial volume of 120,000 Bpd (60,000 Bpd
committed) and an in-service date in late 2015.
ANS Bakken Bakken Advantage
Crude Cost 99.5 89.5 14
Transportation to Refinery 0 13 -13
Total Cost to Refinery 105 104 1
Less Yield Advantage 3-5
Total Advantage' ~$4-6/bbl
Port of Vancouver Project map
Source: Company Reports
Advantage of the Port of Vancouver Project
13. Operational Diversity
One of the biggest advantages that Tesoro has is its operational diversity. Since 2010, TSO has
been able to improve its marketing volumes by 55%. The company has also been able to increase
its retail network and average throughput volume per station by 250% and 20% respectively. In
FY2014, it was TSO's retail segment, not its refining, that was the company's best-performing
segment, with a YoY increase of 41.1% in operating income. This can be attributed to favourable
market conditions, where the retail segment is benefiting from a demand increase for gasoline due
to low gas prices. Moreover, the Energy information administration (EIA) forecasts U.S. gasoline
consumption to be even higher in 2015 and 2016 than it was in 2014, translating into higher retail
volumes and margins. The retail segment provides a nice hedge for its more prominent refining
segment, which has experienced narrower margins lately due to the constriction in crack spreads.
Increasing Margins
As many refiners, Tesoro should experience an increase in refining margins in the next coming
years. e. Cracking margins running along the Kern River increased 99.1% to $31.75 BOE/d on
February 23rd. In addition, cracking margins for Alaska North Slope spiked 118.8% to $30.85
BOE/d, and Arab Medium crude appreciated 142.4% to $28.09 BOE/d on the same day. On another
note, a sustained increase in gasoline consumption will continue to expand driving margins and
volumes, fueling TSO's retail segment. The company is already benefiting from the recent strength
in diesel and jet fuel, which should continue to persist in the near-medium term future.
One year Brent-WTI Spread
Source: Energy Information Administration
14. A strong supply of U.S. crude oil in the foreseeable future will keep refining costs historically low,
which will subsequently increase margins. Moreover, U.S. oil refiners possess a competitive
advantage over their peers across the Atlantic and elsewhere. They are the beneficiaries of low-
cost crude feedstock from an abundance of domestic supply. Furthermore, U.S. oil refineries
benefit from competitively priced natural gas due to booming shale output and a more developed
infrastructure. Looking forward, U.S. oil refineries may manage to augment utilization rates until
at least 2016, according to the EIA. Refinery costs of crude feedstock will continue to persist below
the cost of WTI until 2016 as more refiners find more advantaged feedstock from shale plays.
Competition Analysis
Operating Margins
Tesoro has been able to generate the highest gross and EBITDA margins per barrel when compared
to the group average. The company has been and will continue to be able to maintain this
competitive advantage with its cost saving initiatives implemented in the past and those that it plans
to implement in the coming years.
The company is currently trading on par to its peers when analyzed on a P/E and EV/EBITDA
valuation metrics. The company is below the industry median when valued based on the
DACF/EV and FCF yield. The company also offers a dividend of 1.6% compared to a group
median of 3.2%.
Company 2013 2014 2015E 2016E 2013 2014 2015E 2016E
HollyFrontier 16.0 14.2 15.5 17.1 8.3 6.3 7.4 8.9
Marathon Petroleum 13.2 14.8 15.1 15.4 4.9 5.1 5.8 6.0
Phillips 66 9.9 9.4 9.5 9.6 3.6 3.5 4.0 4.0
Tesoro 17.5 18.0 18.5 19.0 9.0 9.5 10.5 11.0
Valero 9.7 10.3 10.6 11.1 4.3 4.7 4.9 5.4
Average 13.3 13.3 13.8 14.4 6.0 5.8 6.5 7.1
Gros Margin/bbl Operating Margin/bbl
P/E EV/EBITDA DACF/EV % FCF Yield
Company name Mkt Cap ($M) EV($M) 2014A 2015E 2014A 2015E 2014A 2015E 2014A 2015E Div.Yield
Holly Frontier 7,717 8,308 15.5x 12.8x 6.7x 6.0x 10.0% 11.3% 4.7% 6.4% 7.1%
Marathon Petroelum 27,203 32,985 11.5x 9.4x 5.6x 5.1x 11.8% 12.8% 5.0% 7.1% 2.3%
Phillips 66 42,090 46,014 13.3x 11.7x 6.9x 6.1x 8.8% 8.2% 3.2% 0.4% 2.3%
Valero 31,803 35,067 8.0x 8.3x 4.5x 4.3x 17.0% 17.5% 6.6% 8.2% 2.3%
Maximum 42,090 46,014 15.5x 12.8x 6.9x 6.1x 17.0% 17.5% 6.6% 8.2% 7.1%
75th Percentile 34,375 37,804 13.9x 12.0x 6.8x 6.0x 13.1% 14.0% 5.4% 7.4% 3.5%
Median $29,503 $34,026 12.4x 10.6x 6.2x 5.6x 10.9% 12.1% 4.9% 6.8% 2.3%
25th Percentile 22,332 26,816 10.6x 9.1x 5.3x 4.9x 9.7% 10.5% 4.3% 4.9% 2.3%
Minimum 7,717 8,308 8.0x 8.3x 4.5x 4.3x 8.8% 8.2% 3.2% 0.4% 2.3%
Tesoro Corporation 11,299 17,081 12.0x 11.6x 5.9x 5.4x 10.9% 10.5% 4.8% 1.1% 1.6%
Tesoro Gross and Operating Margins vs. Peers
Source: Company Reports and Sell Side Estimates
Comparative Company Analysis
15. Valuation
In order to value Tesoro, a sum of the parts valuation was used. We think that it is instructive to
look at the TSO upside opportunity using a sum of the parts valuation approach. Applying target
multiples to each business (refining, logistics and retail), we arrive at a Dec-15 price target of
~$109/share, using forward multiples on 2016E EBITDA.
Operating Assumptions
We expect the company to increase its throughput by 5% from 2015-2017
Gross refining Margins have increased over the next years and should continue in the future
Utilization rates should increase slightly and then stabilize at 92% going forward
The retail segment should grow over the coming years organically but also mainly through
acquisitions. The major growth driver is the company continuing its retail integration
The logistics division should experience a lot of growth mainly due to synergies generated
with its Los Angeles acquisitions
Operating assumptions
Projected Fiscal Years Endig December 31st
2012A 2013A 2014A 2015E 2016E 2017E
Crude Throughput
California 339 387 409 889 469 914 493 410 518 080 543 984
Pacific Northwest 125 902 152 056 174 323 183 039 192 191 201 801
Mid-Continent 82 110 99 167 113 689 119 373 125 342 131 609
Total 547 399 661 112 757 926 795 822 835 613 877 394
Gross Refining Margins
California 4.5 5.5 6.0 6.5 6.5 6.5
Pacific Northwest 7.0 7.0 7.5 7.5 7.5 7.5
Mid-Continent 13.0 12.5 13.5 14.0 14.0 14.0
Total 6.5 7.1 7.7 8.1 8.1 8.1
Refinery Utilization Rate
California 83.0% 92.0% 91.0% 91.0% 91.0% 91.0%
Pacific Northwest 76.0% 76.0% 79.0% 80.0% 80.0% 80.0%
Mid-Continent 96.0% 89.0% 96.0% 96.0% 96.0% 96.0%
Total 85.8% 90.6% 91.7% 92.0% 92.0% 92.0%
Retail Growth Rate - 6.2% 15.5% 10.0% 10.0% 10.0%
Logistics Growth Rate - - 451.7% 20.0% 20.0% 20.0%
Opex% Gross Margins
Refinery 41.6% 38.2% 38.1% 39.3% 39.3% 39.3%
Retail 58.2% 64.9% 60.6% 61.2% 61.2% 61.2%
Logistics - 51.5% 64.1% 57.8% 57.8% 57.8%
Intercompany Eliminations % Refining - -1.1% -3.6% -3.6% -3.6% -3.6%
SG&A % Gross Margin 8.8% 7.1% 3.9% 6.6% 6.6% 6.6%
Depreciation % Gross Margin 12.7% 10.3% 8.6% 10.5% 10.5% 10.5%
Interest Expense % Gross Margin 4.7% 3.2% 3.3% 3.7% 3.7% 3.7%
Income taxexpense 58.5% 13.6% 12.8% 28.3% 28.3% 28.3%
17. Sum of Parts Valuation
Refining
For Refining, we believe that a 0.5x discount to the long-term historical group average multiple of
~4x is appropriate, given the challenged operating and regulatory environment in California, which
would imply a target value of $13.9B. Also, we estimate that every turn of EBITDA multiple is
worth ~$12-13/share.
Retail
For Retail, we looked at recent comps that have spun off their retail businesses, such as CST
Brands and Murphy USA, in addition to other public convenience store players, such as Casey’s,
Couche-Tard, and Pantry. These companies currently trade at ~9.0x forward EBITDA, which we
conservatively applied a 1x discount, implying a value of $2.6B for TSO’s retail business. We
estimate that each turn of EBITDA multiple for Retail is worth ~$2/share to TSO’s stock price.
2016
Segment Corporate EBITDA Forward Implied
EBITDA Allocation Post Corporate Multiple Value
Refining 3 753 517 (219 818) 3 533 700 3.5x 13 137 310
TLLP LP 269 910 - 269 910 13.0x 3 508 826
Retail 331 934 - 331 934 8.0x 2 655 474
Total 4 355 361 (219 818) 4 135 543 19 301 610
Net Debt 2 264 000
Public Equity Value of TLLP 3 132 000
Equity Value 13 905 610
Diluted Shares (000's) 122 000
Implied Price/Share 113.98
Current Price 91.15
Implied Upside 25.0%
2014A Dividends 1.43
Dividend Yield 1.6%
Implied Total return 26.6%
18. TLLP
We valued TLLP at a combination of the public market enterprise value of the LP entity and 15x
2015E GP distributions. We note that the 15x distributions is a discount to TSO’s 25x view and
the comparable company average 20x, given that TSO has lower built-in distribution growth than
many of its refining peers.
Company Market EV/EBITDA
Cap 2013A 2014A 2015E
CST Brands 2,646 9.3x 10.0x 9.3x
Murphy USA 2,588 8.4x 8.4x 9.2x
Casey's 2,757 10.9x 9.3x 8.5x
Couche-Tard 20,838 17.4x 13.1x 12.4x
Pantry 482 7.0x 7.0x 6.4x
Average 10.6x 9.6x 9.2x
Company Market EV/EBITDA
Cap 2013A 2014A 2015E
MPLX 4,710 29.1x 25.4x 22.0x
PSXP 5,196 40.4x 28.2x 19.5x
TLLP 3,716 15.8x 13.5x 11.3x
VLP 2,962 42.2x 31.1x 25.2x
Average 31.9x 24.6x 19.5x
19. Appendix
Appendix 1: Management Team
Name Title Background
Gregory J. Goff President and
Chief Executive
Officer
Gregory J. Goff was named President and CEO of Tesoro Corporation in May 2010. Before
joining Tesoro, Mr. Goff served various management positions beginning 1981 at
ConocoPhillips Corporation most recently as Senior Vice President, Commercial from 2008 -
2010. He was President of ConocoPhillips specialty businesses and business development
from 2006-2008, President of ConocoPhillips U.S. Lower 48 and Latin America exploration
and production business from 2004 – 2006, President of ConocoPhillips Europe and Asia
Pacific downstream business from 2002 – 2004, Chairman and MD of Conoco Limited (a
United Kingdom based refining and marketing affiliate) from 2000-2002, and director and
CEO of Conoco JET Nordic from 1998-2000. He has served on the National Advisory Board
of the University of Utah Business School, Chevron Phillips Chemical Company and is a
member of the downstream committee of the American Petroleum Institute. From
2008 – 2010, he also served as a Director of DCP Midstream GP LLC. Mr. Goff received a
bachelor of science from University of Utah in 1978 and an MBA from the University of Utah
in 1981.
Keith Casey Executive Vice
President,
Operations
As the principal operating officer, Mr. Casey oversees Tesoro’s refining, marketing, logistics
and marine functions. Casey joined Tesoro in 2013 as Senior Vice President, Strategy and
Business Development. He also serves on the Board of Directors for Tesoro Logistics. Prior to
joining Tesoro, Mr. Casey served as Vice President, BP Products North America, at the Texas
City Refinery, a multi-billion dollar facility and third largest in the U.S. He previously held
roles with Motiva Enterprises, Shell and Praxair. Mr. Casey holds a Bachelor of Science
degree in metallurgical and materials engineering from California Polytechnic State
University, San Luis Obispo.
Steven Sterin Executive Vice
President and
CFO
Mr. Sterin will join TSO in October 2014 as the EVP and CFO. Prior to Tesoro, Mr. Sterin
was senior vice president and chief financial officer for Celanese Corporation, a global
technology and specialty material company, for seven years. During this time, he was also
president of Celanese’s Advanced Fuel Technologies business. Mr. Sterin joined Celanese in
2003 as director of finance and controller for the company’s chemical business and also served
as corporate controller and principal accounting officer before being appointed CFO. Prior to
Celanese, Mr. Sterin spent six years with global chemicals company Reichhold, Inc. in a
variety of financial positions, including director of tax and treasury in the Netherlands, global
treasurer and vice president of finance for one of the company’s divisions in North Ca
20. Appendix 2: References
1. JP Morgan 2014 Equity Research – Initiating Coverage
2. RBC 2014 Equity Research – Initiating Coverage
3. 2015 Corporate Presentation – Scotia Bank Howard Veil Energy Conference
4. 2014 Corporate Presentation – Bank of America refining Conference
5. 2014 10K and MD&A
6. 2013 10K and MD&A
7. 2012 10K and MD&A